Featured
A Look at a Bull/Bear Sentiment Indicator
Inflation and climate change are two of the key issues in the current Canadian election (Monday Sep 20). We look at the two of them and remind investors that there are stocks and ETFs that are available to combat both inflation and climate change. Our “Chart of the Week” looks at a bull/bear sentiment indicator. We were a bit surprised to see how quickly sentiment turned bearish.

Inflation has emerged as a key theme in the Canadian Federal election to be held on September 20, 2021. The other key theme that has emerged has been climate change. There are others as well but we’ll focus on inflation and climate change. Canada’s inflation rate (CPI) jumped 4.1% year over year in August, up from 3.7% in July. The rate exceeds the Bank of Canada’s (BoC) target rate of 1%-3%. It was the fastest pace of CPI growth since 2003.
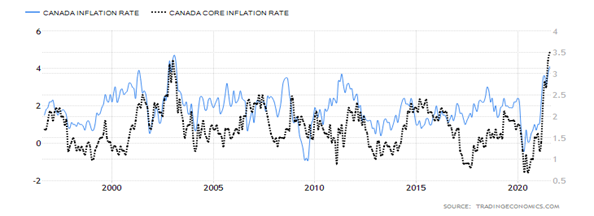
However, when one strips out the volatile energy and food prices, the core CPI rate rose only 3.5% vs. 3.3% in July. Both were slightly above the consensus of 3.9% and 3.3% respectively. The core rate was also the highest seen since 2003. However, compared to levels seen in the 1970s, inflation remains rather tame.
Nonetheless, it is no surprise it becomes contentious in the heat of an election. The price leader was transportation costs which was up 8.7%. But if one excludes gasoline costs, the rise was only 3.2%. However, a host of items are causing inflation to rise, not just in Canada but in the U.S. and elsewhere as well. Part of the reason is that inflation is coming out of the weakness seen during the early stages of the pandemic in 2020. It tends to exaggerate price moves when a year ago they took a dip. The energy sector is a prime culprit; however, Canada, while an energy producer, is subject to the world price like everyone else. And here OPEC and Russia along with the U.S. as the world’s largest producers have considerable sway.
The pandemic and climate change have exposed all sorts of problems. Climate change—or at least let’s say bad weather—has sparked droughts and floods that destroyed harvests and have negatively impacted global food supplies. There are vulnerabilities in the food system that are negatively impacting production, supply, and delivery. Ocean and shipping rates have soared, fuel prices have soared, and there is a shortage of truck drivers, not just here in Canada but elsewhere—in the U.S., the EU, and the U.K. as well.
Also driving the shortages are worker mismatches. The mismatch is occurring between industries hiring and those seeking jobs. Many have moved onto something else, while others have just moved away. Because of the pandemic, foreign workers that filled a lot of jobs, particularly in agriculture, have been unable to return. Shelter costs and lack of child care options play a role as big cities are notoriously expensive. Rent increases, for example, are actually higher than is being reported, according to many calculations. Inflation here hits low-income and seniors harder than others. Pay expectations aren’t meeting rent requirements and many with children can’t find or afford proper child care so that they can return to the workforce. So, what we have instead is continuing high unemployment and inflation. In a word—stagflation.
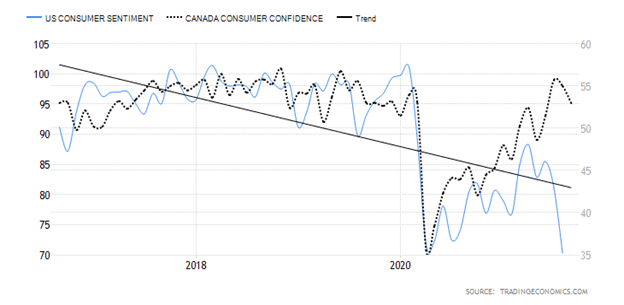
It has been a difficult year. The rise of the Delta variant, coupled with large groups either refusing to get vaccinated or for other reasons unable to, has resulted in hospital ICUs in some provinces being strained beyond capacity. Despite the unvaccinated dominating hospitals and ICUs, they are also protesting that they can’t be forced to get vaccinated. With COVID infections rising, that also puts pressure on employment, particularly in service industries. Add in a steady dose of bad news related to Afghanistan, global political instability, and extreme weather events—wildfires, hurricanes, and floods—and all have combined to erode consumer confidence.
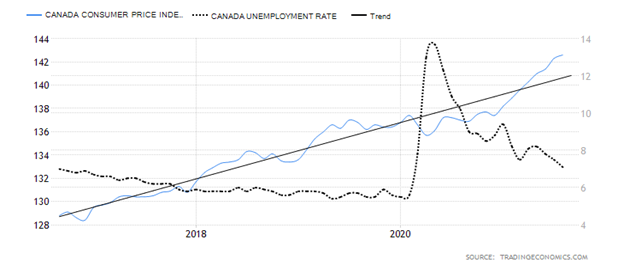
As the chart below shows, consumer confidence has been waning, particularly in the U.S. following an initial upward blip out of the pandemic hole. It is not as pronounced in Canada but it too has started to turn down. That bodes poorly for the future for consumer-led industries retail and service. We also show the rising CPI vs. the unemployment rate. While the unemployment rate has been falling, it remains above pre-pandemic lows.
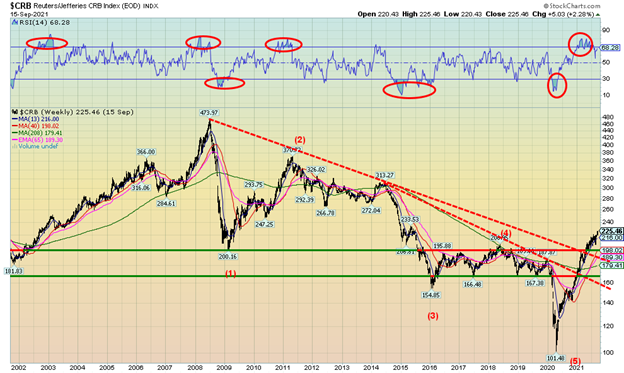
Whether inflation is transitory as claimed by both Tiff MacKlen, Governor BofC, and Jerome Powell, Chair Federal Reserve is moot. Time will tell, although so far there is no strong evidence that this will be long-lasting or go sharply higher. No one is calling for 1970s inflation. As much as numerous prices have soared, some have already collapsed such as lumber. Other price increases are already starting to moderate. The CRB Index continues to climb and is now up 34% in 2021 and 122% from the depths of the March 2020 pandemic low. But recall the CRB collapsed 46% into the March 2020 pandemic low. So, a strong rebound rise is not particularly unusual. We are in the midst of a cyclical rise in commodity prices as seen in the chart of the CRB Index below. Energy plays a big role as oil prices are up 44% in 2021 and natural gas (NG) has soared 94%. Again, they are rising from steep holes seen in 2020.
Consumer Confidence – U.S. and Canada
Canada – CPI and Unemployment Rate
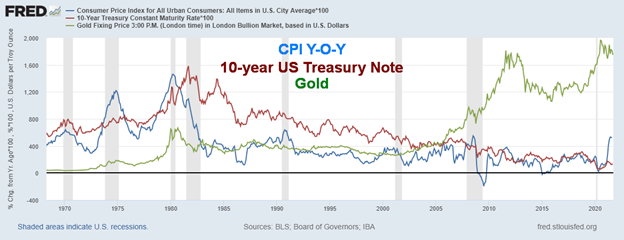
We also cannot help but note that we now have wide negative interest rates. Inflation in the U.S. is now at 5.3% while the U.S. 10-year treasury note is trading currently around 1.38%, a negative spread of 3.92%. That’s as wide as it has been for some time. And it may narrow going forward if long interest rates rise in response to higher inflation. It’s the same in Canada with annual inflation at 4.1% and the Canadian 10-year bond yield (CGB) at 1.29% for a negative spread of 2.81%. In the past, gold has responded well to negative interest rates. However, we’d never know that at the moment as, instead, gold is fearing tapering and potentially higher interest rates. Still, given the current negative spreads, one should note that the global bond market is not positioned for sustained higher levels of inflation.
The other big issue is climate change—or the rise in severe weather disasters as others might characterize it. The doubters characterize it as nature as per usual. Well, not quite. The costs of these disasters are rising as we have pointed out in the past. The cost of Hurricane Ida is not yet tabulated given the severe pounding that Louisiana took followed by severe flooding up the U.S. east coast. Add in wildfires in the West and the costs will be in the $10s of billions and could even set a record. And not all is covered by insurance. Documenting where we sit is moot, given that records show we have endured the hottest decade on record, and the hottest year and month on record. Temperatures, according to some studies, are the highest in 125,000 years. Oceans have risen 8 inches since 1900. Doesn’t seem like much but ask fully inhabited islands how that is. Temperatures are up over 1.06 ⁰C from pre-industrial levels. Again, doesn’t seem like much, but we are approaching danger levels. The consensus is that a rise above 3⁰C would be extremely dangerous for the world. We have seen record 50⁰C days in 2021 somewhere in the world.
So maybe it’s not surprising that a survey by Angus Reid (https://angusreid.org/federal-election-top-issues/) regarding top issues for this election finds that millennials aged 18–34 say climate change is the number one issue. Overall, in the same survey climate change topped the list and ranked in the top five for all age groups. Climate change was the second-ranked issue for females 35 and over and for males 35–54. Only in males 55 and over did climate change rank fifth as an issue. Corporations are taking climate change seriously as seen by the number implementing environmental, social, and governance (ESG) strategies and in the way that financial institutions and insurance companies are also pushing them.
The CRB Index (a commodity index made up of 19 components led by agriculture 41%, energy 39%, 13% industrial metals, and 7% precious metals) has broken out a long-term downtrend line dating back to 2008. Many believe that commodities are now embarking on another major up wave. The last major commodity cycle peaked back in 2008 although components may not all peak at once. The CRB Index has recently pulled back from overbought levels. That should be helpful going forward.
CRB Index – 2001–2021
So, what is an investor to do? Investors may wish to look at a plethora of ETFs that are inflation-linked. They include both bonds and equities. As to ESG stocks and environment stocks, there are again numerous clean energy ETFs and renewable energy stocks. Gold is considered an inflation hedge, but it is also considered a deflation hedge. We consider gold more closely linked to depreciating currencies as the link with both inflation and deflation is tenuous. Gold acts like a currency and as currencies depreciate gold will rise. And vice versa. Gold is also a hedge against both geopolitical and government uncertainty.
We learn now that a U.N. analysis predicts the globe could warm by 2.7⁰C by the end of century, given the current direction of the world. At best, the world appears to be on track to increase, not decrease, emissions by 16% by 2030. What it is saying is that if you think things are bad now, they are going to get worse. A lot worse. It all reminds us of a book we read years ago: Climate Wars by Gwynne Dyer (2010). The book was unflinchingly bleak. “Waves of refugees; dozens of failed states; raging pandemics; all-out war.” It would also result in a decline in the number of people living in the world. It reads like science fiction but it is becoming increasingly true. Not a pretty picture. Will technology save us?
We live in an increasingly volatile world. A deadly pandemic, climate change, geopolitical instability, growing polarization, religious conflicts, inequality, poverty, underemployment, government corruption, and more. Investing has never been so difficult, even as the market keeps going up.
Chart of the Week
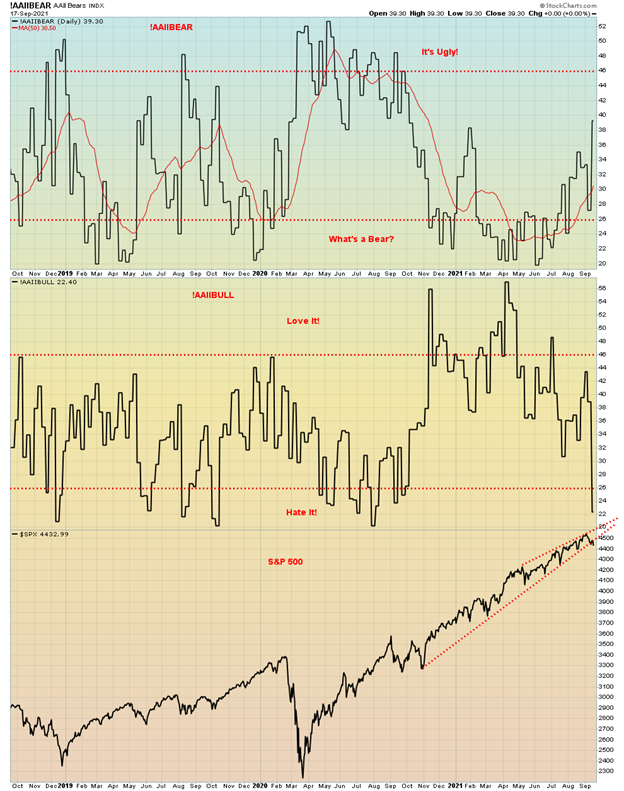
While we have always followed the AAII Investor Sentiment Survey we have rarely, if ever, noted it in our commentaries. However, this week we felt we couldn’t ignore it. AAII is an independent non-profit organization so they have no skin in the game to tilt surveys one way or the other. Their survey is a measurement of the percentage of individual investors that are bearish, bullish, or neutral on the market. Polls are conducted weekly.
So, we were surprised to discover how quickly it had become bearish, even as the S&P 500 is down only about 2.5% from its recent all-time high. Hardly a barn-burner. However, the Bull survey has plunged into bear territory quickly and the bear survey, while not all bearish, jumped quickly. The net bear is negative 16.90, the lowest reading since September 2020. In many respects the two surveys are just mirror images of each other. At least, they should be. Some other surveys we looked at also became bearish very quickly. There appears to be an overwhelming consensus that we should face a 5–10% correction. We count ourselves amongst them. Mea culpa.
Naturally, given the markets just keep going up, it emboldens the bulls but it also makes the bears nervous. After all, can a market just keep on going up, and up, and up? Okay, yes. Raise interest rates and taper and who knows what might happen. But the reality is we all know the Fed is not about to hike interest rates and taper remains just talk, even as the Fed does its usual doublespeak to keep everyone guessing. Yes, thanks to the recent good economic numbers of the Philly Fed and retail sales, the 10-year U.S. treasury note yield that was starting to fall went back up again. But, as we note in our bond discussion, the current up move appears to us as corrective and not the start of a new wave to higher interest rates.
So, with investors turning bearish in a hurry, we can say that, if they are all turning bearish, then the bear move everyone is expecting might not happen. Or, at least we temper the thought. The reality is that the S&P 500 has now gone some 320 days without testing the 200-day MA. Oh yes, we’ve seen that before. Especially in the late 1990s before the dot.com crash got underway and again in 2016–2018 before all the trade war fight with China got underway. And that too preceded the highs that were seen before the 2020 pandemic crash, although not to the same extent. So, spikes in bullish sentiment are not surprising just before sudden changes in everything.
We’ll monitor the put/call ratio carefully and if a sudden spike in puts occurs, it may be a sign that the market is becoming too bearish too quickly. When the market starts to lean one way and quickly lean that way, the odds start to increase that they are poised to be disappointed. Bearish yes, but cautiously bearish and ready to switch quickly. If everyone turns bearish, who is going to sell the market? For long-term investors, it’s probably best to do nothing. The trend is still up until it isn’t.
MARKETS AND TRENDS
| % Gains (Losses) Trends | ||||||||
| Close Dec 31/20 | Close Sep 17/21 | Week | YTD | Daily (Short Term) | Weekly (Intermediate) | Monthly (Long Term) | ||
| Stock Market Indices | ||||||||
| S&P 500 | 3,756.07 | 4,432.99 | (0.6)% | 18.0% | neutral | up | up | |
| Dow Jones Industrials | 30,606.48 | 34,584.88 | (0.1)% | 13.0% | down | up | up | |
| Dow Jones Transports | 12,506.93 | 14,267.96 | (0.7)% | 14.1% | down | neutral | up | |
| NASDAQ | 12,888.28 | 15,043.97 | (0.5)% | 16.7% | up (weak) | up | up | |
| S&P/TSX Composite | 17,433.36 | 20,490.36 | (0.7)% | 17.5% | neutral | up | up | |
| S&P/TSX Venture (CDNX) | 875.36 | 886.83 | (1.8)% | 1.3% | down | down | up | |
| S&P 600 | 1,118.93 | 1,331.35 | 0.3% | 19.0% | down | neutral | up | |
| MSCI World Index | 2,140.71 | 2,374.90 | (0.4)% | 10.9 | up (weak) | up | up | |
| NYSE Bitcoin Index | 28,775.36 | 47,447.56 | 4.9% | 64.9% | up | up (weak) | up | |
| Gold Mining Stock Indices | ||||||||
| Gold Bugs Index (HUI) | 299.64 | 237.63 | (2.3)% | (20.7)% | down | down | neutral | |
| TSX Gold Index (TGD) | 315.29 | 274.11 | (2.6)% | (13.1)% | down | down | neutral | |
| Fixed Income Yields/Spreads | ||||||||
| U.S. 10-Year Treasury Bond yield | 0.91 | 1.37% | 2.2% | 50.6% | ||||
| Cdn. 10-Year Bond CGB yield | 0.68 | 1.28% | 4.1% | 88.2% | ||||
| Recession Watch Spreads | ||||||||
| U.S. 2-year 10-year Treasury spread | 0.79 | 1.14% | 1.8% | 44.4% | ||||
| Cdn 2-year 10-year CGB spread | 0.48 | 0.81% | flat | 68.8% | ||||
| Currencies | ||||||||
| US$ Index | 89.89 | 93.18 | 0.6% | 3.7% | up | up | down | |
| Canadian $ | 0.7830 | 0.7845 | (0.7)% | 0.1% | down | down | up | |
| Euro | 122.39 | 117.29 | (0.7)% | (4.2)% | down | down | up | |
| Swiss Franc | 113.14 | 107.27 | (1.5)% | (5.2)% | down | down | up | |
| British Pound | 136.72 | 137.33 | (0.7)% | 0.5% | down | neutral | up | |
| Japanese Yen | 96.87 | 90.93 | (0.1)% | (6.1)% | neutral | down | down | |
| Precious Metals | ||||||||
| Gold | 1,895.10 | 1,751.40 | (2.3)% | (7.6)% | down | down | up | |
| Silver | 26.41 | 22.34 | (6.5)% | (15.4)% | down | down | up | |
| Platinum | 1,079.20 | 930.60 | (2.7)% | (13.8)% | down | down | neutral | |
| Base Metals | ||||||||
| Palladium | 2,453.80 | 1,983.8 | (6.7)% | (19.2)% | down | down | up (weak) | |
| Copper | 3.52 | 4.25 | (4.6)% | 20.6% | down (weak) | up | up | |
| Energy | ||||||||
| WTI Oil | 48.52 | 71.82 | 3.0% | 48.0% | up | up | up | |
| Natural Gas | 2.54 | 5.11 (new highs) | 3.4% | 101.2% | up | up | up |
New highs/lows refer to new 52-week highs/lows and in some cases all-time highs.
For the second week in a row the markets faltered and fell. That was despite some decent economic news from the Philly Fed and retail sales. Maybe they thought it would be a one-off. The Michigan Consumer Sentiment Index came in below expectations at 71 when they expected 72. So maybe that became the focus that the economy may not be doing as well as everyone thinks. This coming week is the FOMC and, while the wide expectation is no interest rate hike, there is doubt about whether the Fed might taper.
The S&P 500 fell 0.6%, the Dow Jones Industrials (DJI) lost a small 0.1%, the Dow Jones Transportations (DJT) continued its woes, down 0.7%, while the NASDAQ was off 0.5%. The small cap S&P 600 eked out a gain of 0.3%, a bright spot. The S&P 500 Equal Weight Index fell 0.6%. In Canada, the TSX Composite dropped 0.7% and the TSX Venture Index (CDNX) was down 1.8%. Bitcoin recovered a little, up 4.9%. Overseas, the MSCI World Index was down 0.4%. In the EU, the London FTSE dropped 0.3%, the Paris CAC 40 was off 1.4%, and the German Dax dropped 0.8%. In Asia, China’s Shanghai Index (SSEC) was down 2.4%, not helped by Evergrande (see write-up below). The Tokyo Nikkei Dow (TKN), however, didn’t blink and was up again, gaining 0.4% to new 52-week highs.
Elliott Wave International notes that the U.S. markets have fallen in five small waves from the September 2 high. Ironically, September 3 marked the high of the 1929 stock market. Not that we are suggesting a crash in October, but who knows with the debt limit looming and D-Day occurring in October. The expectation, at least for the moment, is that they come to their senses and at least kick the can down the road once again. But polarization in the U.S. runs deep, so who knows. Anyway, a five-wave decline from September 2 suggests that we are starting a corrective wave to the downside. The question is, how deep? As we noted in our chart of the week, the market has quickly become bearish and that may be a stopper to any big decline.
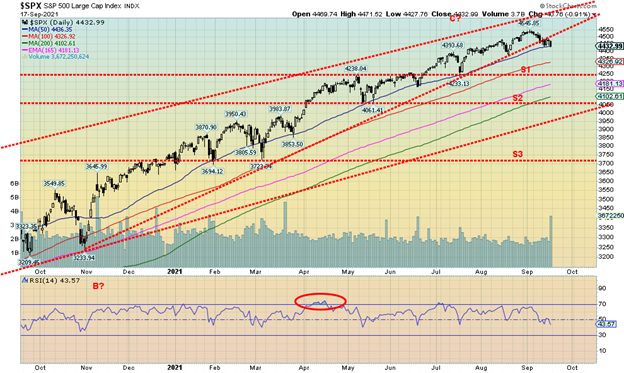
The S&P 500 closed below its uptrend line from the November 2020 low and is resting on the 50-day MA currently at 4,436 (close Friday at 4,433). So, a bounce early this week is possible. A break under 4,365 would suggest lower prices to test the 100-day MA near 4,325 and a support line down to 4,250. Below 4,250, a decline to the 200-day MA is possible (currently at 4,100). A rebound that takes us back above 4,500 is positive and suggests potential new highs ahead. This has been a very long bull market. The 9% correction in November 2020 is the last significant correction. Volume was high this past week and that alone suggests we should move lower. For traders, they should be on the sidelines. The short-term trend has turned neutral and is threatening to turn down. The intermediate trend remains up. So far, this pullback is only of concern to traders and short-term players. It has been some time that the intermediate trend turned down.
For the moment we are sticking to a possible 10% correction. We’ll be watching for signs that this might eventually turn into something worse, especially with the debt limit looming in October.
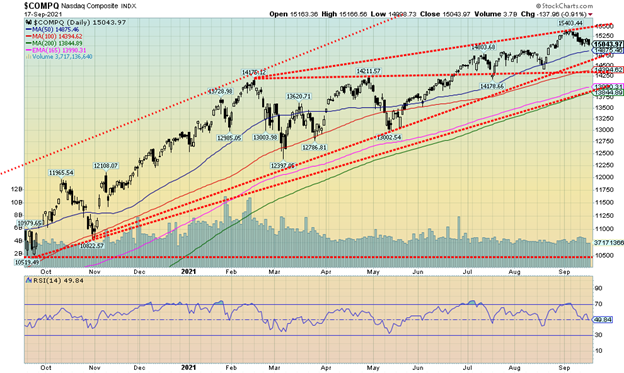
The NASDAQ fell 0.5% this past week but most of that occurred on Friday. Unlike the S&P 500, the NASDAQ has not yet broken down below its uptrend line from the October/November 2020 lows. Support looms at 14,875, the 50-day MA, and again at 14,650 the uptrend line. Once below the uptrend line, the odds increase that we could get a test of the 200-day MA currently near 13,850. That would be a 10% correction which is in line with forecasts for this correction. But as we note, with the market quickly becoming bearish and wide expectations of a 10% correction, the question is, will it actually happen? The FAANGs and company didn’t fare as well this past week. Mixed, actually. Facebook fell 3.7%, Apple lost 2.0%, Amazon dropped a small 0.2%, Netflix was down 1.6%, and Google lost 0.4%. Microsoft was a winner, up 1.4% and so was Tesla, up 3.2%. Twitter gained 1.5%, Baidu lost 1.1%, Alibaba dropped 4.8%, and Nvidia lost 2.6%. Mostly, however, the FAANGs and company lost. Regaining 15,250 would be positive and above 15,350 new highs are probable. The NASDAQ so far is down a paltry 2.3% from the high—nothing to get too excited about. As noted, the danger comes under 14,650.
China Evergrande Group
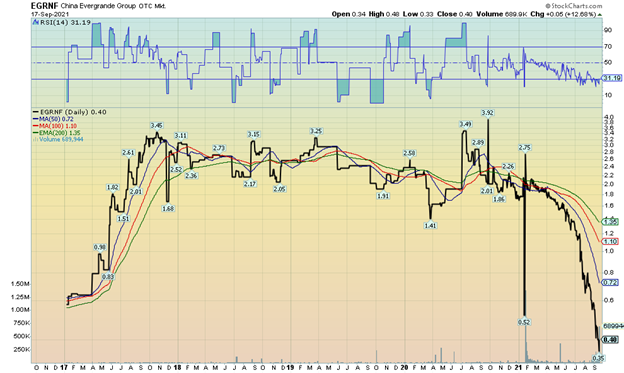
China’s Evergrande Group (EGRNF/OTCBB, SEHK/HK)) is the second-largest property developer by sales in China. It is the 122nd largest group in the world by revenue, according to Fortune Global 500 list. Evergrande, besides being a huge real estate conglomerate, is through subsidiaries involved in sports, health, tourism, entertainment, automotive, finance, food, and music. Evergrande has over 200,000 employees and indirectly creates some 3.8 million jobs every year. It’s a giant. It is also in deep doo doo. It is buried in debt believed to be around $300 billion. It is unable to pay its suppliers. It is threatening default on its debt.
So, what—it’s China, right? Well, yes, but no. A collapse of Evergrande could have global ramifications. They can’t get new loans. Rating agencies have downgraded them to junk. Its stock has fallen 85% this year and is down 92% from its 2017 high. While its main stock listings are in Asia, particularly on the Hong Kong Hang Seng, it does trade in North America on the OTCBB as a foreign player. A collapse of Evergrande would impact global banks, suppliers, home buyers, and investors. It is tied up in many cross defaults so if they default, that could trigger other ones. If Evergrande defaults, it could cause the collapse of its suppliers which in turn impacts the banks. Already there are other companies being downgraded.
It is in the category of “too big to fail.” So many expect that the Chinese government will have to step in to prevent further contagion. But the question that begs is, are there other Evergrande’s out there?
Philly Fed and Canada Manufacturing PMI
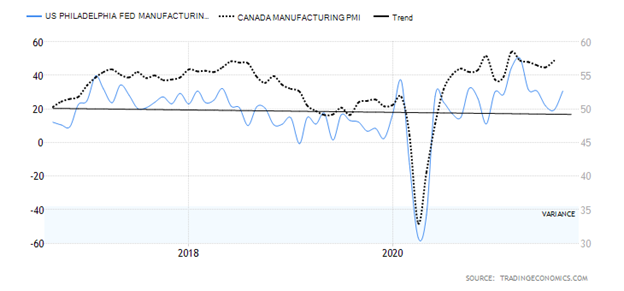
The Philadelphia Fed manufacturing number surprised on the upside and it was one of the reasons gold took a big tumble on September 16. The Philly Fed, a measure of manufacturing and business growth in the Pennsylvania, New Jersey, and Delaware regions came in above expectations at 30.7 in September vs. 19.4 in August and well above forecasts of 18.8. It caught everyone by surprise, suggesting that manufacturing and business activity was expanding faster than everyone expected. We overlaid it with Canada’s Markit Economics Manufacturing PMI for comparison’s sake. It goes only to July but it too had been coming in higher than expected. It was the 14th straight month of increased activity and the fourth highest in the history of the index. The next release is October 1.
U.S. and Canada Retail Sales – Month over Month
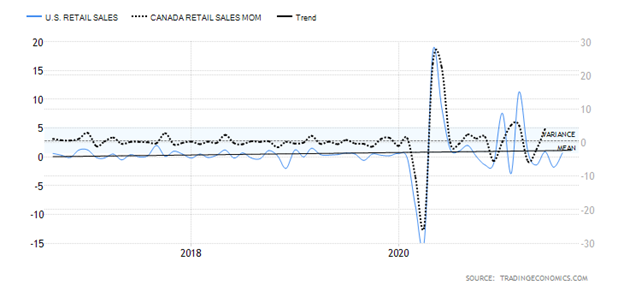
Retail sales for August unexpectedly jumped 0.7%, well above the consensus of an 0.8% drop. The July retail sales were revised down to down 1.8%. It caught everyone by surprise and also played a big role in gold’s tumble on September 16. Year-over-year retail sales were up 15.1% which was the same as July’s. Nonetheless, the August number caught analysts by surprise. Some suggest that it may be a continuance of pent-up buying or may even be early Christmas shopping, with all the tales of supply shortages. Again, we overlaid Canada’s retail sales but they go only to July. Canada’s retail sales have also been stronger than expected. Canada’s retail sales will be released next Thursday.
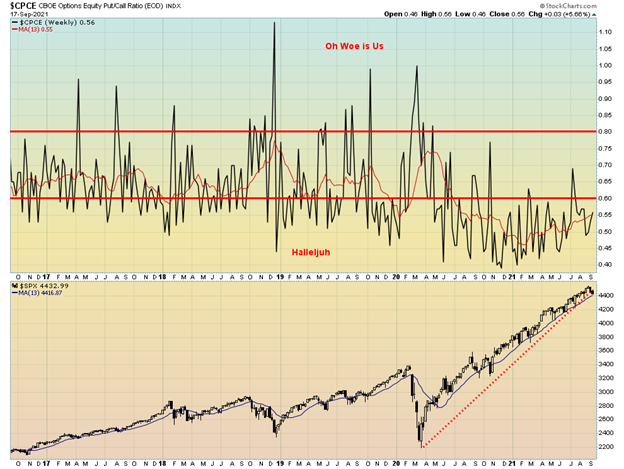
The put/call ratio is still quite bullish at 0.56. It has, however, been jaggedly rising in 2021, making higher lows. But we are still not yet over 0.60 which is at least neutral. One could consider this bearish that there remain so many bulls, even as the market has pulled back in the past couple of weeks. The market is not overly bearish, instead remaining quite bullish.
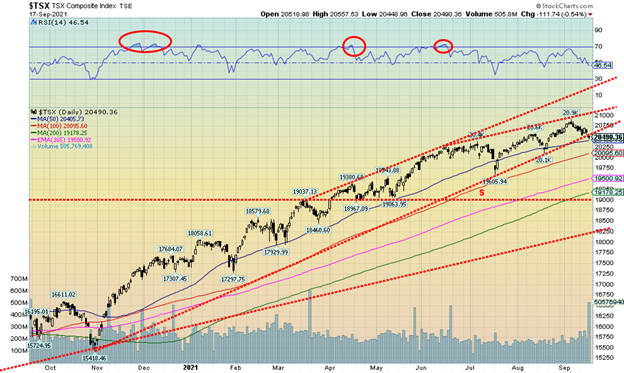
The TSX Composite fell 0.7% this past week and now appears poised to break the uptrend line from November 2020. Friday’s close was under the uptrend line and sitting on the 50-day MA currently at 20,405. A firm break under 20,400 could send the TSX down to 20,000. The TSX Venture Exchange (CDNX) continued its recent losing streak, losing 1.8% on the week and is now clinging to 1.3% gain in 2021. This past week’s volume was high on the decline for the TSX, suggesting the potential for more to come to the downside. Holding the TSX up was the Energy Index (TEN) that gained 4.3%. Other than that, the only other one that saw a gain on the week was Real Estate (TRE), up 0.3%. Leading the downward parade was Metals & Mining (TGM), off 5.0% followed by Consumer Staples (TCS), down 3.3%. Golds (TGD) completed the top three losers, down 2.6%. Without the solid gain by the TEN, the loss on the week for the TSX would most likely have been worse. Often hitting a support line like the 50-day MA the market rebounds. However, given that the market is not as yet oversold (RSI at 46), the likelihood is that we should see more losses ahead. Regaining 20,700 would be positive and suggest that higher levels should be seen.
U.S. 10-year Treasury Bond/Canadian 10-year Government Bond (CGB)
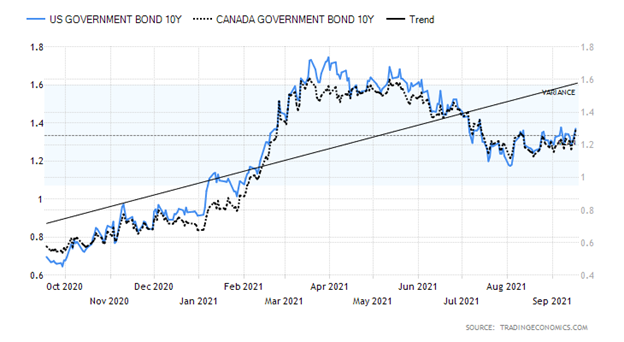
Stronger than expected retail sales and Philly Fed helped to propel bond yields slightly higher this past week. There was only mild moderating effect from the September Consumer Sentiment Index that came in at 71, below the expected reading of 72. It was mildly better than the previous reading of 70.3. Jobless claims also jumped to 332,000, higher than last week’s 312,000 and above the expected 300,000. Does that bode poorly for the September jobs report due out on October 8? It’s hard to say. That’s still three weeks away, although the cut-off date is around now. The big story for next week is the FOMC meeting on September 21 and 22. There is no expectation that the Fed will raise rates. So, ears and eyes will be on the possibility of tapering. While there has been some hawkish shift for Fed members, our expectations are that there will not be a big announcement on tapering as the Fed will wish to see more data and especially the September jobs report. The question is, will the Delta variant do further damage to the economy? The U.S. 10-year treasury note rose to 1.37% this past week, up from 1.34% the previous week. Canada’s Government of Canada 10-year bond (CGB) rose to 1.28% from 1.23%. Other numbers of importance out this coming week are housing starts on Tuesday for both the U.S. and Canada. Fed Chair Jerome Powell will speak on Friday. The jagged rise for bond yield since hitting a low in August appears to us as corrective. Our expectation then is there will be another wave to the downside to complete a larger ABC pattern. After that, interest rates rise again. Looming, of course, is the debt limit (discussed below).
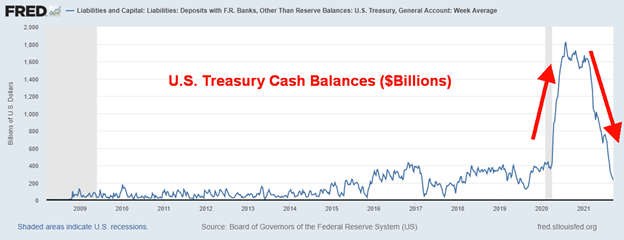
Down, down, down we go. How low it will go, nobody knows. Yes, the U.S. Treasury is swiftly running out of cash. Oh, it has been this low before but not in the middle of a polarizing battle over the debt limit. The clock, as we understand it, runs out in October. And then what? The U.S. defaults? That would cause a bit of a stir in global financial markets. That might even cause a stock market crash. Interest rates would soar. The Federal government would shut down. Many things would be starved of funds—disaster relief, Medicaid, school funding, and a host of other things. So, what if millions become unemployed? The Democrats have added a debt limit to what is called a short-term continuing resolution (CR). That could come as early as this Monday, September 20. Senate Republicans are vowing to block it. Short-term measures to avoid default run out in October. The U.S. could/would face a debt downgrade. That has happened before in 2011 during another debt limit showdown that saw the U.S. lose its AAA rating down to AA+. The U.S. as junk bonds? There appears to be no more than about eight weeks’ worth of cash in the till at current burn rates.
Of course, they could just vote to defer it once again. Kick the can down the road. The U.S. has been trapped by creating a debt limit. It currently sits at $22 trillion. U.S. Federal debt is currently at $28.8 trillion. It is not as if they haven’t agreed before to either raise it, temporarily extend it, or revise the definition. It has happened 78 times since 1960: 49 times under Republican presidents and 29 times under Democrat presidents. But then the U.S. has never been more polarized. Still, we expect the Republicans to blink and they will avert a default but they may go to the brink. However, in blinking we are not holding out for a new debt limit. Just another kick of the can down the road.
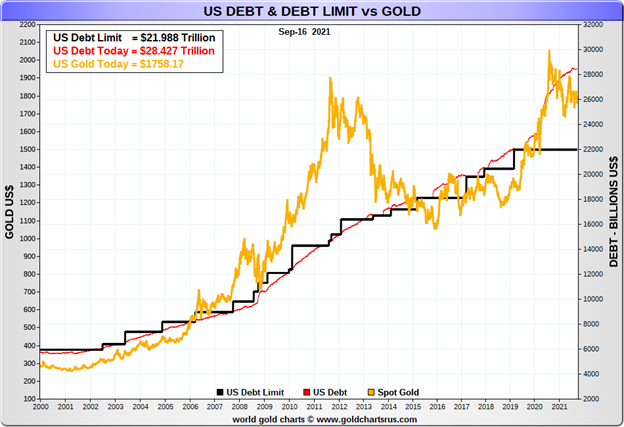
Yes, there does appear to be a relationship between U.S. debt and gold. They both keep on rising. Since 2000 gold has gone up 506% while U.S. Federal debt is up 408%. The debt limit has increased 300% during the same period. The implication is that gold might move higher if this debt limit crisis continues. A failure to raise the debt limit could result in a loss of confidence in the government. And that would be good for gold.
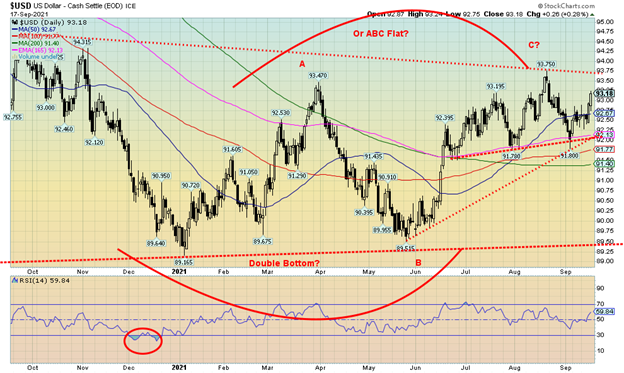
The US$ Index rally continues. Thanks to stronger than expected retail sales and a Philly Fed, the US$ Index gained 0.6% this past week and hit its highest level since the August high of 93.75. The US$ Index has been following what appears to us as zig-zag pattern up which suggests this move is corrective only. The US$ Index could still be forming a potential head and shoulders top with the head at 93.75 and the left shoulder at 93.20, just above current levels. While a slightly higher high above 93.20 is not a killer, we prefer the US$ Index to fail here. A run to 93.30 would keep things alive, but above 93.40 all bets start to be off. As to the other currencies, the euro fell 0.7%, the Swiss franc dropped 1.5%, the pound sterling was down 0.7%, while the Japanese yen held in, off only 0.1%. The Canadian dollar fell 0.7%, partially as a result of uncertainty surrounding the election to be held on Monday. The question there is, who will win, and will the NDP and even the Bloc continue to hold the balance of power? The election right now is too close to call except it appears to be another minority government. The US$ Index breaks down under 92.25 and a firm break under 92 could project down to 90.25. Sentiment is about 75% bulls, the highest level seen in the past year and even higher than it was at the recent high of 93.75.
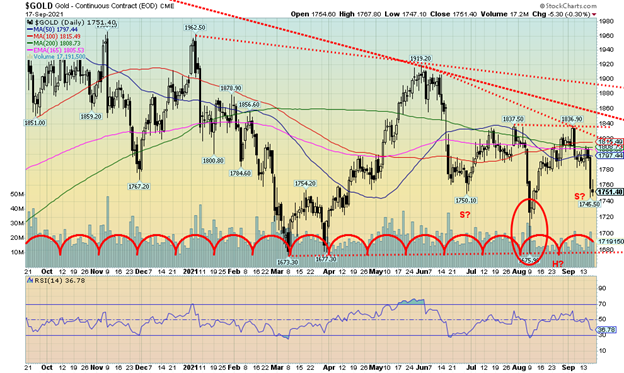
For a second week in a row gold fell, this time dropping over $40 mostly on Thursday and Friday as stronger than expected retail sales and the Philly Fed sparked thoughts once again of Fed tapering and the US$ Index soared. Poor consumer sentiment that came out later on Friday may help gold going forward. Gold will have its eyes on the FOMC meeting on September 22. It may help if the Fed remains somewhat dovish; i.e., no serious taper talk. Right now, it seems everyone is watching the Fed like hawks.
While the fall in gold was bad, it wasn’t as bad as silver that fell 6.5%. Palladium dropped 2.7% and platinum continued its woes, losing 6.7%. Copper joined the dump parade, off 4.6%. While the metals stocks took a hit, the gold stocks held in remarkably well with the Gold Bugs Index (HUI) off 2.3% and the TSX Gold Index (TGD) down 2.6%. A bit of optimism can be seen in the DSI Indicator from trade-futures.com that saw the sentiment indicator fall to 10%, barely above the 8% seen in March 2020 at the height of the pandemic crash. An 8% reading was also seen at the August low of $1,675. The other good news is that, while silver appears poised to make new lows, gold is well above the August low of $1,675, closing at $1,751 this week and a low of $1,746.50. While we would have preferred $1,750 to hold there are more important numbers below. A drop under $1,730 would be negative and a drop under $1,713 would suggest that new lows were possible. While there has been some damage to the possible head and shoulders bottom pattern, it is not a killer that the low this week was slightly under the left shoulder low of $1,750.10. If we break under $1,732, however, then all bets are off. So, the inverted head and shoulders is still alive, barely. The neckline is up around $1,840, to be safe, and a firm breakout does project up to $2,000. Grant you, that’s a projection and we must hold $1,732 and even preferably stay above this week’s low of $1,746.50. Lot of work to do first to regain $1,780/$1,800 and then take out $1,820/$1,835.
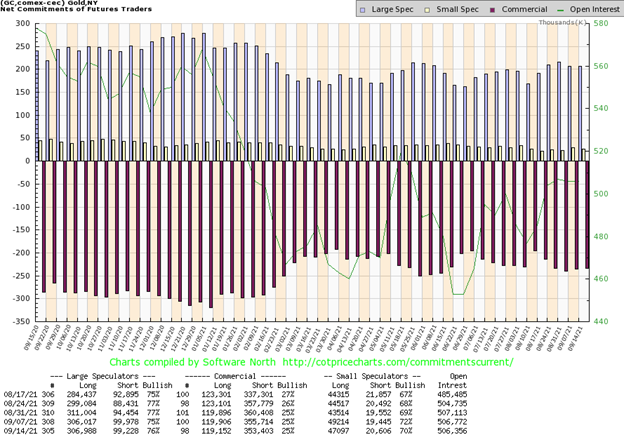
The gold commercial COT (bullion companies and banks) was unchanged this past week and unchanged for the third consecutive week at 25%. Short open interest did contract by just over 2,000 contracts while long open interest was down just over 700 contracts. The large speculators COT (hedge funds, managed futures, etc.) rose slightly to 76% from 75%. They added small to longs and subtracted small from shorts. Not a lot to read in this as the commercial COT remains somewhat bearish but above the lows seen earlier in the year. The numbers do not include the $40 plus plunge seen Thursday and Friday.
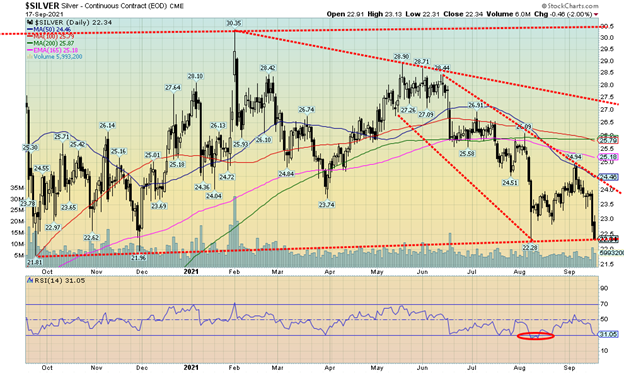
Silver was hammered this past week, down 6.5% on the week including a drop of 6.1% Thursday and Friday this past week. Silver is now not far from making fresh 52-week lows. The low of $22.31 was barely above the March low of $22.28. The lows seen last September and November at $21.81 and $21.96 are not that far away. We have considered $22 a bit of a line in the sand that we would not want to see fall. Intraday pokes under the level are okay as long as any probe down there is on low volume. Silver’s RSI has fallen to 31, not far from the bear levels of under 30. As well, while gold is down it is not confirming the drop in silver, a potential divergence. We note that the DSI indicator from trade-futures.com has fallen to 10% bulls, the lowest level seen since March 2020 when it hit 8%. The print in March 2020 signaled a bottom. While the DSI indicator can still fall further with probes under 10%, gold is looking a little better and if gold starts to rise silver will follow. We actually prefer silver to lead. As we saw this week silver led the decline even outpacing the miners. A favourite silver stock of ours, Gatos Silver (GATO), closed at $16.40, well above the $11.61 low of March 2021. Another potential divergence. However, we can’t say the same for Pan American Silver (PAAS), which has been making fresh 52-week lows over the past month. Silver has work to do to crawl out of this hole. A breakout doesn’t come until we clear over $24.50. Regaining $24 will be an accomplishment as it is necessary. But a more serious breakout doesn’t come until we are over $26. The recent high was just under $25. And, of course, what’s important is that we hold $22 (give or take a little).
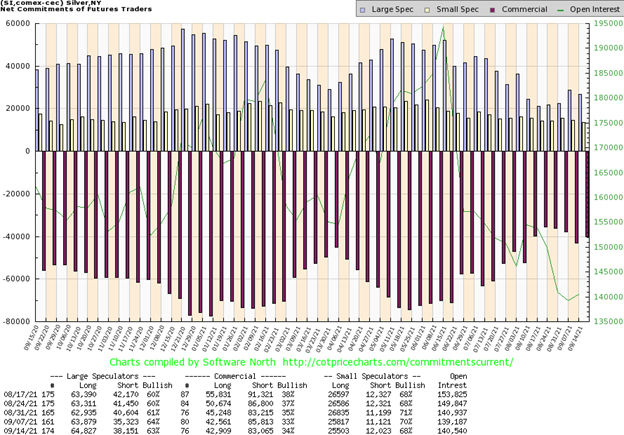
The commercial COT for silver improved this past week, rising to 34% from 33%. Short open interest fell around 2,800 contracts while long open interest rose about 500 contracts. That’s not overwhelming for sure, but it is a positive step. And these numbers are only until September 14 so it missed the big drop of September 16. A reduction in short open interest suggests short covering. The large speculators COT slipped to 63% from 64% as they added almost 3,000 short contracts. But they added some longs as well, up about 1,000 contracts. That’s an improvement but we’d like to see more with next week’s report.
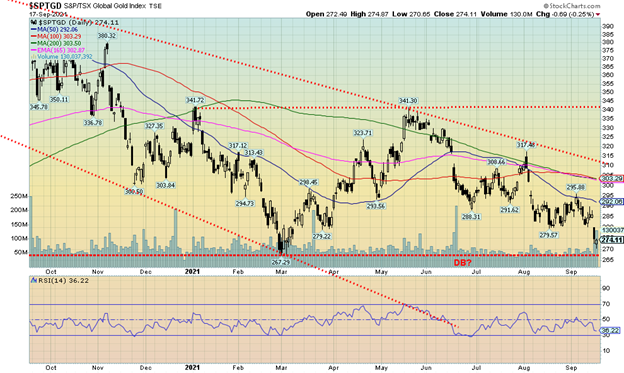
The pain continues for the gold miners. This past week the TSX Gold Index (TGD) fell another 2.6% while the Gold Bugs Index (HUI) dropped 2.3%. With a low of 270.65 it was just above the March low of 267.29. In what may be a bit of encouragement, the TGD left a hammer pattern on the charts Friday. A hammer pattern is Japanese candlestick pattern whereby the lower shadow is almost double the size of the real body and the real body is in the upper part and is relatively short. The TGD also left a gap on the charts between 280 and 284.50 and the temptation might be to try and fill that gap. The HUI, on the other hand, did make fresh 52-week lows this past week at 234.96 vs. a low of 247.99 in March. It too left a hammer on the charts. The hammer pattern frequently shows up following a steep decline. It can, though it’s not guaranteed, signal a potential low. Another encouraging sign was that the drop experienced by the gold miners was relatively mild compared to the drop seen for both gold (down 2.3%) and silver (down 6.5%). Usually, the losses for the miner are double that or more for gold. Regaining into the gap would be positive. Above 292 things begin to improve and over 295 we could rise to 300/305. A significant breakout would occur above 310. Ideally, the TGD does not make a new low, setting up a potential double bottom with the March low. The neckline would be up around 340. That’s a bit away from here. Lots of damage to repair in the interim. Not making new lows would be very helpful.
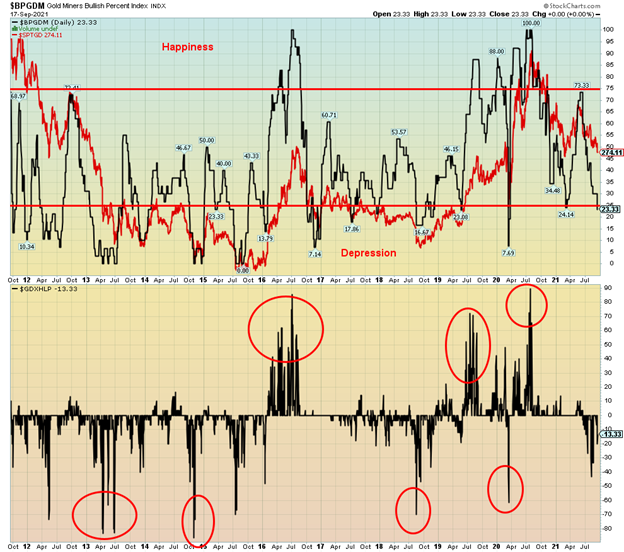
For the first time since the March 2021 low the Gold Miners Bullish Percent Index (BPGDM) has slipped under 25 (last at 23.33). As well, the Gold Miners New Highs-New Lows Percent Index is also at its lowest since August. Given it is currently somewhat higher it is a bit of a divergence with the earlier print. But it is not significant at this time. As low as the BPGDM has gone it could go a lot lower. The ultimate was in December 2015 when it hit zero. Since then, the lowest seen was the March 2020 pandemic crash when it fell to 7.69. The period 2012–2015 did see the BPGDM hit below 25 on numerous occasions. But gold and the gold miners were in a bear market at that time. Is the glass half full or half empty? The TGD is down 34% from its August 2020 high but up 58% from the March 2020 pandemic crash. The short and intermediate trend is pointed down but the long-term trend continues to cling to an uptrend. Nonetheless, the BPGDM is signaling that the sentiment towards the gold miners has turned bearish. However, it is not at what we call extreme bearishness.
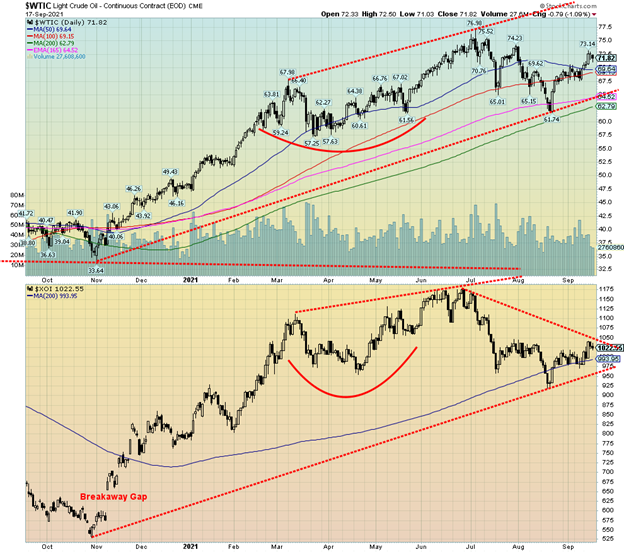
The upward beat continues for both oil and gas. Hurricane Ida has officially become the most disruptive hurricane ever in terms of production disruption. The expectation now is that these disruptions will continue through September. And that is not to say that another hurricane could come through and make things even worse. After all, Ida was followed by Nicholas although Nicholas did not cause the damage that Ida did. However, a good quarter of production in the Gulf remains offline. WTI oil prices rose 3.0% this past week, hitting a high of $72.61 before settling down. Natural gas (NG) continued its winning ways to the highest level in seven years and setting another 52-week high, closing at $5.11 after hitting a high of $5.46 earlier in the week. The energy stocks responded with the ARCA Oil & Gas Index (XOI) up 4.3% and the TSX Energy Index (TEN) gaining 4.3% as well.
WTI oil appears to have broken out; however, the energy stocks are lagging. That’s a potential divergence. NG is quite overbought at these levels but that comes with the territory when it is supply disruptions that are sparking the rise. Supply constraints and shortages are sparking the rise in energy prices. And that the major producers, particularly OPEC and Russia, are not turning the spigots back on. The U.S. has been drawing down reserves as well.
The XOI needs to break out over 1,050 to suggest that it might be about to climb higher. Otherwise, its lagging suggests that investors are becoming wary of the rally in oil and gas. In other words, investors are beginning to look at the end of the supply constraints and disruptions that could spark a sell-off in both oil and gas. But we are reminded that hurricane season isn’t over. We could get hit with another one that continues the disruptions.
WTI oil hit a high of $73.14 this past week before settling back to close at $71.82. However, a break over $73.50 could suggest that WTI oil is on its way back to the recent highs at $76.90 and even up to $80. There are many who are predicting oil will hit $100 before this over. A break back under $69 would suggest this rally is over.
—
(Featured image by Anna Nekrashevich via Pexels)
DISCLAIMER: This article was written by a third party contributor and does not reflect the opinion of Born2Invest, its management, staff or its associates. Please review our disclaimer for more information.
This article may include forward-looking statements. These forward-looking statements generally are identified by the words “believe,” “project,” “estimate,” “become,” “plan,” “will,” and similar expressions. These forward-looking statements involve known and unknown risks as well as uncertainties, including those discussed in the following cautionary statements and elsewhere in this article and on this site. Although the Company may believe that its expectations are based on reasonable assumptions, the actual results that the Company may achieve may differ materially from any forward-looking statements, which reflect the opinions of the management of the Company only as of the date hereof. Additionally, please make sure to read these important disclosures.
David Chapman is not a registered advisory service and is not an exempt market dealer (EMD) nor a licensed financial advisor. We do not and cannot give individualised market advice. David Chapman has worked in the financial industry for over 40 years including large financial corporations, banks, and investment dealers. The information in this newsletter is intended only for informational and educational purposes. It should not be considered a solicitation of an offer or sale of any security. Every effort is made to provide accurate and complete information. However, we cannot guarantee that there will be no errors. We make no claims, promises or guarantees about the accuracy, completeness, or adequacy of the contents of this commentary and expressly disclaim liability for errors and omissions in the contents of this commentary. David Chapman will always use his best efforts to ensure the accuracy and timeliness of all information. The reader assumes all risk when trading in securities and David Chapman advises consulting a licensed professional financial advisor before proceeding with any trade or idea presented in this newsletter. David Chapman may own shares in companies mentioned in this newsletter. We share our ideas and opinions for informational and educational purposes only and expect the reader to perform due diligence before considering a position in any security. That includes consulting with your own licensed professional financial advisor.


MSD Gets Green Light from the European Commission for Keytruda, the World’s best-Selling Drug
MSD closed 2023 with a turnover of 55.5 billion euros, 1% more than in 2022, when it obtained sales of...


Konvex Created the First Universal API that Integrates Different ERPs in Latin America
The Konvex API offers numerous benefits so that companies and startups can take advantage of their time and effort in...


The French Real Estate Crowdfunding is Going through First Crisis
Crowdfunding platforms face an influx of repayment extension requests, delaying project completion. Investors like Guillaume report delays in seven out...


Cannabis in Canada: Trends, Statistics and Social Impact
In Canada, innovative methods such as wastewater analysis are being used to monitor cannabis consumption levels. This approach allows for...


PharmaMar Increases Profit by 64% in the First Quarter, Up To 2.3 Million
PharmaMar's profits rebound with a 64% increase to 2.3 million euros in Q1 2024 compared to the same period last...
 |
|
 |  |
 |
|
-

 Cannabis2 weeks ago
The Legal Cannabis Industry in the U.S. Provides Over 440,000 Full-Time Jobs
-
 Business3 days ago
Bananas Grow in Washington: Powell and FOMC Pinning for Rate Cuts
-

 Cannabis1 week ago
Cannabis Legalization Reduces the Likelihood of Youth Using It
-

 Cannabis1 day ago
Cannabis Reform in Belgium: What Changes Does the Latest Report Propose