Business
Cloudy Market Predictions Show the Worst Is Yet to Come
Markets are still sinking and volatility is everywhere but we do see signs that a temporary low may be at hand. The U.S. dollar is still soaring and that is causing all sorts of dislocations. Interest rates are still rising and are poised to go even higher. Gold and silver are still struggling but continue to show off positive signs. Oil took a hit with worries over a recession despite the recent production cuts by OPEC.

Since when has the IMF suddenly become a Cassandra (one who predicts misfortune or disaster)? The IMF as Dr. Gloom and Dr. Doom? Currently, Dr. Gloom is Marc Faber, author of Gloom, Boom and Doom and Dr. Doom is Nouriel Roubini, Professor Emeritus, Stern School of Business, New York University. However, the original Dr. Gloom was Henry Kaufman, Chief Economist, Salomon Brothers, and Dr. Doom was Albert Wojnilower, Chief Economist, First Boston, during the 1970s. It’s not easy being a Cassandra. Oh yes, we know where the current Dr. Doom and Gloom stand on the economic outlook. They make the IMF look like pussycats.
We don’t intend on being a Cassandra either, but then there are many who saw the “worst is yet to come” was coming, long before the IMF voiced it. And it’s not as if the IMF is the only large institution calling for a recession of varying degrees. We have also heard from the heads of RBC, Citigroup, JP Morgan, Bank of America, and more. The most recent headline for The Economist is “What’s Next? A special report on the world economy.”
Maybe the doom and gloom are becoming over-extended. In other words, the contrarian might now be saying maybe they are wrong. Unless they aren’t. Many of the same people who predicted or at least anticipated the 2008 financial crisis are amongst those now predicting that the coming period will be the worst we’ve ever experienced. Maybe it’s a generational thing. We have noted the possible 90-year cycle in previous write-ups. The last one was the Great Depression. Another time. Another generation.
But we have also noted the 72-year cycle that last bottomed in 2009 as a part of the financial crisis of 2007–2009. Again, that was measured from the bottom of the Great Depression (1932 + 72 = 2004) with a range of 73–77 years, so the combination pack of significant lows in 2002 and 2009 fit the range. If that’s correct, then we are embarking on a new up cycle. The 72-year cycle is made up of four 18-year cycles. The first 18-year cycle is approaching, estimated to be 2024–2030, but it could have a slightly broader range of 2022–2030. Measured from 1932, there were important stock market lows seen in 1949 (17 years), 1966 (17 years), 1987 (21 years), 2002 (15 years), and 2009 (22 years). The half cycle of 72 years is 36 years, so the lows in 1970 (38 years) or 1974 (42 years) are within range. The next 36-year cycle low is not due until 2039–2051.
So, it is possible that this is a correction, albeit a potentially steep one, to the huge run-up seen from 2009 to 2022. That run-up was fuelled by ultra-low interest rates, massive amounts of quantitative easing (QE), and debt. Now comes the hangover—so far, at least, in the stock and bond markets. The Dow Jones Industrials (DJI) is down 18.5% currently in 2022, although it has fallen below 20%, the definition of a bear market. Bonds, as measured by the U.S. 10-year treasury note, have fallen 20% from their high in 2020 and are down 14% thus far in 2022 (in price, prices move inversely to yield).
Our chart below of 100 years of the DJI shows the long-term trend that has been ever-rising. We marked it with Elliott Wave analyst Ron Rosen’s version of Elliott Waves, noting that the high of January 2022 could be the top of Cycle Wave V, but it also might be marking only the top of Primary Wave 1, up from the 2009 Cycle Wave IV low. The rising trendlines have support first near 17,000 and second near 8,000. They could be ultimate targets.
100 Years – Dow Jones Industrials (DJI) 1922–2022
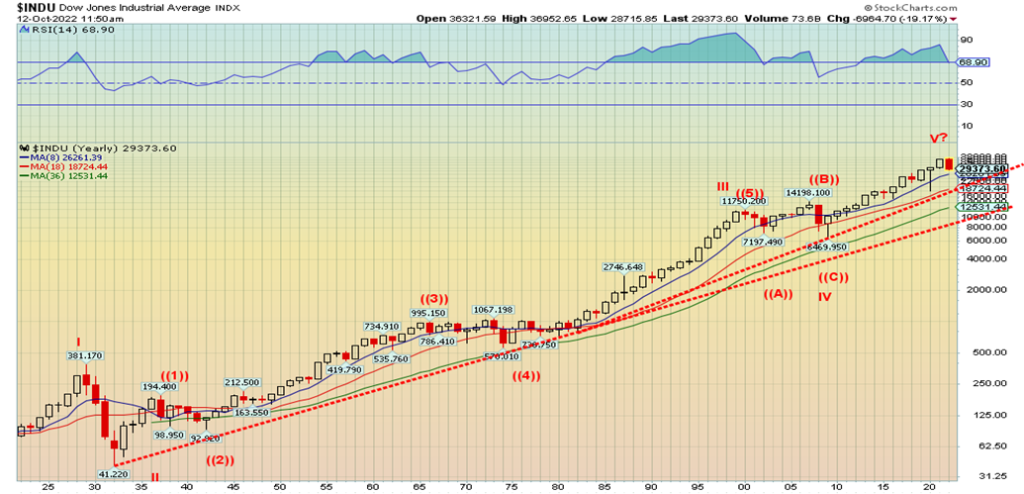
Note how overbought the DJI was, as measured by the RSI throughout most the years. Even in pullbacks, the RSI rarely went under 50. Nonetheless, this is the worst year since 2008. The DJI fell 33.8% in 2008. Since 1929 there have been 16 bear market years that have stood out. All told, there have been 29 down years vs. 71 up years since 1922. This is a statement that, in the long run, the market goes up. The bear years of note were 1929–1932, 1937, 1940–1941, 1966, 1969, 1973–1974, 1977, 1981, 2000–2002, and 2008. But those bear years can be costly as it often takes a number of years to break even again. It took the DJI until 1954 or 25 years before it regained the 1929 high. On an inflation-adjusted basis it was even worse, taking until 1959 or 30 years. It was 29 years before the 1966 DJI high was regained on an inflation adjusted-basis in 1995. It is noteworthy that the Tokyo Nikkei Dow (TKN) has never recovered its 1990 high some 32 years later. For many, that’s a lifetime.
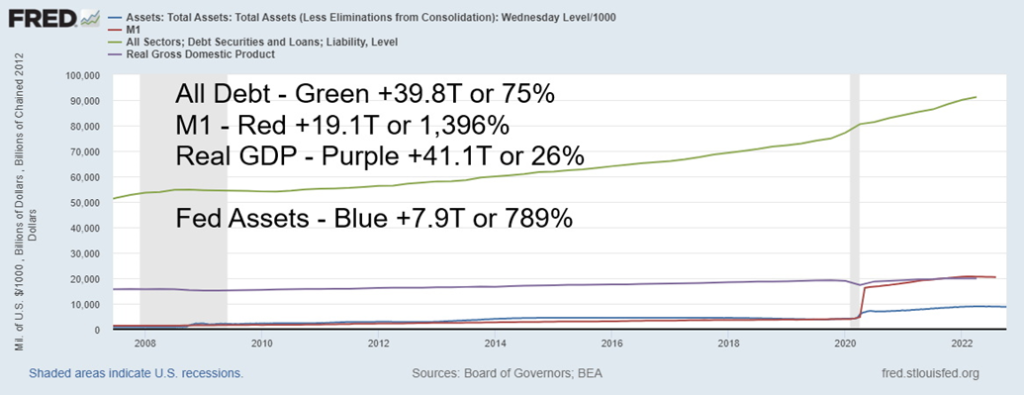
Massive Growth in Money and Debt but not in Real GDP 2007–2022
Rise Since Q4 2007
Different periods require different strategies. But what kind of strategy? Here we are using two possible ways of looking at things that might give a clue as to where investors should focus. One is through the Dow Gold Ratio and the other is through the Kondratiev Wave Cycle theory. One is market calculable (Dow Gold) while the other is a little-known theory that most economists do not buy into. However, it does appear to have relevance.
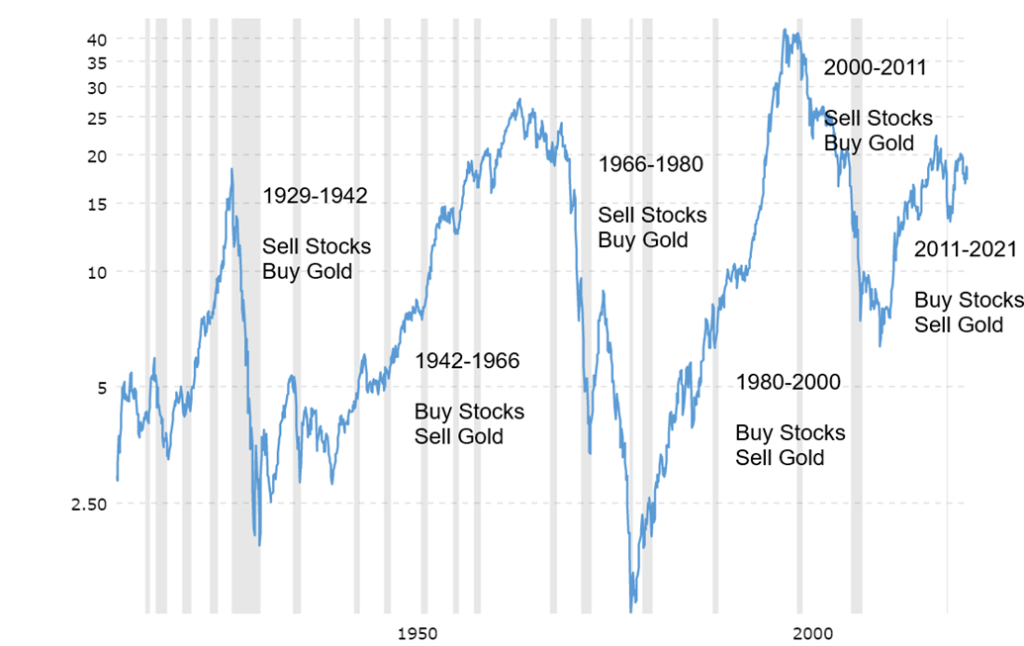
First, the Dow Gold Ratio. This is simply the ratio of the Dow Jones Industrials (DJI) to Gold. When the ratio is rising as it did from 1942 to 1966 and again from 1980 to 2000, one wants to own stocks. However, from 1929 to 1942 and again from 1966 to 1980, one would be better off in gold. The recent period since 2000 has been somewhat more complex. From 2000 to 2011, the Dow Gold Ratio was falling in favour of owning gold over stocks. From 2000 to 2011, gold rose 440% while the DJI was up a paltry 6.3%. However, for the period from 2011 to 2021, the DJI was up 197% while gold rose a mere 16.9%. No, we don’t have a clear buy gold signal from the Dow Gold Ratio, but we note the recent high for the ratio was a lower high. That’s often a sign that we may have topped. Once the ratio breaks under 13.50, we would have a clear buy signal to hold gold over stocks.
Currently, the ratio is 17.10 and falling. Once the ratio breaks under 13.50, targets could be down to at least 10.50. That would imply gold could then be trading around $2,700, all other things being equal. The Dow Gold Ratio is followed by numerous analysts. It has a long history. As well, there can be sharp corrective periods against the major trend. Since Elliott waves fall in threes (A, B, C), it is possible that the move from 2000 to 2011 was the A wave down and the from 2011 to 2021 has been the B wave up. The C wave to the downside is to come.
Dow Gold Ratio – 1922–2022
Kondratiev Wave Theory is more complex, with many questioning its usefulness and validity. However, we find it interesting and there may be some ongoing relevance to the theory. For those not familiar as to who Nicolas Kondratiev was, we summarize:
- Other economists did similar work that traced similar cycles back to the Romans and even the Mayans, all supporting Kondratiev’s work. Kondratiev was rewarded for his efforts by being sent to Siberia by Stalin. Stalin didn’t like the fact that his theories also applied to Russia and that the capitalist economies would rise again from their depressions. Kondratiev died in a Siberian labour camp.
Kondratiev concluded that each long wave was driven by technological advances. He identified four distinct phases. Over a period of 60 years, each period could in theory be 15 years, but the range has been 5 to 20 years.
- spring—beneficial inflationary growth, stocks rising, interest rates low, commodities and gold weak
- summer—inflation, stagflation, recession, stock market weak, interest rates rising, commodities and gold booming
- autumn—deflationary growth, stocks booming (bubble?), interest rates falling, commodities and gold weak
- winter—deflation, depression, financial crisis, stock market weak, interest rates low, commodities and gold booming
The next chart is based on generally accepted consensus as to the beginning and end of each wave. We have seen no updates elsewhere. Our conclusions on the most recent Kondratiev wave phase are open to interpretation. We have concluded that the most recent Kondratiev winter ended with the stock market low in 2009. The period 2000–2009 was characterized by low inflation, a financial crisis, two significant recessions (high-tech, dot.com recession 2000–2002 and the financial crisis, also known as the Great Recession in 2007–2009), with gold and commodities generally booming. Gold advanced from $353 in 2001 to a peak of $1,923 in 2011. The broader commodities market, including oil, topped in 2008. The CRB Commodity Index topped in 2008. Stock markets were weak with the S&P 500 down 45% while gold was up 219%. The CRB Index returned only about 8% during that period following a sharp drop after its 2008 top. Nonetheless, what’s key was that the characteristics of the Kondratiev winter prevailed.
Our interpretation then was that the period 2009 to the stock market high in early 2022 was the start of a new long Kondratiev wave. If we are correct, the first phase, the Kondratiev spring, topped with the markets in early 2022. The period was characterized by low inflation, low-interest rates, a rising stock market, and weak commodities and gold. The S&P 500 returned 587% while gold was up only about 94% and the CRB Index gained about 13%. The CRB Index spent much of the period with a negative return.
If our assumptions are correct, we could be entering the Kondratiev summer. The last one was the period 1966–1982 which was characterized by high inflation, soaring commodity prices (gold went from $35 to $873), rising interest rates, and, a sharply underperforming stock market. Gold gained roughly 1,100% during the period while the S&P 500 underperformed, gaining roughly 50%. The CRB Index was up 120%. The period was characterized by sharply rising oil prices that contributed to inflation. Inflation in the U.S. topped out around 14% and ended only when the Fed hiked interest rates to unheard-of levels above the rate of inflation. Oil prices were impacted by the Arab oil embargo in 1973 and the Iranian revolution in 1979.
If we truly have entered the Kondratiev summer, it will be characterized by rising inflation, stagflation, a weak stock market, and weak economic growth. All are present already. Commodities, led by gold, will outperform the stock and bond markets. Note that each Kondratiev wave phase is dominated as well by war. It appears to be a staple no matter what phase we are in.
Both the Dow Gold Ratio and Kondratiev Wave theory appear to be pointing towards a difficult period for the economy and the stock market, accompanied by high inflation/stagflation and the potential for gold and commodities to boom. As for the stock market and the economy, the IMF may be right. The worst is yet to come.
Kondratiev Wave Cycles—The Long Wave
| Spring (expansion) Beneficial inflation, economic growth, stocks up, commodities weak | Summer (recession) Inflation, stagflation, weak economic growth, recession, stocks weak, commodities up | Autumn (plateau) Mild deflationary growth, stocks up, possible bubble, commodities weak | Winter (depression) Deflationary growth and steep recessions/depression, stocks weak, commodities up | Length of the Long Wave/Technological Drivers of the Long Wave |
| 1784–1800 American Revolution, Indian Wars, French Revolution | 1800–1816 War of 1812, Indian Wars, Napoleonic Wars, inflation, stagflation | 1816–1835 “Era of Good Feelings,” Indian Wars, booming stock market | 1835–1844 Indian Wars, slave rebellions, the Hungry Forties, depression, financial crisis of 1837 | 60 years/steam engine, cotton, Industrial Revolution, age of steam and railways |
| 1845–1858 Mexican American War, Indian Wars | 1859–1864 U.S. Civil War, inflation, stagflation | 1864–1874 reconstruction, Indian Wars, booming stock market | 1875–1896 Indian Wars, the Long Depression, The Gilded Age | 51 years/railways, steel, age of steel |
| 1896–1907 Spanish-American War, Philippine- American War, Boxer rebellion, collapse Ming Dynasty | 1907–1920 WW1, Mexican Revolution, Banana Wars, China Civil Wars, Russian revolt, inflation, stagflation, Spanish flu pandemic | 1921–1929 The Roaring Twenties, booming stock market, Irish war independence, Iraq Syria revolts, Russia civil war, Turkish war independence | 1929–1949 Stock Market crash, Great Depression, WW2, China Civil War, Spanish Civil War | 53 Years/electrical engineering, chemistry, age of oil, automobiles, and mass production |
| 1949–1966 Korean War, Indochina War, Cold War, post-war expansion | 1966–1982 Vietnam War, Indochina Wars, Cold War, Arab Oil Crisis, inflation, stagflation, Iranian revolution | 1982–2000 “The New Economy,” Gulf War1, Balkan Wars, Collapse USSR, stock market boom and bubble, October 1987 crash | 2000–2009 dot.dom bubble bust, global financial crisis, Great Recession, War on Terror – Afghanistan, Iraq, Syria, Libya | 60 years/ petrochemicals, automobiles, age of information technology, telecommunications |
| Spring (expansion) Beneficial inflation, economic growth, stocks up, commodities weak | Summer (recession) Inflation, stagflation, weak economic growth, recession, stocks weak, commodities up | Autumn (plateau) Mild deflationary growth, stocks up, possible bubble, commodities weak | Winter (depression) Deflationary growth and steep recessions/depression, stocks weak, commodities up | Length of the Long Wave/Technological Drivers of the Long Wave |
| 2009–2022 War on Terror, Afghanistan, Iraq, Syria, Libya, Stock market bubble, COVID pandemic | 2022–? Russia/Ukraine war, US/Russia/China? WW3? inflation, stagflation? Oil crisis, weak economy? | ??/age of post-informational technology, artificial intelligence (AI), renewable energy?? |
Source: David Chapman, format abridged from www.munKNEE.com
Chart of the Week
Gold, Silver, HUI 1998–2002
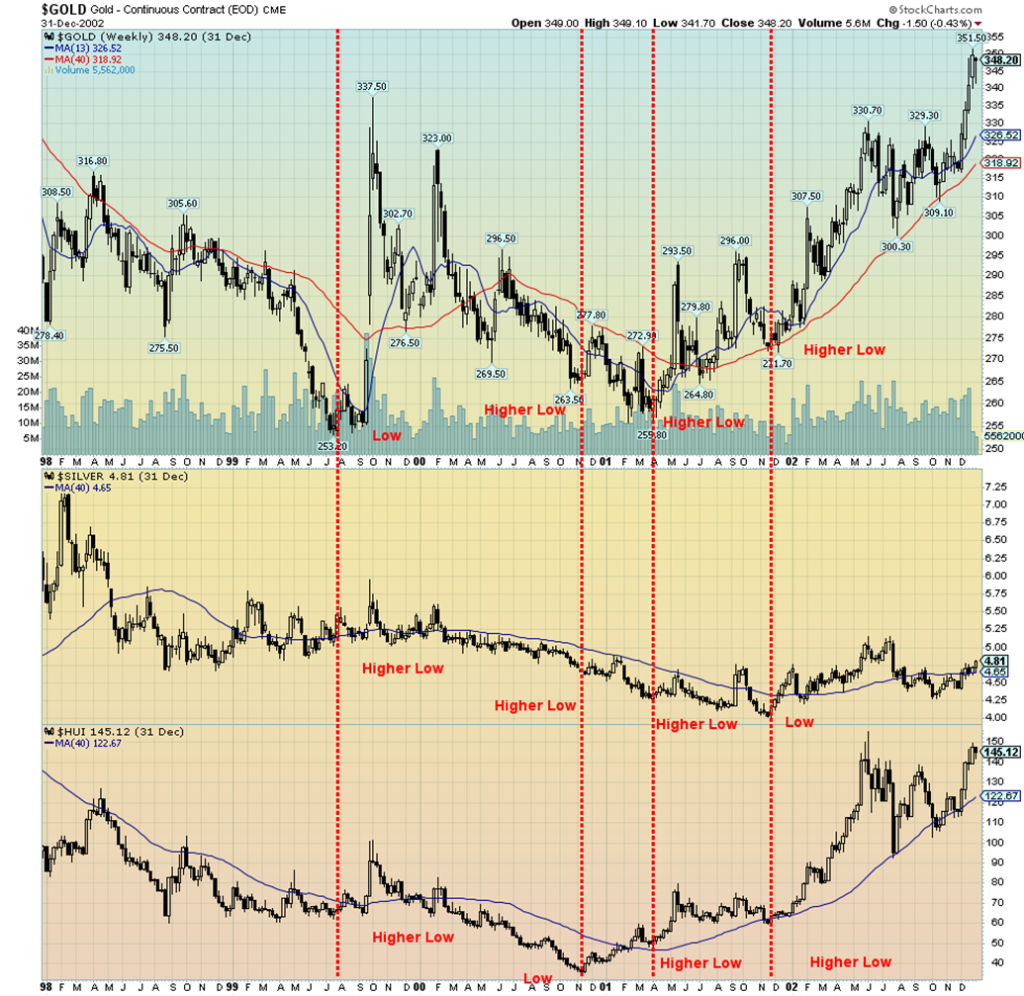
The gold market of the late 1990s and early 2000s is interesting for a number of reasons. The period saw a series of important lows for gold, silver, and the gold stocks as represented here by the Gold Bugs Index (HUI).
Each was taking turns making their low, even as the others made higher lows, a divergence. As it turned out, it was signal that the gold market was likely bottoming. That proved to be the case as from 2000 to the top in August 2011 gold gained over 450%, silver was up as well, roughly the same although that was down from the 1,500% increase seen at its peak in April 2011, and the HUI gained over 600%. During the same time frame the S&P 500 was down over 20%. It was a golden period for the gold bugs.
The wise ones were quietly accumulating gold, silver, and gold stocks in the late 1990s and early 2000s in preparation for what eventually took place. They shunned the sharply rising stock market (NASDAQ), led by the high-tech/dot.com stocks that were clearly in a bubble.
Gold made its ultimate low in July 1999. But at the time both silver and the HUI were above previous lows—a divergence. The HUI finally made its ultimate bottom in November 2000 and, no surprise, both gold and silver were making higher lows. Silver finally made its low in November 2001. Once again gold and the HUI were making higher lows. Interestingly, when gold made its secondary low (a double bottom low?) in April 2001, silver and the HUI were making higher lows.
There has been a constant argument as to which one of gold’s two lows should be considered the 23.5-year cycle low we have noted in the past. Ideally, it should be the July 1999 low as it was the low print. It was also almost a perfect 23 years from the August 1976 low. If 1999 is the correct one for the 23.5-year cycle low, then the next 23.5-year cycle low could occur in 2022–2024. We are right in that period now. And more recently gold, silver, and the HUI have been taking turns making lows that were not confirmed by the other two. The most recent is gold making a low at $1,622 on September 28, 2022. Both the HUI and silver made higher lows at the time. The same date also saw an outside possible key reversal day. That has not to date been broken, despite the recent pullback for gold prices.
We remain hopeful that an important low may have been seen, but we can’t deny that it is nowhere near being confirmed and we could yet see another move lower where all three make new lows confirming each other. The 23.5-year cycle low will only be confirmed once gold makes new highs above $2,100. Until then, at least in the near term, the risk for gold, silver, and the gold stocks remains to the downside.
Special Chart #1 – CPI
Inflation vs. Fed Funds Rate 1969–2022
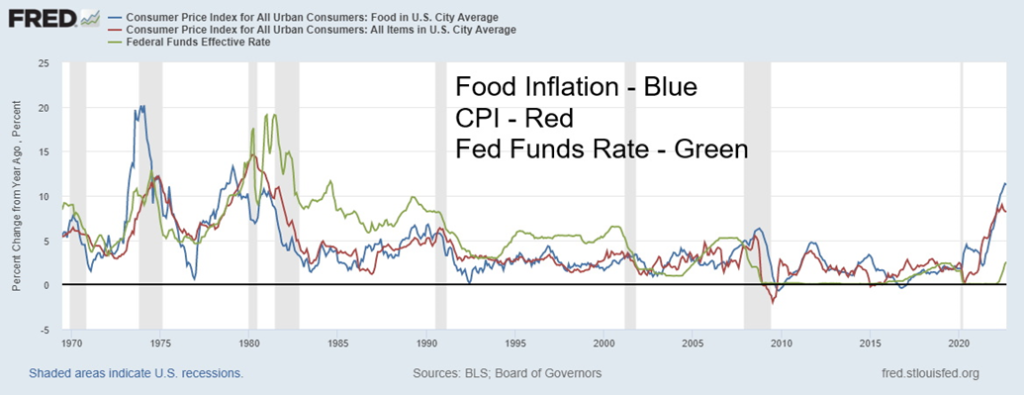
Inflation continues to rear its ugly head. This is the highest level of inflation in the U.S. since the 1970s. Food inflation has caught the attention of people. It is running at a rate of 11.4% annually as of September 2022. The CPI Index was up 8.2%, which has actually moderated since peaking in June at 9.0%. The peak in the 1970s came in at 14.4% in May 1980 while food inflation peaked at 13.3% in February 1979. In response to the high rate of inflation, the Fed under Paul Volcker hiked the Fed Funds rate to 19% in January 1981. That worked and inflation was eventually wrestled downward as the steepest recession since Great Depression got underway. By December 1986 the inflation rate was down to a paltry 1.2%. Collapsing oil prices also helped.
But today Fed Funds sit at 3–3.25%, a negative differential to the CPI rate of 4.95%. If Fed Chair Jerome Powell is to pull a Volcker, he’ll have to raise the Fed rate to 9%. That has some now speculating that the Fed will hike 75 bp at its November 1–2 FOMC meeting, plus at least another 50 bp in December. Grant you, he’d then be risking a possible soft landing turning into a harder landing. Note today we saw a jump in the weekly claims. That rise is partially as a result of Hurricane Ian. Expect weekly claims to rise going forward.
We note that, even during the 1970s inflation, it first topped out in 1974 before falling to a low in 1976. Then it surged again, peaking in 1980 as oil prices surged once again. The stock market fell sharply in 1973–1974 but the prime reasons behind that were the Arab Oil Embargo and the Watergate crisis. A sharp rally occurred in 1975–1976 before topping once again. It’d be no surprise to see the stock market rally sharply if the CPI were moderate in the coming months.
If one looks closely at the CPI numbers that came out, we note that the month-over-month rate was only 0.4%. Annually that translates into 4.8%. Better still, the combined inflation rates of July, August, and September work out to an annual inflation rate of 2%. That’s all well below the year-over-year rate of 8.2% and the high seen in June. Inflation, we suspect, could be moderating.
Special Chart #2 – U.K. Gilts
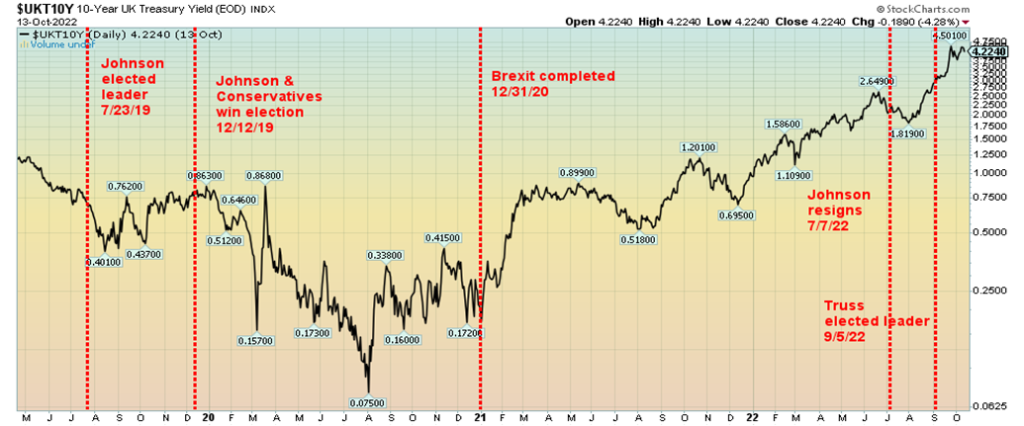
Log scale charts, while correct, really do not do justice to sharply rising or falling markets. Below is the linear chart of the same period. Does that look better? The rise is more dramatic on a linear chart.
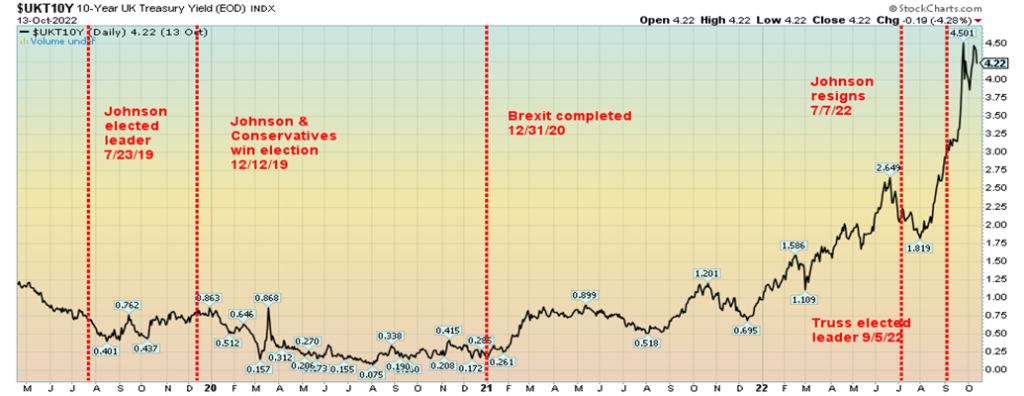
Log charts vs. linear charts: there’s a constant argument in the technical analysis community as to which is better. The log chart has fixed distances between percentage moves while a linear chart has a fixed distance between prices. The move from that low in August 2022 at 1.819% to the high in October 2022 at 4.50% was a big 2.68% move in price, but a move of 147% on a percentage basis. U.K. gilts, no matter how you look at them, made a big dramatic move.
On September 23, 2022, the incoming government of the newly elected leader of the U.K. Conservative party, Liz Truss, decided to embark on a huge borrowing spree to fund big tax cuts that most agreed benefitted primarily the well-off. The tax cuts were estimated to cost £43 billion. On top of that, the Truss government was promising an even bigger unfunded package to help people keep down soaring energy bills as a result of the war between Russia/Ukraine and the cut-off of energy supplies. All this occurred against the backdrop of the Bank of England (BOE) trying to wrestle down an inflation rate of 9.9% (the highest in the G7) by hiking interest rates. At the same time as the U.K. gilt market was collapsing, the pound sterling went into a nosedive, falling at one point close to par with the U.S. dollar. The pound has fallen over 20% from a high in June 2022.
As a result of the chaos created in the U.K. gilt market and currency, the BOE was forced to intervene in markets to prevent a meltdown. Not only was there chaos in the gilt and currency markets, but also with U.K. pension funds holders of huge amounts of U.K. gilts used to pay pensioners. Seems the pension funds, in their desire to protect their gilt positions, had put on hedges called Liability Driven Investments (LDIs), a derivative tool designed to mitigate the negative effects of low-interest rates. Oops. As the gilt market plummeted, the pension funds were forced to come up with more collateral (cash) to cover what became huge losses on their LDIs. The solution was to sell gilts, but that only made things worse. Pension funds were threatened with collapse. Oh yes, the LDI market was huge. Some £1.6 trillion in size vs. the £2.3 trillion gilt market. Pension funds used LDIs to combat the ultra-low interest rates that prevailed following the 2008 financial crisis as a result of QE and central banks’ lower rates to zero or even below. They had pension obligations after all.
This reminded us of the chaos in September/October 2008 as the global financial system threatened to collapse as a result of the crisis in the subprime mortgage market, which resulted in the collapse of Lehman Brothers. And as well as American International Group (AIG), one of the world’s biggest insurance companies. Seems that AIG wrote huge amounts of credit default swaps (CDSs) and when CDS spreads exploded as a result of the financial collapse AIG was asked to pay up. Except they couldn’t without causing the collapse of AIG and others.
The BOE, to be polite, is caught between a rock and hard place. On one hand, they are trying slow the economy by raising interest rates to combat inflation, but now at the same time, they are trying to quell a growing financial crisis by buying bonds, and adding liquidity to prevent a financial meltdown (QE in another name). Don’t even think about quantitative tightening (QT); i.e., selling bonds to lighten the load on their balance sheet. In addition to a major risk to the U.K. financial system, homeowners and others are facing a collapse due to higher interest rates and soaring energy prices.
The Truss government has kind of backed off on their tax cuts and the Chancellor of the Exchequer Kwasi Kwarteng has resigned (fired?) after only 38 days on the job. But the crisis remains despite the pause. Is the worst yet to come?
Markets & Trends
| % Gains (Losses) Trends | ||||||||
| Close Dec 31/21 | Close Oct 14/22 | Week | YTD | Daily (Short Term) | Weekly (Intermediate) | Monthly (Long Term) | ||
| Stock Market Indices | ||||||||
| `S&P 500 | 4,766.18 | 3,583.07 (new lows) | (1.6)% | (24.8)% | down | down | neutral | |
| Dow Jones Industrials | 36,333.30 | 29,634.83 (new lows) | 1.1% | (18.5)% | down | down | neutral | |
| Dow Jones Transport | 16,478.26 | 12,503.38 | 0.2% | (24.1)% | down | down | neutral | |
| NASDAQ | 15,644.97 | 10,321.39 (new lows) | (3.1)% | (34.0)% | down | down | down (weak) | |
| S&P/TSX Composite | 21,222.84 | 18,326.35 (new lows) | (1.4)% | (13.7)% | down | down | neutral | |
| S&P/TSX Venture (CDNX) | 939.18 | 581.09 | (4.4)% | (38.1)% | down | down | down | |
| S&P 600 | 1,401.71 | 1,091.05 | (0.3)% | (22.2)% | down | down | neutral | |
| MSCI World Index | 2,354.17 | 1,688.86 (new lows) | (3.8)% | (28.3)% | down | down | down | |
| Bitcoin | 47,907.71 | 19,457.61 (new lows) | (1.0)% | (59.4)% | down | down | down | |
| Gold Mining Stock Indices | ||||||||
| Gold Bugs Index (HUI) | 258.87 | 183.57 | (7.2)% | (29.1)% | down | down | down | |
| TSX Gold Index (TGD) | 292.16 | 229.59 | (5.7)% | (21.4)% | down | down | down | |
| % | ||||||||
| U.S. 10-Year Treasury Bond yield | 1.52% | 4.02% (new highs) | 3.3% | 164.5% | ||||
| Cdn. 10-Year Bond CGB yield | 1.43% | 3.49% | 3.0% | 144.1% | ||||
| Recession Watch Spreads | ||||||||
| U.S. 2-year 10-year Treasury spread | 0.79% | (0.48)% (new lows) | (14.3)% | (160.8)% | ||||
| Cdn 2-year 10-year CGB spread | 0.48% | (0.69)% (new lows) | (4.6)% | (243.8)% | ||||
| Currencies | ||||||||
| US$ Index | 95.59 | 113.20 | 0.5% | 18.4% | up | up | up | |
| Canadian $ | .7905 | 0.7200 (new lows) | (1.2)% | (8.9)% | down | down | down | |
| Euro | 113.74 | 97.28 | (0.1)% | (14.5)% | down | down | down | |
| Swiss Franc | 109.77 | 99.50 (new lows) | (1.0)% | (9.4)% | down | down | down | |
| British Pound | 135.45 | 111.74 | 0.7% | (17.5)% | down | down | down | |
| Japanese Yen | 86.85 | 67.28 (new lows) | (2.2)% | (22.5)% | down | down | down | |
| Precious Metals | ||||||||
| Gold | 1,828.60 | 1,648.90 | (3.5)% | (9.8)% | down | down | down (weak) | |
| Silver | 23.35 | 18.07 | (10.8)% | (22.6)% | down | down | down | |
| Platinum | 966.20 | 894.90 | (2.5)% | (7.4)% | up | down | down (weak) | |
| Base Metals | ||||||||
| Palladium | 1,912.10 | 1,997.30 | (8.9)% | 4.5% | down | down (weak) | neutral | |
| Copper | 4.46 | 3.42 | 0.8% | (23.4)% | down | down | neutral | |
| Energy | ||||||||
| WTI Oil | 75.21 | 85.61 | (7.6)% | 13.8% | neutral | down | up | |
| Nat Gas | 3.73 | 6.45 | (4.4)% | 72.9% | down | neutral | up | |
New highs/lows refer to new 52-week highs/lows and, in some cases, all-time highs.
Don’t you just love the volatility. A sea of red ink. Gyrating markets up and down. And more 52-week lows. On Thursday, markets put in an outside reversal day after making fresh 52-week lows. And that was after the inflation numbers had sent the markets tumbling to new lows. Then suddenly they reversed with a ferocity. The Dow Jones Industrials (DJI) had a 1000-point-plus round-trip day. Alas, it was all to no avail as markets fell on the week for the fourth time in the last five weeks. Markets are down in October so far, albeit a small 0.1% for the S&P 500, and are down on the year as well. On the week, the S&P 500 lost 1.6%, the DJI was one of the few that managed to hold on to its Thursday reversal, up 1.2%, the Dow Jones Transportations (DJT) also managed to eke out a small gain, up 0.2%, but the NASDAQ was down 3.1%. The small cap S&P 600 was off a small 0.3% while the S&P 400 mid-cap lost 1.0%. In Canada, the TSX Composite was down 1.4% to fresh 52-week lows but the TSX Venture Exchange (CDNX) eluded new 52-week lows but was down 4.4%.
In the EU, the London FTSE fell 1.9% to 52-week lows, the Paris CAC 40 gained 1.1%, while the German DAX was up 1.3%. Neither made 52-week lows. In Asia, China’s Shanghai Index (SSEC) gained 1.6% but Japan’s Tokyo Nikkei Dow (TKN) was off about 0.1%. The MSCI World Index fell 3.8% to 52-week lows.
There is not a host of numbers to trade off this coming week. Some manufacturing indices are out—the NY Empire State Index and the Philly Fed. Industrial production is out on Tuesday and they are looking for a gain of 3.4%. That would keep the pressure on hiking interest rates. Housing starts are out on Thursday and they are looking for a drop of over 100,000 units.
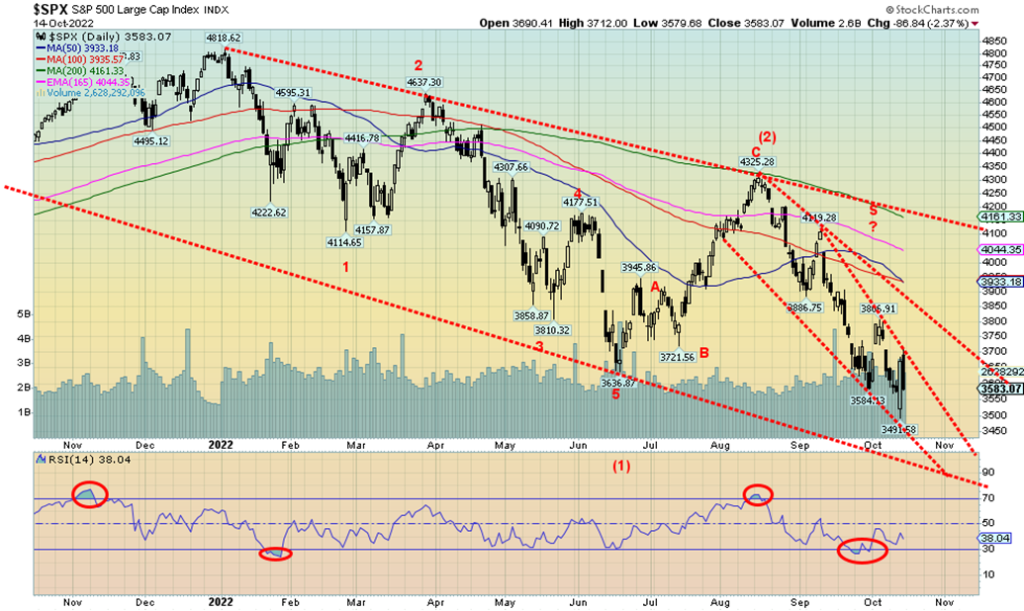
The good news is that the S&P 500 appears to have fallen to the bottom of a bear channel. The outside reversal day on Thursday will prove positive only if we start rising again this coming week. A break above 3,700 would be positive. A break above 3,800 would be even better, which could start a run to the major downtrend line near 4,100. There are some divergences in the indicators, but these divergences can run longer than many might expect. The major trend is down—we are down on the daily and weekly and close to a down on the long-term trend. But we remain hopeful for a meaningful rally as October can be a bear killer. It’s not as if we are expecting a major end to this bear market. We see little or no sign of that. But a relief rally allows for restructuring.
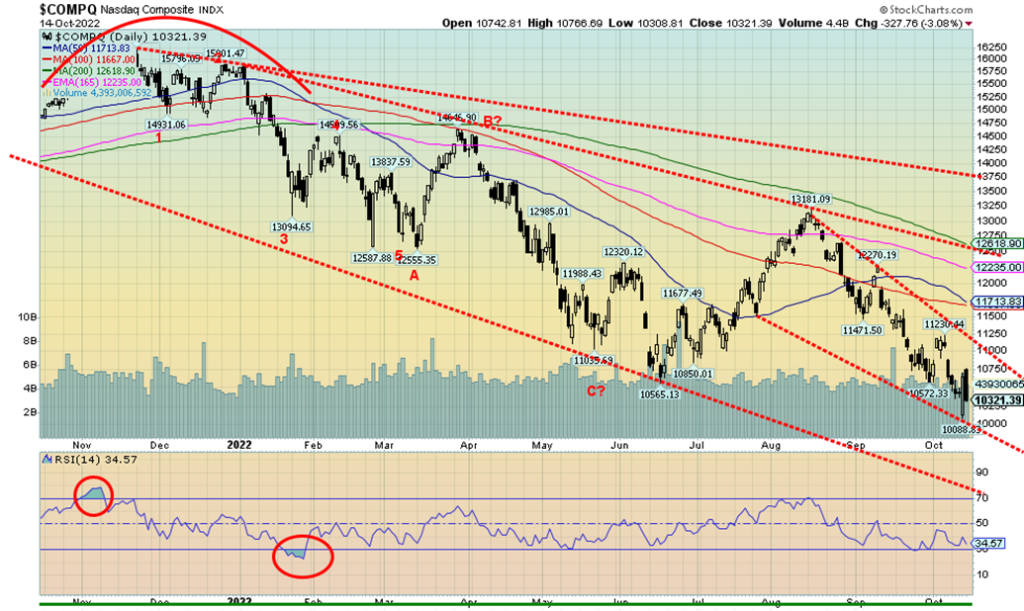
Like the others, the NASDAQ had an outside reversal day on Thursday followed by a setback on Friday. The Thursday reversal day came after the NASDAQ made fresh 52-week lows. A possible key reversal day. On the week, the NASDAQ fell 3.1%. The NY FANG Index dropped 5.7%, also to new 52-week lows. The FAANG stocks are significant in the NASDAQ. Of the FAANGs the big losers were the Chinese stocks Baidu, down 16.7%, and Alibaba, down 10.1%. Tesla fell 8.1% as Elon Musk was in the news in a negative way and Nvidia was off 7.0%. The biggest loser on the year has been Meta, down 62.3% in 2022. Netflix is down 61.8%. If there is a winner (an oxymoron this year) it is Twitter, up 16.7%, largely because of Musk’s potential take-out of the company. But that could disappear in a heartbeat if the deal collapses again. Above 11,000 the NASDAQ could break out, but the reality is we wouldn’t be able to at least confirm a low until we regain over 12,600. Support ranges down to 10,000 and right now that appears safe.
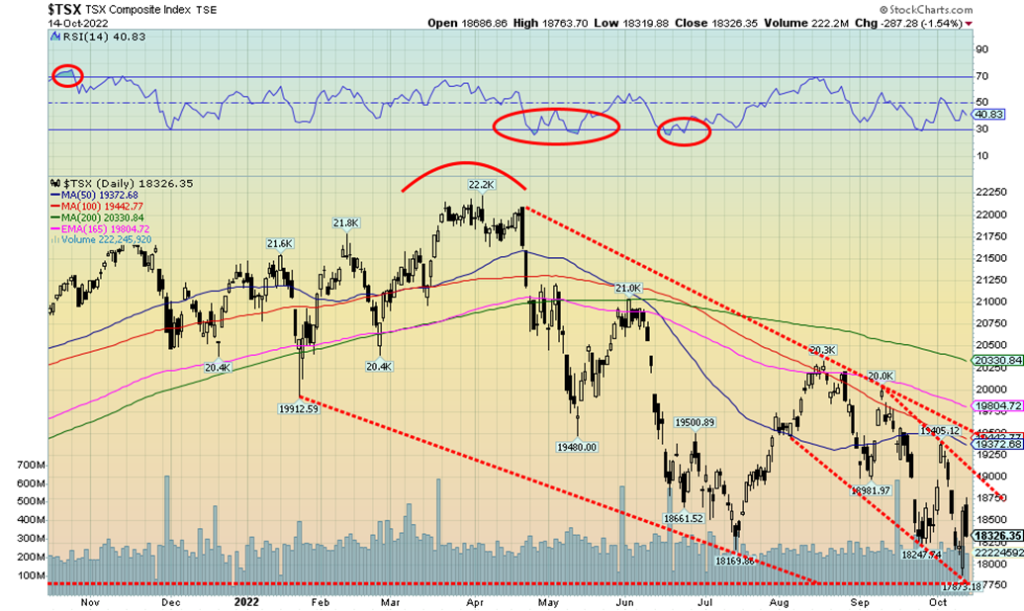
The TSX Composite, like the other indices, put in an outside day reversal on Thursday, only to be followed by a down day on Friday. The TSX Composite fell 1.4% on the week but the TSX continues to be one of the better- performing indices in the world. It’s down only 13.7% on the year, never entering an official bear market, unlike the U.S. indices. The TSX Venture Exchange (CDNX), however, wasn’t spared and it fell 4.4% on the week. Of the 14 sub-indices of the TSX, four were up on the week led by Consumer Staples (TCS), up 2.8%. Consumer Discretionary (TCD) gained 1.3%. Financials (TFS) were up 0.3% but not before they made fresh 52-week lows. The other gainer was, surprisingly, Real Estate (TRE), up 0.7%, but again not before making fresh 52-week lows. On the losing end, the biggest loser was Golds (TGD), down 5.7%. Energy (TEN) dropped 4.2%, Materials (TMT) fell 3.9%, and Utilities (TUT) continued its recent woes (interest-sensitive) down 3.4% to fresh 52-week lows.
52-week lows were a feature as the interest-sensitive sectors fell. Making 52-week lows were Income Trusts (TCM) -1.5%, Information Technology (TKK) -2.4%, and Telecommunications (TTS) -0.6%. On the year, the biggest loser is Health Care (THC), down 53.8%. Are there any winners? Yes, Consumer Staples (TCS) is up a paltry 0.6% on the year. But then, everyone needs to eat. Own a grocery store.
The TSX hit what may have been the bottom of a channel. If the outside day reversal on Thursday is to mean anything, we still need to see some upside follow-through, despite Friday’s setback. As long as we hold above 18,250, we should be okay and able to regroup to move higher. A breakout comes above 19,000, but any serious breakout doesn’t come until we are above 20,500.
10-year Treasury Bond/Canadian 10-year Government Bond (CGB)
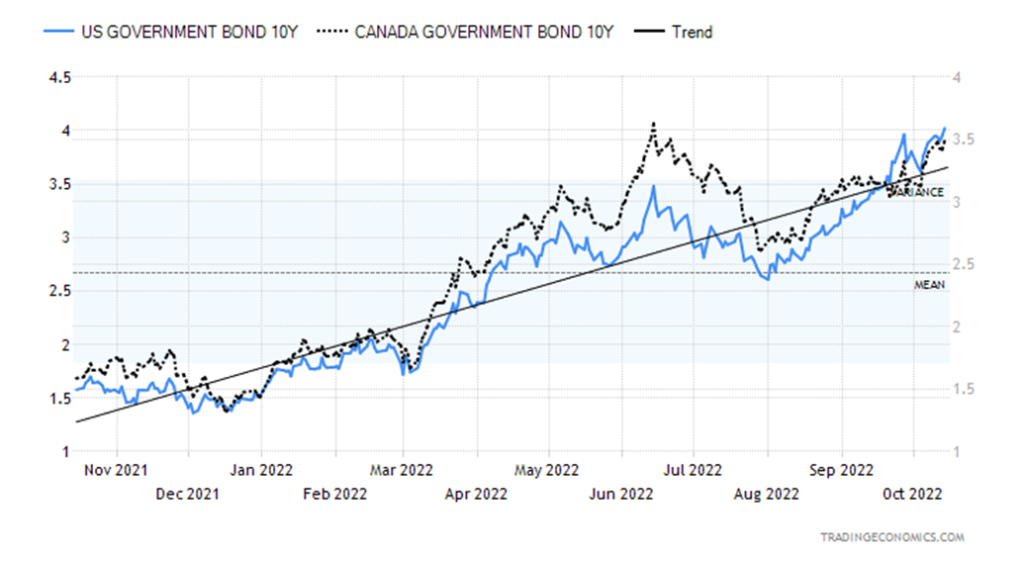
Up, up, and away. Interest rates in the U.S. keep on rising with the 10-year U.S. treasury note hitting 4.02% this past week. With the CPI coming in at 8.2% and the core inflation rate at 6.6%, it had immediate effects as U.S. bond prices fell (yields move inversely to prices) and expectations grew that the Fed could hike 75 bp at the November 1–2 FOMC. It wasn’t as if the U.S. saw booming economic numbers this past week. Weekly claims came in at 228,000 which was above expectations, thanks to an increase resulting from Hurricane Ian. Next week could see an even bigger jump in weekly claims. The FOMC minutes continued to lean on the side of higher interest rates. Retail sales disappointed as they were flat when they expected a gain of 0.2%. Year-over-year retail sales are up 8.2%, but once you strip out inflation, they are flat. A slight surprise came with the Michigan Consumer Sentiment Index as it ticked up to 59.8 when they had expected 58.3 vs. last month’s 58.6. Markets didn’t like that and stocks and bonds both sold off. The fear seems misplaced, given that the Michigan Consumer Sentiment Index continues near the lowest level seen in 40-years. Recession fears still reign as the followed 2–10 spread jumped to (or is it fell to) negative 48 bp from negative 42 bp. It is the lowest level seen this year. We do note, however, that the 3-month–10-year spread is still positive 19 bp. Usually, that one turns negative as well to signal a recession. The 30-year–10-year spread is negative 1 bp and has been as low as negative 16 bp.
In Canada, the 10-year Government of Canada bond (CGB) also rose to 3.49% from 3.39%. The 2–10 spread fell to negative 69 bp, also a low for the year. The recession is in the air, according to the 2–10 spread. The U.S., having reported two consecutive negative growth quarters, may already be in a recession although you’d never know it.
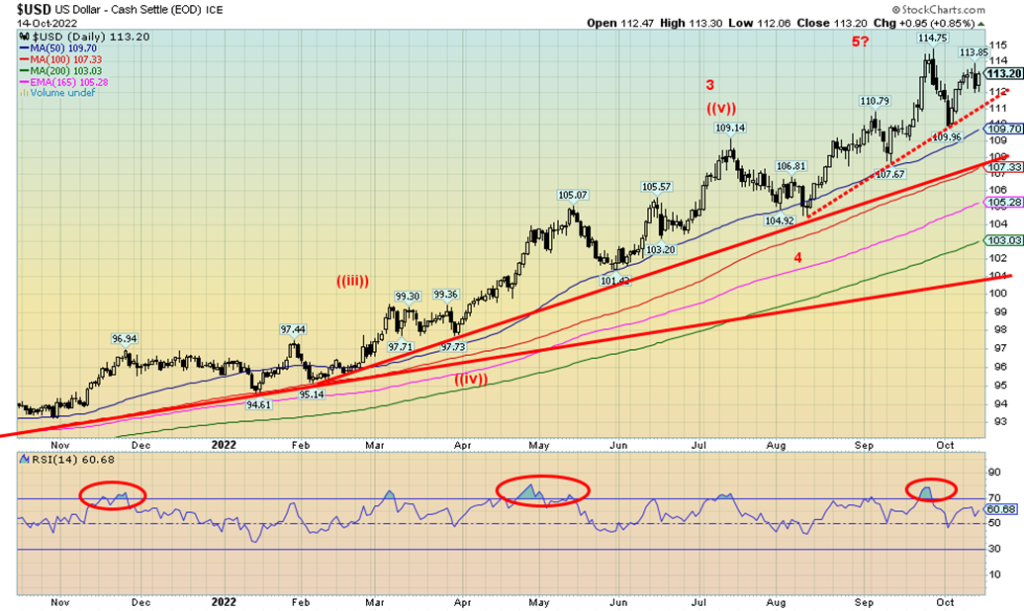
With inflation running at 8.2% and threats of up to a 75 bp hike in the Fed rate at the November 1–2 FOMC, the US$ Index soared once again. The gain on the week was 0.5%. That was enough to send the Cdn$, the Swiss franc, and the Japanese yen to fresh 52-week lows. The Cdn$ fell 1.2%, the Swiss franc was down 1.0%, while the Japanese yen dropped 2.2%, continuing its recent woes. The BOJ was steadily intervening in the market to try and stem the yen’s losses. But the reality is, with the lowest interest rates and inflation in the G7, Japan is fighting a losing battle to save the yen. The euro lost a small 0.1% but the pound sterling was up 0.7%, thanks to some reversals on the part of PM Truss and constant intervention in the market from the BOE.
The key is, what’s next for the US$ Index? We held our 110 support, so that level is now highlighted as key support. If we are making a lower top, then the odds would favour a breakdown under 110. The target could be down to 106. That would warm the gold bugs. The US$ Index continues to benefit from low interest rates in Japan, the chaos in Europe with the war, and the struggling Chinese market with continued fears of a property meltdown. High interest rates also attract capital and, at 4%, the U.S. has the highest 10-year rate except for the U.K. at 4.3% and Italy at 4.8%. All this translates into a higher US$ Index and, of course, falling gold prices.
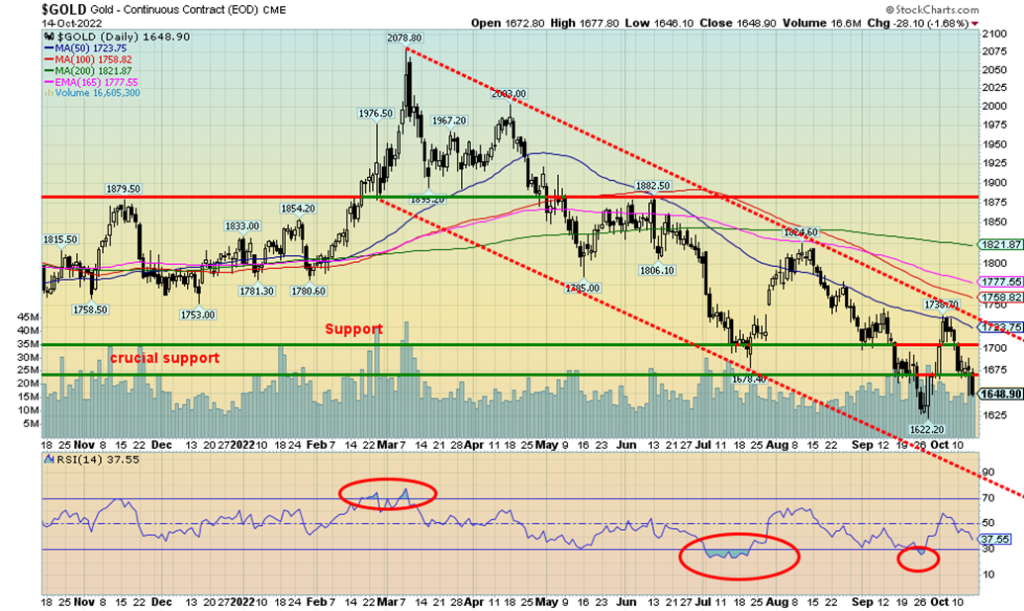
Once again, a soaring US$ Index and fear of rising interest rates sent gold tumbling. Gold lost 3.5% but silver was hit harder, down 10.8%. Platinum was off 2.5% while palladium dropped 8.9%, but copper actually gained, up 0.9%. The gold stocks were hit with the Gold Bugs Index (HUI) down 7.2% and the TSX Gold Index (TGD) down 5.7%. All in all, a very poor week. It was the worst week in a month and it kept up the pressure on gold prices, raising the potential for new lows. We have passed the point that might suggest we could see new lows. Closing at $1,649, our key point was at $1,650. So, we are on the cusp. Further declines this coming week would ensure we’ll likely see new lows below $1,622. We are well under the 200-day MA ($1,822) and we are threatening to break the 4-year MA ($1,670). That would be a sign that this bear is becoming dangerous. We need to regain $1,700 and soon if we are to have any hope of not seeing further declines. Note that we failed under $1,750 which was our next point to clear to help confirm a low. There is not a lot of support between here and the March 2020 pandemic low near $1,450. So, it clearly is possible we could tumble to that level. If the large possible double top seen near $2,080/$2,090 in August 2020 and March 2022 is correct, we could fall to $1,250. We are looking for our 7.83-year and the 23.5-year cycle low. We are in the period that could happen, but we are just in the early stages, which could stretch out to 2024.
The inflation rate didn’t help. But then higher weekly claims and flat retail sales didn’t help gold either. With the fear of higher interest rates on the table and a soaring US$ Index, it is difficult for gold to rally. Gold in other currencies couldn’t even muster gains, although with the US$ Index up, the drop in other currencies wasn’t as steep as the drop in U.S. dollars.
On a positive note, we read that Turkey has imported some 140,126 kg of gold in 2022 as the lira has fallen sharply. In September they took in 39,000 kg. Individuals have been selling their lira to buy gold. Companies have been preferring to deal in gold rather than lira. Turkey’s inflation was last at 83.5%. The lira has fallen 29% in 2022. But Turkey’s central bank rate is only at 12%, well below the rate of inflation. They even cut it 100 bp in September in a surprising move.
We are on the cusp of a possible breakdown where not only could gold see new lows but silver and the gold stocks could as well. That would confirm each other and end thoughts of positive divergences. We need a shift in sentiment to change this market around. But none seems to be coming.
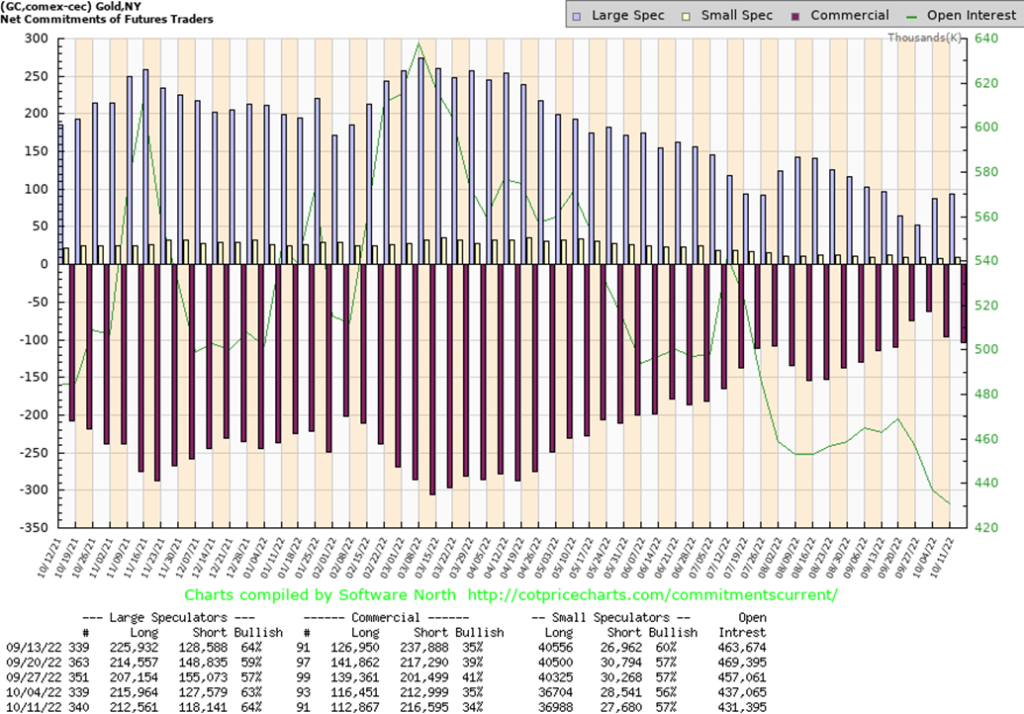
The gold commercial COT (bullion companies and banks) slipped this past week to 34% from 35%. Since the cut-off was October 11, this report does not include the drop seen in gold prices at the end of the week. Long open interest fell almost 4,000 contracts while short open interest jumped almost 4,000 contracts. The large speculators’ COT (hedge funds, managed futures, etc.) rose to 64% from 63% as they cut 3,000 longs but also cut 9,000 shorts. While we do not view this COT as bearish, we can’t view it as overly bullish either. We’ll await next week’s COT to see if it has changed favorably as a result of the drop at the end of the week.
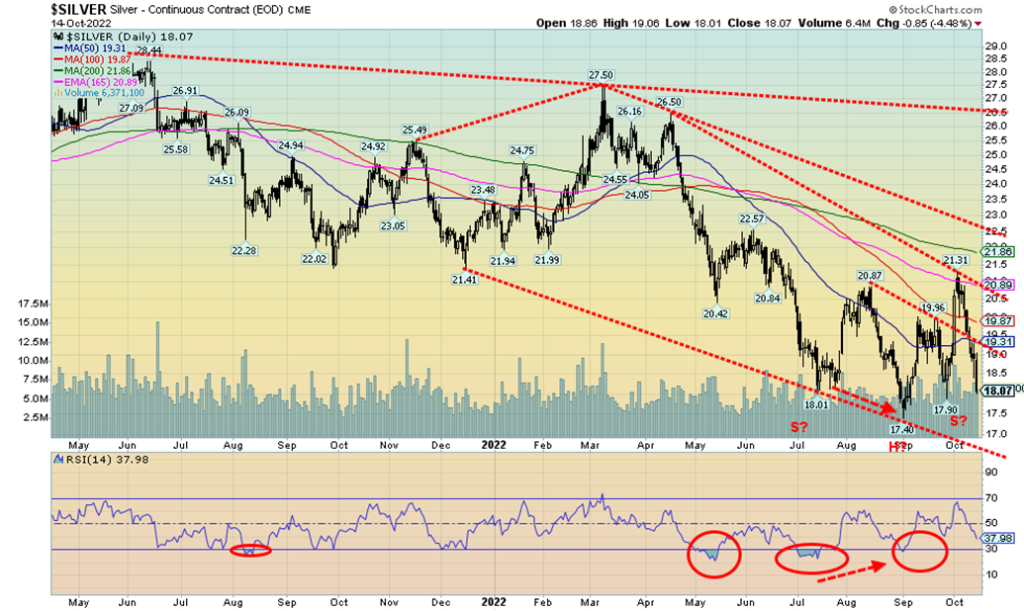
Silver plummeted this past week, losing 10.8%. It was the steepest drop since mid-August. What’s worse, this came following a good up week. As well, we have plunged past $18.30, a level that suggests that new lows could be seen below $17.40. The current bottom of this channel is just below $17. A breakdown under $17 could be dangerous as targets could then be somewhere between $14 and $16. So far of late we saw gold make new lows but not silver. Could they switch places once again? And silver makes new lows while gold does not? Certainly, if we break under $17.90, then the potential head and shoulders bottom pattern would be shattered for good. We appear to be headed in that direction. Only regaining back above $20 could save this now. New lows appear to lie ahead.
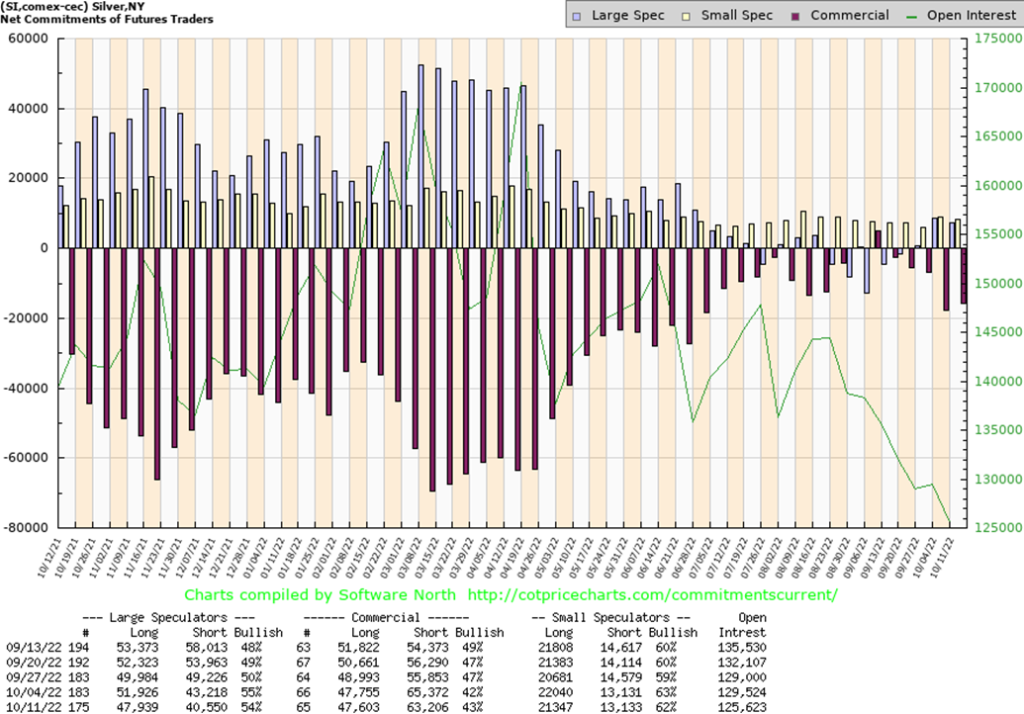
The silver commercial COT improved marginally this past week to 43% from 42%. Long open interest was relatively flat but short open interest dropped around 2,000 contracts. Overall, open interest fell about 4,000 contracts, suggesting continued short covering. The large speculators COT slipped to 54% from 55% as they dropped about 4,000 longs but also dropped about 3,000 shorts. Given the drop in silver prices at the end of the week, next week’s report could prove interesting. The silver COT remains bullish.
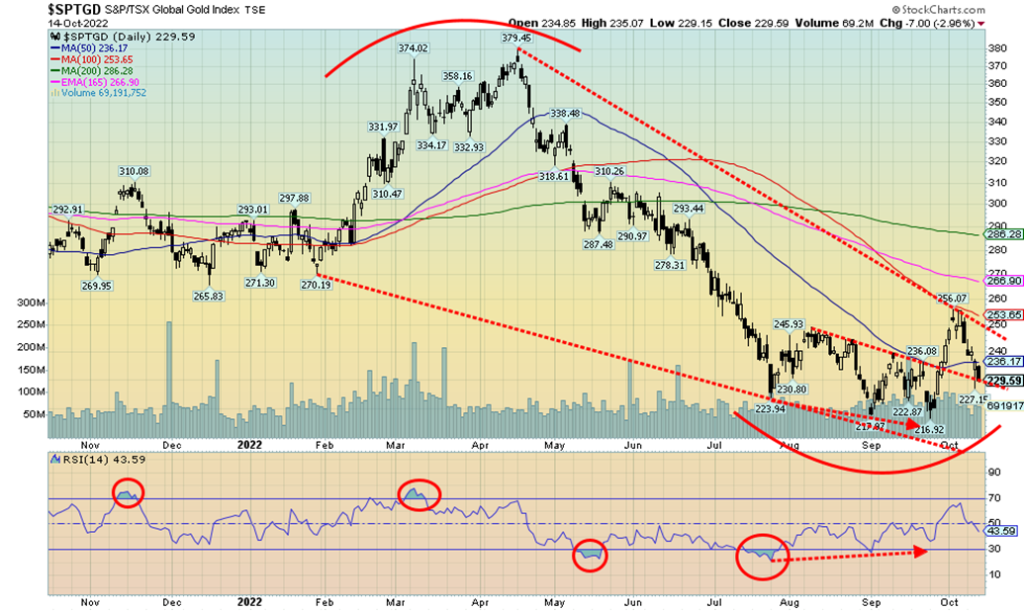
Just as we thought we might have something going with the gold stocks, they were stopped in their tracks and sent tumbling back down. The TSX Gold Index (TGD) fell 5.7% this past week while the Gold Bugs Index (HUI) dropped 7.2%. Despite this, our outlook remains positive, given the positive divergences we saw between the price action and the indicators represented here by the RSI. Sentiment had improved, leaping from a low of 3.45 for the Gold Miners Bullish Percent Index (BPGDM) to Friday’s close at 24.14. The low at 3.45 was the lowest seen since the pandemic crash of 2020 and not far above the low seen in December 2015. All this continues to point to a possible low. But even if we rally, the question is how high can we get? The TGD hit resistance in the 250/255 area, but above that lies more resistance at 265 and 285. Only clearing above 300 could set us on pace for higher prices. A breakdown under 225 (which we are perilously close to) suggests we could see new lows instead.
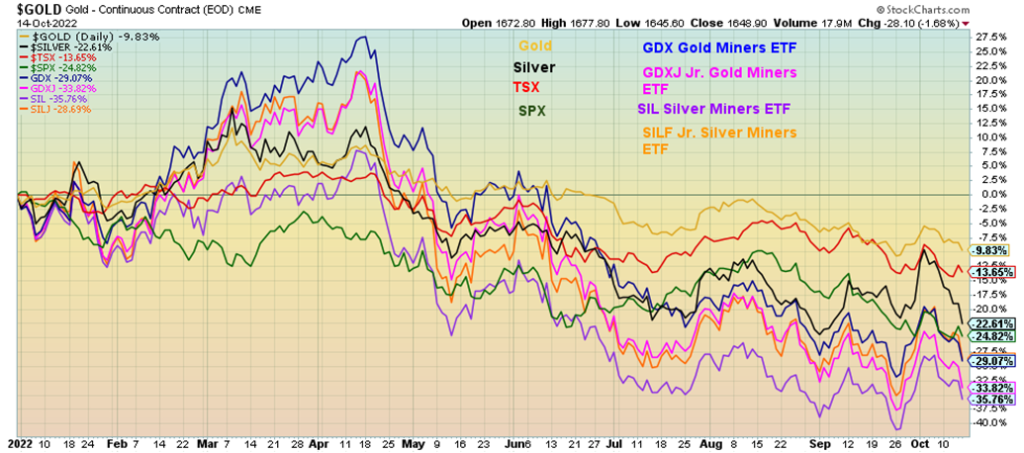
If there is any index of gold miners that is suffering it is the TSX Venture Exchange (CDNX), which is down a miserable 38.1% in 2022. Numerous junior gold mining stocks are down 50% or more. The gold and silver stocks have not been performing. Our chart below shows the year-to-date performance of gold, silver, and others. Returns have been as follows:
- Gold (9.8)%
- Silver (22.6)%
- TSX (13.6)%
- S&P 500 (24.8)%
- GDX Van Eck Gold Miners (29.1)%
- GDXJ Van Eck Jr. Gold Miners (33.8)%
- SIL Global X Silver Miners (35.8)%
- SILJ PureFunds Jr. Silver Miners (28.7)%
Not shown but worth mentioning is that the NASDAQ is off 34.0%. No joy to be seen anywhere.
Because we are so close to breaking under 225, we cannot rule out a retest of the lows and even new lows. The next zone of support would be between 200 to 210. The March 2020 low was at 173. But that was a spike. Not the relentless downtrend that this is.
The strange part, particularly for the junior miners, is that they continue to raise cash. Many have excellent resources and are currently very undervalued. Gold stocks remain exceedingly cheap compared to the price of gold. We haven’t seen gold stocks this cheap since the late 1990s, a period of another important bottom for gold and gold stocks.
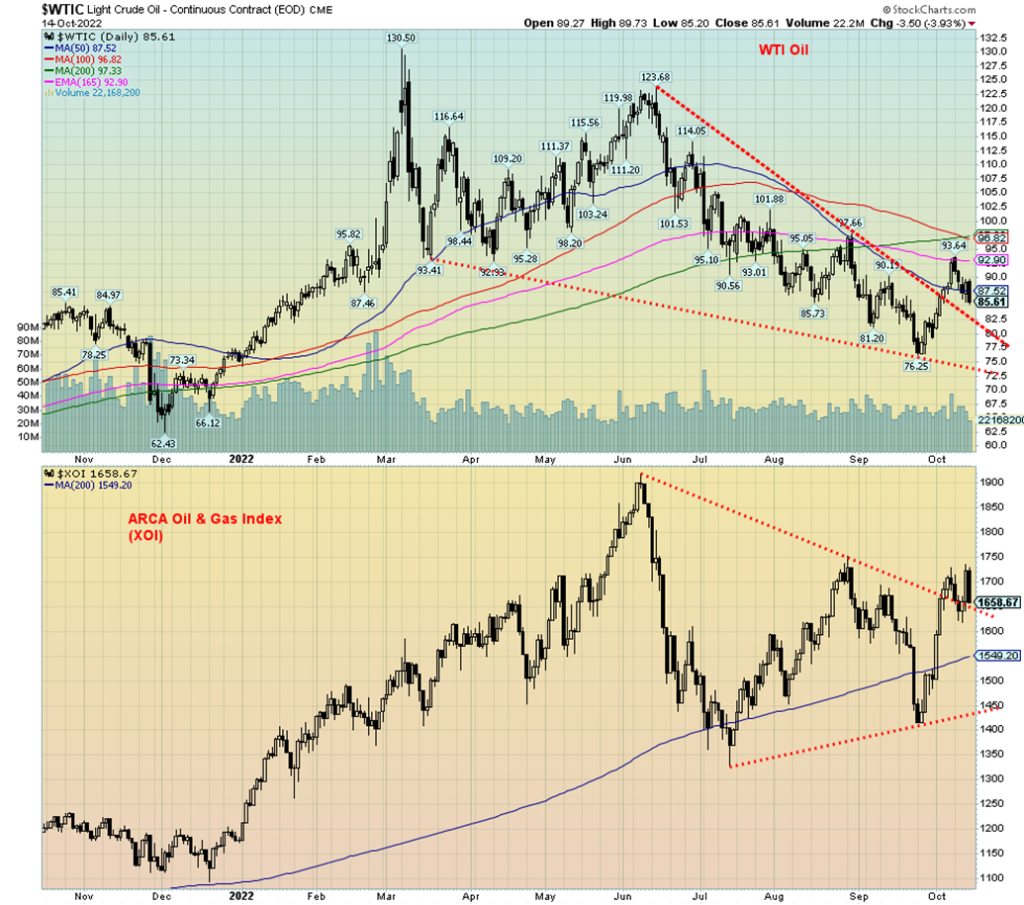
So, have oil and the energy stocks broken out or are they just playing with us in this up/down week? Energy stocks leaped on Thursday, then got smacked on Friday. We appear to have broken out of downtrends but thus far the breakout has not been conclusive. Crude oil stocks jumped by a surprising 10 million barrels. But diesel stocks fell 4.9 million barrels and gasoline stocks were largely unchanged. Still, all are at or below the five-year average. As a result, this was a very mixed week but also a down week.
WTI oil fell 7.6%, natural gas (NG) was down 4.4%, while EU NG at the Dutch Hub fell 9.1%. This was despite an escalation in the Russia/Ukraine war. You’d think they’d be worried about shortages. Strikes in France, the OPEC cut, and attempts to put a price cap on Russian oil all are bullish. Besides the news about a jump in oil stocks, the inflation data was problematic for oil. We note retail sales were flat, so worries about a recession are rising. OPEC also cut its demand forecast for 2023 by 2.3 million bpd. They also reduced their 2022 forecast by 2.64 million bpd. The cut in demand probably helped their decision for the 2 million bpd cut in production.
Energy stocks didn’t fare well either, although not as badly as the drop in WTI. The ARCA Oil & Gas Index (XOI) fell 2.1% while the TSX Energy Index (TEN) dropped 4.2%. The XOI held the breakout line, but its failure to move beyond that much suggests we could yet fail. A good move above 1,750 would convince us we are headed higher. However, a return back under the breakout line and close under 1,615 would tell us we are headed lower. Indicators are pointed up and the trend is up.
WTI oil also broke out of its downtrend, but it has failed to move the needle much since. It is now threatening to do the opposite, fall instead of rise. A break back under $85 would be negative and could soon send us back down to $80. The recent low was at $76.25. OPEC seemed to indicate that their preference is for oil to trade between $80 and $120. WTI needs to quickly regain back above $92 to suggest to us that we are poised for further gains. Given what happened this week, it may be a while coming.
Copyright David Chapman, 2022
__
(Featured image by Adam Śmigielski via Unsplash)
This article may include forward-looking statements. These forward-looking statements generally are identified by the words “believe,” “project,” “estimate,” “become,” “plan,” “will,” and similar expressions. These forward-looking statements involve known and unknown risks as well as uncertainties, including those discussed in the following cautionary statements and elsewhere in this article and on this site. Although the Company may believe that its expectations are based on reasonable assumptions, the actual results that the Company may achieve may differ materially from any forward-looking statements, which reflect the opinions of the management of the Company only as of the date hereof. Additionally, please make sure to read these important disclosures.
David Chapman is not a registered advisory service and is not an exempt market dealer (EMD) nor a licensed financial advisor. He does not and cannot give individualised market advice. David Chapman has worked in the financial industry for over 40 years including large financial corporations, banks, and investment dealers. The information in this newsletter is intended only for informational and educational purposes. It should not be construed as an offer, a solicitation of an offer or sale of any security. Every effort is made to provide accurate and complete information. However, we cannot guarantee that there will be no errors. We make no claims, promises or guarantees about the accuracy, completeness, or adequacy of the contents of this commentary and expressly disclaim liability for errors and omissions in the contents of this commentary. David Chapman will always use his best efforts to ensure the accuracy and timeliness of all information. The reader assumes all risk when trading in securities and David Chapman advises consulting a licensed professional financial advisor or portfolio manager such as Enriched Investing Incorporated before proceeding with any trade or idea presented in this newsletter. David Chapman may own shares in companies mentioned in this newsletter. Before making an investment, prospective investors should review each security’s offering documents which summarize the objectives, fees, expenses and associated risks. David Chapman shares his ideas and opinions for informational and educational purposes only and expects the reader to perform due diligence before considering a position in any security. That includes consulting with your own licensed professional financial advisor such as Enriched Investing Incorporated. Performance is not guaranteed, values change frequently, and past performance may not be repeated.


Skybound Entertainment Launches Crowdfunding Campaign to Create an Invincible Game
Skybound Entertainment launches a crowdfunding campaign on Republic to create a AAA game based on its Invincible comic. The campaign...


36% of Cannabis Users Report a Reduction in Alcohol Consumption
A Numerator survey found that 36% of cannabis users reported decreased alcohol intake since using cannabis products. Cannabis users, mainly...


Green Arms Raised Almost 1 Million in its Crowdfunding Round on CrowdFundMe
Green Arms, an innovative startup facilitating citizen and business participation in renewable energy projects, has nearly reached 1 million euros...


Vithas and MSD Join Forces to Train and Innovate in Oncology Matters
Vithas and MSD have formed an alliance to enhance patient care, especially in cancer treatment. The collaboration focuses on innovation,...


What You Can Do to Create an Online Store People Trust
Learn how to build trust in your online store with expert tips. From sleek website design to secure payment processing,...
 |
|
 |  |
 |
|
-

 Crowdfunding1 week ago
Opstart Buys Majority Stake in BackToWork
-

 Markets2 weeks ago
Fear and Consequence: Week’s Stock Market Theme
-

 Crowdfunding4 days ago
Fidovet, a Small Italian Multinational Pet Food Company Raises Money on Mamacrowd
-
 Crypto1 week ago
Will Bitcoin Now Break the $100,000 Mark? This Is What You Need to Know About Bitcoin Halving