Featured
How Climate Change is Affecting Stock Markets and the Global Economy
This week’s theme is climate change, global warming whatever one wishes to call it and the growing and costly devastation it is causing because of hurricanes, wildfires, droughts and more. It is threatening millions and it is going to negatively impact the global economy and as costs rise add to the debt of nations. Could it spark a financial crisis? Renewable energy stocks are still a place to be.

Hurricanes, wildfires, floods, and drought: yes, it has been that kind of year. It’s as if the seven plagues of Egypt are being unleashed on us. Or is it 10 plagues? Now we are not suggesting that rivers and lakes are about to turn to blood or that frogs will rain from the sky but even they had logical explanations. The blood was the growth of red algae blooms which can build up in oceans and freshwater. And it’s toxic. Frogs could be fleeing toxicity in their habitat. That has happened. And as you work through the other plagues of Egypt, one realizes there are also scientific explanations for all of them.
U.N. data shows that natural disasters have increased five-fold since the 1970s. 2021 has been a bad year. With drought-fueled fires in the U.S and Western Canada accompanied by extreme heat, wildfires in Southern Europe and Siberia, severe floods causing destruction and death in Germany and China, and, most recently, Hurricane Ida that battered Louisiana and then sparked flash floods in the U.S. northeast including flooding the New York subway and turning parts of New York City into a lake. Haiti was hit by a deadly earthquake and then to add to their misery they were hit by Tropical Storm Grace.
The fact that over 50,000 people have been ordered to evacuate in El Dorado County near and around Lake Tahoe that straddles the border in Nevada and California because of the Caldor fire shows that the natural disasters do not differentiate between the poor and the well-off. Both are treated the same. Natural disaster climate refugees as of 2020 were estimated at over 55 million globally and over 1.2 million in the U.S. However, at any point in time there could be a lot more. It was estimated that in 2017 68.5 million were displaced at least temporarily, not because of war but because of climate disasters. These numbers are expected to rise.
It has been estimated that upwards of one billion people could be climate refugees by 2050 due to rising sea levels, floods, fires, and intense storms. This doesn’t include other natural disasters such as earthquakes and volcanoes. Poor infrastructure is one of the prime reasons they are danger. Climate change triggers other problems such as desertification, drought, deforestation, land degradation, rising sea levels, floods, more frequent and extreme storms, earthquakes, volcanoes, food insecurity, and famine. The regions most at risk are sub-Saharan Africa, South Asia, Central Asia, and Latin America. North America and Europe will not be spared. Rising sea levels are not only impacting numerous cities around the world, including major cities like Jakarta and Miami but entire islands, already inhabited, are disappearing under the waves. Where do the people go? Food security is a problem. It is estimated that upwards of 25% of the global population face food insecurity. Drought along with supply disruptions are today sparking food shortages and a prime reason we are experiencing food inflation.
But it is the rising, staggering costs that could upend the global economy. It is estimated that climate change disasters could cut the world economy by $23 trillion by 2050. These are estimates from giant insurance companies such as Swiss Re as they are the ones that have to pay out the staggering bills. But it is the taxpayer that is most at risk as already debt-laden countries are forced to go even deeper into debt. That in turn could cause economic instability. Western developed countries are already facing high polarization over vaccines for the COVID and those that deny or downplay climate change and the ensuing staggering costs. That could in turn spark more and deadlier confrontations in an increasingly polarized world.
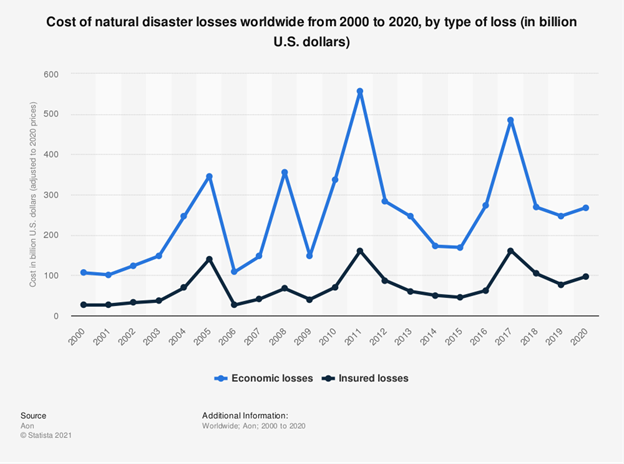
In 2020 alone there were 22 $1 billion-plus weather disasters in the U.S., including seven hurricanes. Globally in 2020 the economic loss of natural disasters was $268 billion, while insured losses were $97 billion. Billion dollar-plus events in the U.S. in 2020 cost an estimated $95 billion. The costliest were Hurricane Laura, the Western wildfires, and huge wind storms in the North Central U.S. (total – $46.5 billion). The tally from 2021 is not yet tabulated. In the U.S. alone disasters cost $532 billion in 2015–2019 and over $800 billion from 2010-2019 with costs escalating in the latter part of the decade. Wildfires in 2020 in the U.S. cost an estimated $13 billion and hurricanes $20 billion. Floods in Germany in 2021 were estimated at $30 billion. Droughts in the U.S. Southwest are a growing problem with lakes shrinking and reservoirs going dry. It is estimated that has already cost between $9–$14 billion. Four of the five most deadly hurricanes in the U.S. occurred in the past decade (Harvey, Irma, Maria, and Sandy). No word yet on the cost of 2021’s wildfires, drought, and most recently Hurricane Ida. The reality is that events and costs are accelerating from previous periods.
For the record, the costliest natural disaster was the earthquake and tsunami that struck Japan in 2011. The most expensive natural disaster in the U.S. was Hurricane Katrina in 2005. The cost of Hurricane Ida is unknown at this time. The droughts and heat waves experienced in 2021 may surpass the cost of the droughts and heat waves the U.S. experienced in 1988 and 2012. The chart below depicting the cost of natural disasters since 2000 to 2020 shows that costs spiked on average every four years. It would not be surprising to see 2021 challenge the 2011 spike or even surpass it.
The greening of the economy will continue. Those major corporations and financial institutions are onside with this put a wrench in those who deny or downplay climate change. According to the investment bank UBS, it is estimated that by 2025 25% of all new cars globally will be electric. By 2030 that could rise to 40% and by 2040 virtually all new cars will be electric. This gives extra added emphasis to the Intergovernmental Panel on Climate Change (IPCC) that has predicted the earth’s temperatures will rise 1.5⁰ C above pre-industrial levels over the next two decades, surpassing all the goals of the 2015 Paris Climate Agreement. Besides electric cars, the push towards renewable energy will also continue. The Economist in a fascinating article has questioned: “Could Climate Change Trigger a Financial Crisis?” (The Economist, Sept 4, 2021 – https://www.economist.com/finance-and-economics/2021/09/04/could-climate-change-trigger-a-financial-crisis).
Our final chart below shows how temperatures have changed over the past 1700 years. It shows what was known as the Medieval Warm Period that peaked around 1300 as well as the Little Ice Age that troughed around 1600. The Medieval Warm Period would have largely coincided with the peak in the Byzantine Empire, the Mongol Empire, and the Mayan Empire. Empires tended to peak during periods of warming. Prime examples were the Egyptian Empire, the Roman Empire, and more recently the British Empire—and possibly even now the U.S. Empire. Periods of global cooling (yes, they occur) coincided with the collapse of the Minoan Empire, the Athenian empire, the European Dark Ages, and the wars and plagues of the 15th to 17th centuries. In some respects, this one is different as temperatures today are the hottest in 125,000 years. Man has never experienced this before although, yes, the earth has given evidence that the poles were tropical as well as periods where the earth was covered in ice sheets. The weather is what is happening today. Climate is something that evolves over a long period of time and history tells us it is constantly changing. The question is how to deal with it and how much will it cost.
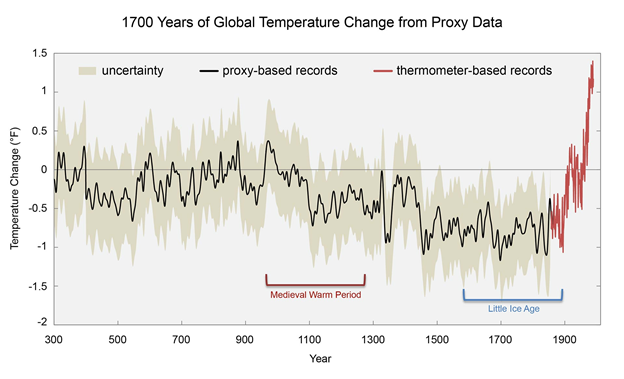
Chart of the Week
As if it hasn’t been a bad enough week with Hurricane Ida ravaging New Orleans and Louisiana, then it’s the aftermath ravaging the Northeast U.S., including leaving riders in the New York City subway swimming their way to the surface. Okay, that last one is an exaggeration but the 235,000 jobs created in August when the market consensus was for 750,000 new jobs was not an exaggeration. Or is it an understatement?
We have been noting for some time that the economy was not as strong as many would like to believe. The Delta variant is taking its toll, sparking what appears to be a drop in consumer demand and in consumer confidence. One of weakest areas was in leisure and hospitality as the Delta takes its toll and hiring still has its challenges. Retail trade actually saw a decline, and restaurants and bars lost 42,000 jobs. As well, construction jobs faltered but gains were seen in professional and business services, education, warehousing, and transportation. Construction was weak due to supply disruptions, something that is an ongoing problem everywhere and has sparked price increases in a number of areas. The Delta is playing a big role in keeping people from wanting to work, particularly in hospitality, retail and restaurants, and bars. As well, many are reassessing their career and life and questioning whether they will return to jobs in hospitality or retail. Even as schools prepare to reopen there is concern and hesitancy about going back.
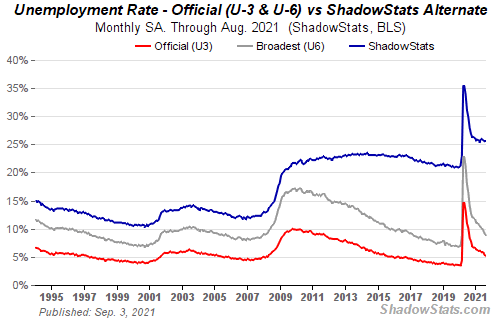
Offsetting the big miss was an upward revision for July. Private sector jobs increased by 243,000 as the loss was in the government sector (down 8,000). The labour force increased by 190,000 which helped to lower the official unemployment rate (U3) to 5.2% from 5.4%. The U6 unemployment rate, which is the U3 rate plus short-term discouraged workers under one year and those working part-time for economic reasons along with other marginally attached workers, came in at 8.9% vs. 9.2% in July. Possibly the most telling number was the Shadow Stats (www.shadowstats.com) number that was unchanged at 25.6%. The Shadow Stats number is the U6 unemployment plus long-term discouraged workers unemployed beyond one year and defined out of the labor force in 1994. This then is the real unemployment rate in the U.S.
The labor force participation rate for August was unchanged at 61.7% while the employment-population ratio was 58.5% vs. 58.4% in July. For comparison’s sake, the employment-population ratio in February 2020 was 61.1% and the labor force participation rate was 63.3%. The lower participation rates are a prime reason the unemployment rate is lower because of those rates were back where they were in February 2020 the unemployment rate would be considerably higher. Indeed, all areas are down from February 2020. The U.S. is still short some 5.3 million jobs from where it was before the onset of the pandemic. Some 5.6 million people haven’t been able to go back to their old jobs or only part-time. Yes, there are job openings galore (estimate, at least 10 million), but mismatched skills and experience are playing a role in leaving many unfilled. Full-time employment is down 4.1 million and part-time employment is down 2.0 million, even as the labor force itself is lower by 3.1 million. With labor still in the doldrums, projecting a miracle recovery appears to be a stretch. Most forecasts now are not suggesting complete employment recovery until at least 2023. And that is a big if that the current Delta variant doesn’t lay waste to the labor market into the fourth quarter.
Those not in the labor force rose 1,170,000 in August as more workers fell into the long-term unemployed and retirees grew. Those considered not in the labor force rose to 100,105,000 Retirement is a problem as many decided not to return, especially older workers. There are 55.7 million retirees and 9.4 million on disability making up the bulk of those not in the labor force. Full-time students would also be included in that category. Those unemployed for 27 weeks or longer actually fell by 308,000, but you’d never know it by some of the other numbers.
Average weekly hours were unchanged at 34.7 while average hourly earnings rose 4.3% year over year. That latter number was above the consensus 4.0% as employers in some industries are being forced to pay higher wages to attract people. This report is going to put some hesitation in the Fed’s thoughts of tapering. And the U.S. economy appears to be weaker than many expected. Systemic risk in the economy remains.
As a result of the report gold jumped, the U.S. dollar fell, the stock market wavered while bond yields continued to bounce around, up a little. But the report gave little solace as to whether the recession is over, although many are saying it is. Too bad it doesn’t really feel that way. The jobs picture remains in a hole deeper than anything seen in the past. Taper? The odds are dimming.
MARKETS AND TRENDS
| % Gains (Losses) Trends | ||||||||
| Close Dec 31/20 | Close Sep 3/21 | Week | YTD | Daily (Short Term) | Weekly (Intermediate) | Monthly (Long Term) | ||
| Stock Market Indices | ||||||||
| S&P 500 | 3,756.07 | 4,535.43 (new highs) | 0.6% | 20.8% | up | up | up | |
| Dow Jones Industrials | 30,606.48 | 35,639.09 | 0.5% | 16.4% | up | up | up | |
| Dow Jones Transports | 12,506.93 | 14,751.62 | (1.0)% | 17.8% | up | up (weak) | up | |
| NASDAQ | 12,888.28 | 15,363.62 (new highs) | 1.6% | 19.2% | up | up | up | |
| S&P/TSX Composite | 17,433.36 | 20,821.43 (new highs) | 0.9% | 19.4% | up | up | up | |
| S&P/TSX Venture (CDNX) | 875.36 | 923.22 | 3.6% | 5.5% | up (weak) | down (weak) | up | |
| S&P 600 | 1,118.93 | 1,369.73 | (0.4)% | 22.4% | up | up | up | |
| MSCI World Index | 2,140.71 | 2,396.94 | 2.0% | 12.0% | up | up | up | |
| NYSE Bitcoin Index | 28,775.36 | 49,695.33 | 3.2% | 72.7% | up | up (weak) | up | |
| Gold Mining Stock Indices | ||||||||
| Gold Bugs Index (HUI) | 299.64 | 258.13 | 1.4% | (13.9)% | down | down | up (weak) | |
| TSX Gold Index (TGD) | 315.29 | 294.11 | 1.1% | (6.7)% | down | down | up (weak) | |
| Fixed Income Yields/Spreads | ||||||||
| U.S. 10-Year Treasury Bond yield | 0.91 | 1.32% | 0.8% | 45.1% | ||||
| Cdn. 10-Year Bond CGB yield | 0.68 | 1.19% | (0.8)% | 75.0% | ||||
| Recession Watch Spreads | ||||||||
| U.S. 2-year 10-year Treasury spread | 0.79 | 1.09% | flat | 38.0% | ||||
| Cdn 2-year 10-year CGB spread | 0.48 | 0.79% | 4.0% | 64.6% | ||||
| Currencies | ||||||||
| US$ Index | 89.89 | 92.03 | (0.7)% | 2.4% | down | up | down | |
| Canadian $ | 0.7830 | 0.7991 | 0.9% | 2.0% | up (weak) | neutral | up | |
| Euro | 122.39 | 118.77 | 0.7% | (3.0)% | up | down | up | |
| Swiss Franc | 113.14 | 109.40 | (0.3)% | (3.3)% | neutral | down (weak) | up | |
| British Pound | 136.72 | 138.61 | 0.7% | 1.4% | up | neutral | up | |
| Japanese Yen | 96.87 | 91.15 | 0.1% | (5.9)% | up (weak) | down | down | |
| Precious Metals | ||||||||
| Gold | 1,895.10 | 1,833.70 | 0.8% | (3.2)% | up | up (weak) | up | |
| Silver | 26.41 | 24.80 | 3.1% | (6.1)% | neutral | down | up | |
| Platinum | 1,079.20 | 1,021.60 | 1.5% | (5.3)% | down | down (weak) | up | |
| Base Metals | ||||||||
| Palladium | 2,453.80 | 2,416.30 | 0.3% | (1.5)% | down | down | up | |
| Copper | 3.52 | 4.33 | flat | 23.0% | neutral | up (weak) | up | |
| Energy | ||||||||
| WTI Oil | 48.52 | 69.29 | 0.8% | 42.8% | neutral | up | up | |
| Natural Gas | 2.54 | 4.71 (new highs) | 7.3% | 85.4% | up | up | up |
New highs/lows refer to new 52-week highs/lows and in some cases all-time highs.
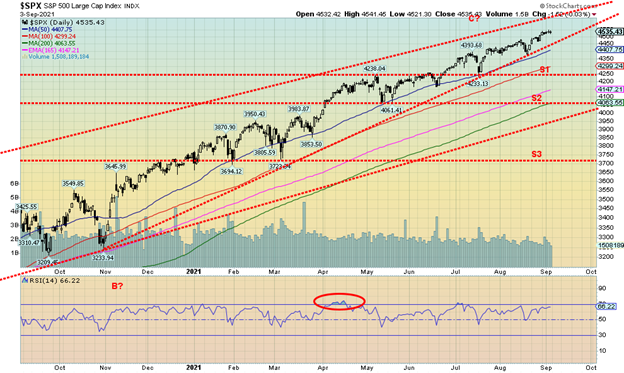
Could the weaker-than-expected jobs report that came out on Friday be a trigger to a stock market correction? Once again, the S&P 500 made new all-time highs, up 0.6% on the week, but on Friday the markets faltered although the S&P 500 was off small on the day. Still, it’s worth considering given that we are seeing faltering breadth, faltering bullish percent, falling stocks trading over their 200-day MA, and falling volume. All of that appears to be meaningless in the face of a market that pushes relentlessly higher, defying the bears. Friday’s job numbers also, as we have noted, have put doubt into whether the Fed will taper later this year. There are rising cases of the Delta variant and once again the U.S. leads the world in cases with daily deaths over 1,000 per day. There are astounding numbers of over 40 million cases and 670,000 deaths in the U.S., making the COVID one of the deadliest plagues ever in U.S. history and one of the highest death tolls for plagues or war.
Others joining the all-time high party were the S&P 500 Equal Weight, the Dow Jones Utilities (DJU), the NASDAQ 100, the S&P 100 (OEX), the Wilshire 5000, and the Russell 1000 and 3000. The Dow Jones Industrials (DJI) was up 0.5% on the week but no new highs. The Dow Jones Transportations (DJT) (see below) diverged again, down 1.0% on the week. The NASDAQ gained 1.6% to new highs. The S&P 600 small-cap lost 0.4%. In Canada, the TSX Composite made new highs, up 0.9% and the TSX Venture Exchange (CDNX) had its best week in months, up 3.6%. The MSCI World Index gained about 2.0% but no new highs. Bitcoin recovered slightly, up 3.2% to $49,700.
In the EU, the London FTSE was flat, the Paris CAC 40 was up 0.1%, and the German DAX actually fell off about 0.5%. Nobody made all-time highs. In Asia, China’s Shanghai Index (SSEC) was up 1.7% while the Tokyo Nikkei Dow (TKN) had a good week, up 5.4%. Maybe they were happy over the resignation of the Prime Minister.
Indicators are diverging. Volume is falling. We are in the season for a correction. What could go wrong? Fed Chair Jerome Powell has stated that they need to see more evidence of recovery before they would start tapering. They didn’t get that Friday with the job numbers. It was the opposite. The DJI fell on the day. The odds of the Fed announcing tapering at the September 21–22 FOMC are slipping away. It is possible that could give the market comfort and keep the party going. We can’t deny that, but it is getting difficult to add to positions given the growing divergences.
Support is seen at 4,450, 4,250, 4,050, and 4,000. Below 4,000 a bear market could be underway. Above it is hard to say but the S&P 500 could rise in a wedge to as high as 4,600/4,700. But time, it appears, is running out on one of the longest bull markets in history.
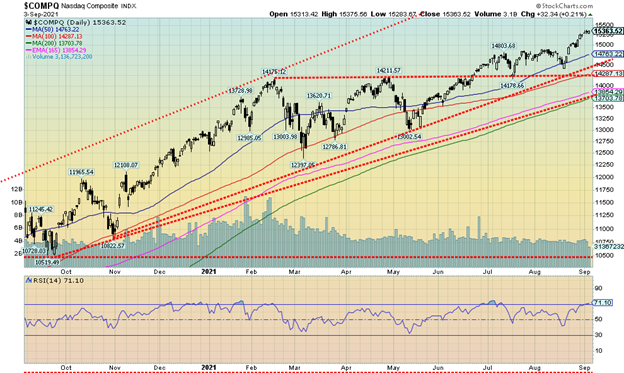
Once again, the NASDAQ made all-time highs this past week. We note, however, that the RSI is over 70 so it is now into nose-bleed territory and warning us of a pending pullback. Naturally, a pullback could be temporary and shallow. The NASDAQ number of stocks trading over the 200-day MA has been in a steady decline since February 2021. It currently is at 42.4% vs. 82.4% in February. That tells us that leadership is becoming narrower and narrower. The current divergence is more pronounced than the one seen in February 2020 before the March 2020 pandemic panic. The Bullish Percent Index is currently 56 vs 80 in February 2021. Again, this divergence is more pronounced than in February 2020. Breadth is also steadily falling, diverging with the price action. The NASDAQ gained 1.6% this past week. The FAANGs were mixed but mostly up. Facebook hit new highs, up 1.0% and so did Apple, up 3.9%. Netflix followed, up 5.6% as did Google, up 0.2%. The only other one making new all-time highs was Nvidia, up 0.9% on the week. Not making new highs but up was Amazon +3.9%, Microsoft +0.5%, Tesla +3.1%, Twitter +2.0%, Baidu +6.4%, and Alibaba +6.8% as the Chinese stocks continued to recover. All in all, a great week for the FAANGs but not so much for everybody else. Declining volume, declining breadth, declining bullish percent all indicate to us that a correction is coming. The question is, how steep, and when? Support is at 14,700, 14,500, and 13,900. Under 13,700 a bear market could get underway.
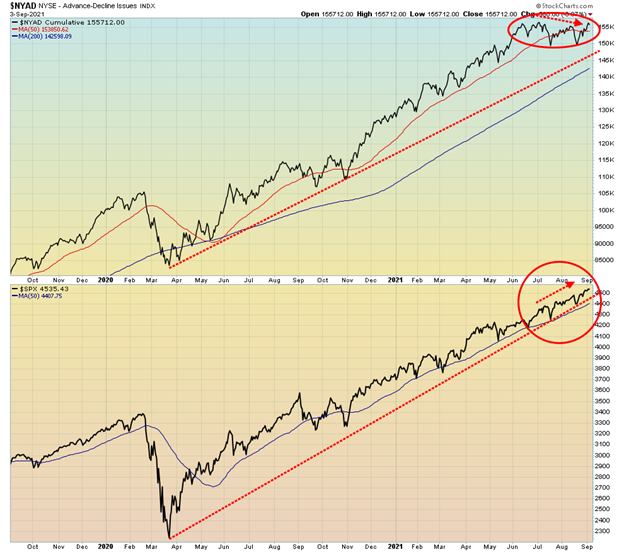
Despite an upward move in the NYSE advance-decline line this past week it still has not made a new high even as the S&P 500 did make new highs once again this past week. However, this one is getting close and new highs for AD line could once again confirm the new highs for the S&P 500. However, the divergence is often seen at important turn points where direction changes. In this case, it is signaling the next move should be down.
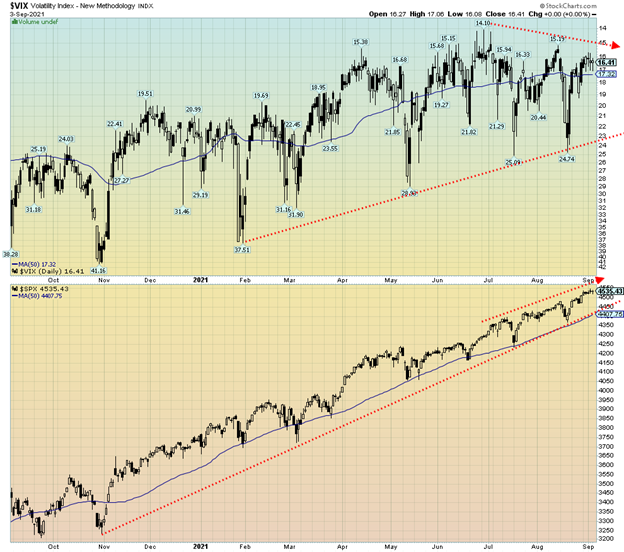
The VIX volatility index (inverted) and the S&P 500 are diverging. The VIX has been in a downtrend since June even as the S&P 500 continued to the upside. We are showing the inverted VIX as it shows the divergence better than the showing the regular VIX which moves opposite to the S&P 500. These divergences can persist for some time but they indicate that something is amiss and could be signaling a change in direction which in this case would turn the market down from up.
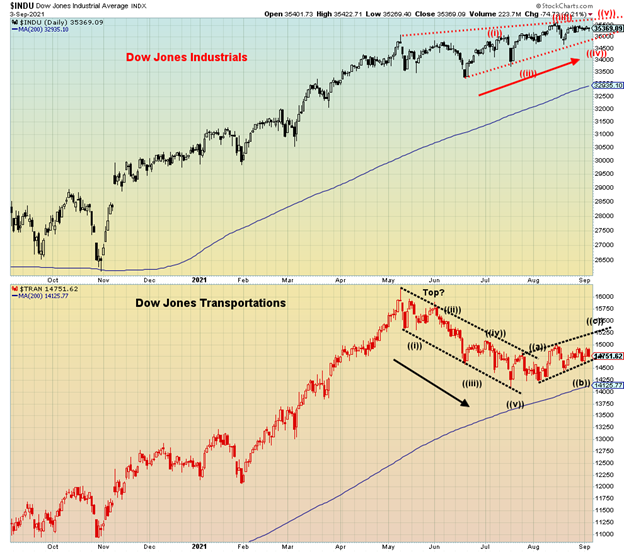
We have noted the growing Dow Theory divergence between the Dow Jones Industrials (DJI) and the Dow Jones Transportations (DJT). Dow Theory states that the averages must confirm each other. However, since May the DJI continued up but the DJT began to fall, regardless of what appears as a corrective rebound that got underway in July for the DJT. In the past, divergences between the DJI and the DJT have signalled major changes in direction so it is worth paying attention to. In this case the new direction would be down. We note as well that the DJI is now diverging from the S&P 500 and NASDAQ, although it is not as pronounced as the divergence between the DJI and the DJT.
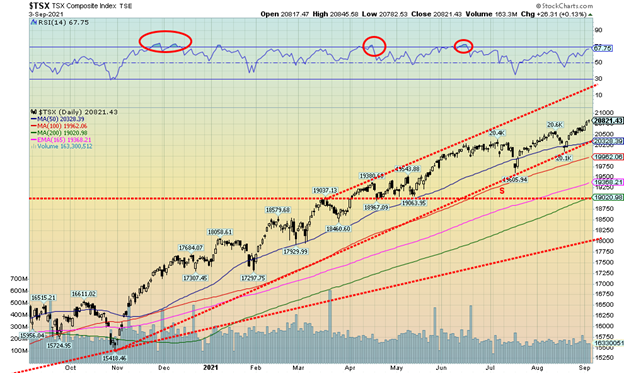
Once again, the TSX Composite soared to new highs, gaining 0.9% on the week. The TSX Venture Exchange (CDNX) had its best week since March 2021 as it gained 3.6%, pushing the CDNX once again up on the year by 5.5%. Eleven of the fourteen sub-indices were up on the week and six of them made all-time highs. The leader on the week was Industrials (TIN), up 4.3% and making new all-time highs. Others making all-time highs were Income Trusts (TCM) +0.6%, Consumer Staples (TCS) +0.2%, Real Estate (TRE) +1.1%, Information Technology (TKK) +2.6%, and Telecommunications (TTS) +0.5%. Losers were Financials (TFS) -1.1%, Metals & Mining (TGM) -0.7%, and Health Care (THC) -0.1%. The TSX continues to climb against the backdrop of diverging indicators and declining volume. The TSX Bullish Percent Index currently at 71 has been declining since peaking in April. As well, the number of stocks on the TSX trading over their 200-day MA has been declining since peaking last December 2020. This suggests to us that leadership is narrowing. The breakdown point is seen at 20,300. Long-term support is seen down to 19,000 with ultra long-term support at 18,000. While admittedly the TSX could keep rising, investors would be wise to not add at this stage and use rising stops. Golds appear to be coming out of its doldrums and could be a leader going forward.
U.S. 10-year Treasury Bond/Canadian 10-year Government Bond (CGB)
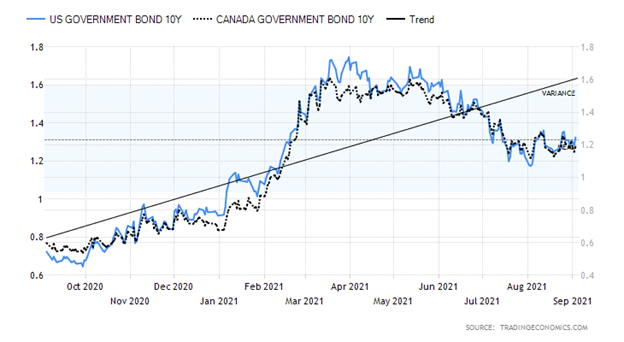
Bond yields waffled this past week following the jobs report. The yield on the U.S. 10-year treasury note rose slightly on the week to 1.32% from 1.31%. In Canada, the 10-year Government of Canada bond (CGB) dipped slightly to 1.19% from 1.20%. With the job numbers weaker than expected, the focus may now shift to other economic numbers as economists seek evidence that the economy is slowing. Taper plans could then be on hold. Economic numbers this past week included pending home sales that fell 8.5% year over year and down 1.8% in July. But home prices were rising as the Case-Shiller home price was up 19.1% year over year to July. The home price index was up 18.8% year over year to June. The August purchasing managers report (PMI) what we used to call the NAPALM came in at 66.8 vs. an expectation of 68 and last month’s 73.4. That’s still good but it has weakened a little. The consumer confidence index for August was 113.8 but they expected 124 and the previous month it was 125.1. The August ISM manufacturing was largely unchanged at 59.9 vs. 59.5 in July. Initial jobless claims were 340,000, down from last week’s 354,000. Factory orders for July were up 0.4% vs. June’s plus 1.5% and expectations of a rise of 0.3%.
In Canada, GDP growth for Q2 came in unexpectedly at negative 0.3%, well below the previous quarter’s gain of 1.4%. The market had expected a gain of 0.6%. Still, Canada is expected to record a GDP gain of 5.4% in 2021. However, that is out of the deep hole of 2020. Forecasts from some of 3% growth annually after that, are, based on previous history, a pipe dream. The decline in Q2 was sparked by slowing housing sales and a decline in exports. Supply chain disruptions are also playing a role. The decline in Q2 ended three consecutive quarters of gains.
Not a lot of numbers this coming week. Consumer credit is out on Wednesday, looking for a gain of $25 billion. Canada will be reporting its August job numbers next Friday. They are looking for a gain of 75,000 and the unemployment rate to fall to 7.3%. U.S. PPI is out next Friday as well looking for a gain of 0.6% in August and a gain of 6.6% year over year. The PPI may be the most anticipated number of the week.
Bond yields continue to waffle. A break below 1.20% or above 1.40% could change the scenario to down or up depending on the direction of the break. That’s why next Friday’s PPI number may be the one to watch.
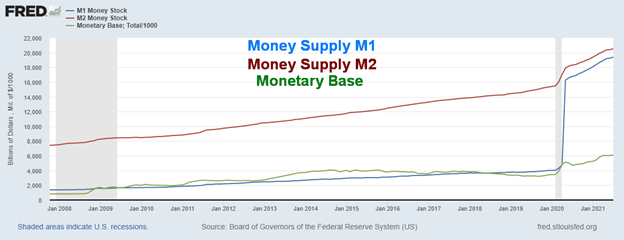
Once again, we highlight the massive monetary growth seen since the pandemic got underway in February/March 2020. M1 money supply is up an astounding 278% or $15.2 trillion. M2 money supply is up $4.9 trillion or about 32% and the monetary base is up $2.6 trillion or about 74%. The monetary base consists of currency in circulation plus balances held at the Fed. It has been the astounding growth in M1 that is mind-boggling. Given that all these indicators are essentially still rising, there appears to be little suggestion of tapering. They are rising because of QE4 with the Fed flooding the market with cash. Bizarrely, on the other side, the Fed has been conducting reverse repos to drain all the excess cash that has accumulated as a result of QE4. While QE4 is adding permanently to the monetary bases, reverse repos are temporary, usually only for overnight. Reverse repos totalling over $1 trillion every day have been ongoing since early August. But never have we ever seen anything like this and we struggle to explain it as a result.
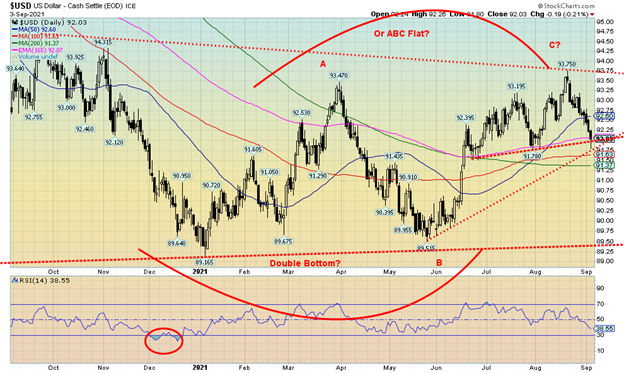
The US$ Index fell to its lowest level since July as Friday’s jobs report missed by a wide margin. The US$ Index appears to have found some support at a support line near 92 and a rising uptrend line from the May 2021 low near 89.50. A breakdown below 91.75 would suggest that a top is in at 93.75 and our contention that we are making an ABC flat correction wave is correct. Final support would be near 91.25 and once below that we can look at 90.25 and the last support zone before potentially making new lows below 89.50 and even 89.15. With the U.S. dollar down this past week the currencies rose. The euro was up 0.7%; however, the Swiss franc was off 0.3%, the pound sterling gained 0.7%, and the Japanese yen was up a small 0.1% despite the resignation of the prime minister. The Canadian dollar continued to benefit from the oil rally, gaining almost 0.9%. The US$ Index was down not only because of the weak jobs report but also uncertainty surrounding what the Fed will do next and thoughts that the recovery, such as it was, will now stall again. If the economy is really going ahead the Fed will consider tapering but if it stalls again then all bets are off. That in turn puts downward pressure on the US$ Index and is ultimately good for gold and commodities. A move back over 92.75 would signal that we are in the throes of an upward correction. A move over 93.25 would suggest the potential for new highs.
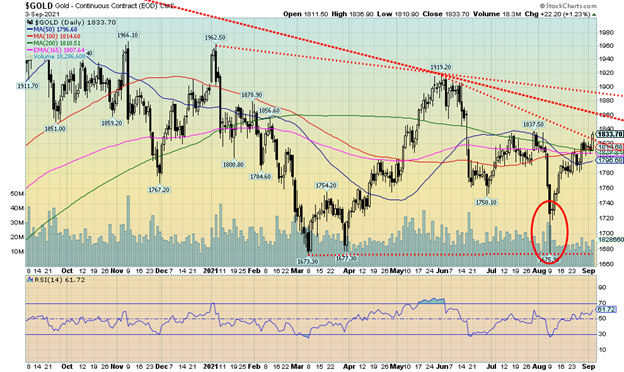
Gold leaped following Friday’s job report, gaining $22.20 or 1.2%. The weaker-than-expected jobs report allowed gold to gain 0.8% on the week. Otherwise, gold has closed the week with another small loss. Silver jumped 3.1% on the week, platinum was up 1.5%, palladium gained 0.3% while copper prices were up a small 0.1%. The jobs report eased concerns about the Fed tapering. Not only were the precious metals up on the week, but the base metals put in good gains as well. We saw a weaker U.S. dollar as the US$ Index fell 0.7%. A weaker dollar allows precious and base metals to revalue themselves upward as all are priced and traded (mostly) in U.S. dollars. The precious metals have suffered this year as the economy recovered from the pandemic. However, the jobs report is putting an explanation mark on the growing Delta variant and that the U.S. is once again leading the world in COVID cases. The U.S. has officially passed 40 million cases (12% of the population) and over 660,000 deaths. The bulk of cases and deaths now are happening in the unvaccinated, a group that is highly resistant to getting vaccinated and, in many cases, has been vocal and violent about it. Cases have been rising steadily in both Texas and Florida, two states that have large portions of the population unvaccinated and run by Republican governors and a congress that are resistant to vaccinations and mandates. As a result of the weak jobs report all eyes will be on upcoming economic numbers into October and the next FOMC meeting due on September 21–22.
Gold appears to have broken out over a resistance line near $1,820. Next up is the July high at $1,837. If gold can clear that level there is further resistance up to $1,860 and the downtrend line (the darker red line) that comes down from the August 2020 top. The final resistance line is up around $1,890 and the downtrend line from the December 2020 high of $1,962. However, only a break above $1,990 would tell us that the odds of new highs above $2,089 the August 2020 high are in the works. So there remains considerable work and resistance to overcome to achieve this. As a result, we are not complacent about the potential. We have noted that a rally that fails to make new highs above August 2020 at $2,089 could spell trouble and result in a gold crash. On the other hand, a solid break to new highs could imply a move towards potential targets up to $2,300. Continuing signs of a weak economy would weigh on the U.S. dollar and therefore benefit gold and the precious metals along with other commodities. Support now is $1,790/$1,800. A break under that level would be negative and a break below $1,775 could imply a fresh test of the lows near $1,675.
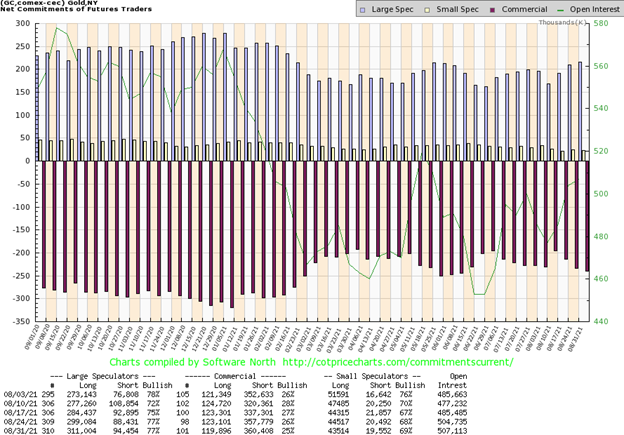
The gold commercial COT (bullion companies and banks) slipped to 25% this past week, down from 26% the previous week. Long open interest dropped about 3,000 contracts while short open interest rose about 3,000 contracts. For the large speculators (hedge funds, managed futures, etc.) their COT was unchanged at 77%. However, their long open interest jumped about 11,000 contracts while short open interest was up around 6,000 contracts. Overall open interest rose just under 3,000 contracts. However, the report only goes to August 31 and doesn’t capture Friday’s jump for gold following the jobs report. We have to view this report as mildly bearish.
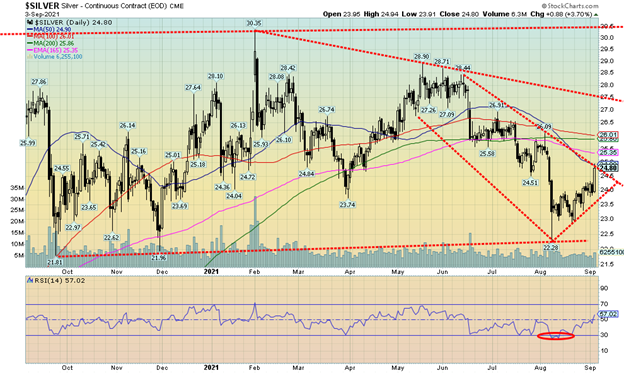
Silver leaped following the jobs report on Friday with a solid gain of 88 cents or 3.7%. That allowed silver to rise 3.1% on the week, turning what might have been a small down week into a solid gain. Silver is now just shy of next resistance at $25. Silver also appears to be on the cusp of breaking the downtrend in place since June. There then remains considerable resistance up to $26. The downtrend since the spike peak back in early February at $30.35 comes in around $27.50 so that would be another key resistance point. Above $28.50, the odds heavily increase that new highs above $30.35 would be seen. Silver has struggled and many are now claiming that silver has made a triple bottom at $21.81 last September, $21.96 in December 2020, and then $22.28 in August. A reminder, however, that triple bottoms are rare and are more likely to break to the downside rather than to the upside. The reverse is the case at triple tops. The reason is that silver could be forming a form of a descending triangle which is bearish, not bullish. That highlights why breaking all the key resistance points is meaningful even as they are no guarantee that we will see new highs above $30.35. So, it pays not be to be complacent about the potential for a triple bottom. The bigger picture suggests that silver has been forming the handle of a massive cup and handle pattern. That pattern suggests that if silver were to break and see new all-time highs above $50, then a run towards $100 becomes a possibility. Or it’s a pipe dream from the perma bulls, of which there are many. We’ll take it one step at a time. Getting through $27.50 would be a good start. In the interim there is work to be done. To the downside, we’d look for $24 to hold pullbacks. The drop-dead point is a break under $23, suggesting that new lows are ahead.
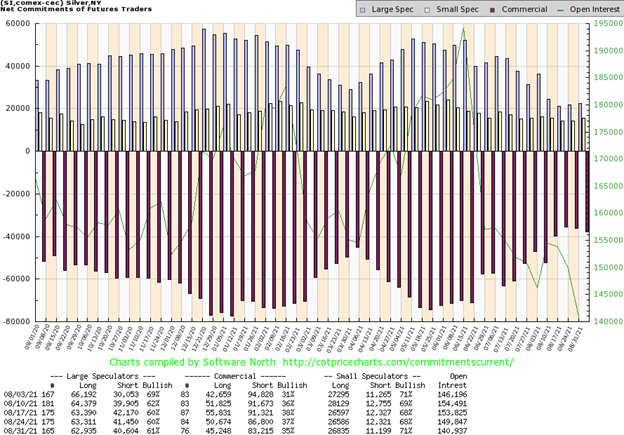
The silver commercial COT fell this past week to 35% from 37% the previous week. Long open interest fell over 5,000 contracts while short open interest dropped over 3,000 contracts. The large speculators COT rose slightly to 61% from 60% although they too saw a drop in open interest with longs down about 400 contracts and shorts down about 1,000 contracts. Overall open interest fell by around 9,000 contracts, suggesting to us that the declines were all short or long covering. Of bigger interest would be to see how it responds when silver breaks out and rises. This past week silver rose, but the biggest gain was on Friday following the jobs report.
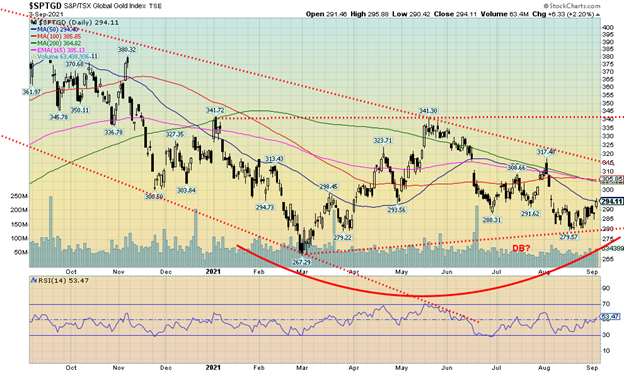
With the weaker than expected job numbers, the gold stocks found a bid on Friday and closed the week to the upside. The Gold Bugs Index (HUI) was up 1.4% while the TSX Gold Index (TGD) gained 1.1%. Without the gains on Friday the gold stocks were originally marginally down on the week. The TGD gapped higher on Friday and is now challenging the 50-day MA. The TGD also appears to be breaking away from a bottoming pattern. A firm close over 295 early this coming week could set us on our way to 305–315. A breakout over 315 would end the downtrend from the August 2020 high of 417. That could then set our sites on 340 and what may be a neckline of a potential double bottom for the TGD. Note the lows seen in early March 2021 at 267 and the most recent low of 279 in August 2021. If that is a double bottom with 340 as a neckline the potential target could be up to 415 and the August 2020 highs. What’s key now is that on any pullback 280 holds. That line would rise as we move higher. Indicators are moving higher and are currently around neutral levels. Not surprisingly, the short-term trend has turned neutral while the intermediate trend remains down but is weakening. The long-term trend never did turn down. We remain upbeat on the gold stocks. A move above 315 would be a significant event and turn us more bullish.
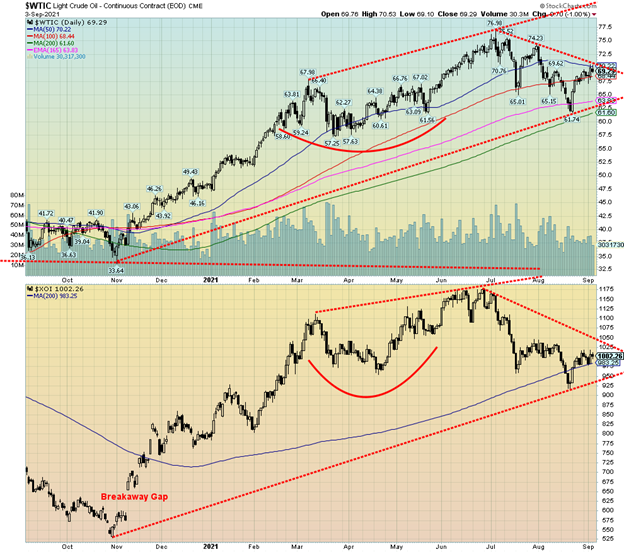
WTI oil managed to gain 0.8% this past week as Hurricane Ida pushed oil prices higher, but the weaker than expected jobs report on Friday pushed prices back down again. Hurricane Ida played havoc in the Gulf of Mexico and numerous oil and especially gas platforms were shut down and damaged. This gave a boost to natural gas (NG). Given the devastation, they, along with refineries along the coast, many of which were flooded, are not expected to open up again any time soon. Apparently, at least 1.7 million bpd are shut down. That suggests that there will likely be draws on the U.S. stockpiles.
NG leaped 7.3% this past week to fresh 52-week highs. NG has been on fire in 2021 up now 85.4% on the year. WTI oil appears to be on the cusp of breaking a small downtrend line this coming week. That line comes in around $70 along with the 50-day MA. A break above that level could set the stage for higher prices towards an earlier high near $74. If there is a fly in the ointment it is the energy stocks. The ARCA Oil & Gas Index (XOI) failed to respond this past week, down 0.8% although the TSX Energy Index (TEN) did rise 2.0%. The XOI would need to break above 1,050 to suggest that it is going higher. In the interim the XOI appears to have found support around the 200-day MA.
Oil prices are expected to remain at least elevated going forward, given some upward demand and ongoing supply issues as OPEC keeps a lid on supply, and damage from Hurricane Ida is not going to correct itself overnight. In the interim, another hurricane (Larry) is forming in the Atlantic. Its path is undetermined at this time but it could be headed for the islands and ultimately the coast of Florida.
—
(Featured image by Tuan Nguyen via Unsplash)
DISCLAIMER: This article was written by a third party contributor and does not reflect the opinion of Born2Invest, its management, staff or its associates. Please review our disclaimer for more information.
This article may include forward-looking statements. These forward-looking statements generally are identified by the words “believe,” “project,” “estimate,” “become,” “plan,” “will,” and similar expressions. These forward-looking statements involve known and unknown risks as well as uncertainties, including those discussed in the following cautionary statements and elsewhere in this article and on this site. Although the Company may believe that its expectations are based on reasonable assumptions, the actual results that the Company may achieve may differ materially from any forward-looking statements, which reflect the opinions of the management of the Company only as of the date hereof. Additionally, please make sure to read these important disclosures.
David Chapman is not a registered advisory service and is not an exempt market dealer (EMD) nor a licensed financial advisor. We do not and cannot give individualised market advice. David Chapman has worked in the financial industry for over 40 years including large financial corporations, banks, and investment dealers. The information in this newsletter is intended only for informational and educational purposes. It should not be considered a solicitation of an offer or sale of any security. Every effort is made to provide accurate and complete information. However, we cannot guarantee that there will be no errors. We make no claims, promises or guarantees about the accuracy, completeness, or adequacy of the contents of this commentary and expressly disclaim liability for errors and omissions in the contents of this commentary. David Chapman will always use his best efforts to ensure the accuracy and timeliness of all information. The reader assumes all risk when trading in securities and David Chapman advises consulting a licensed professional financial advisor before proceeding with any trade or idea presented in this newsletter. David Chapman may own shares in companies mentioned in this newsletter. We share our ideas and opinions for informational and educational purposes only and expect the reader to perform due diligence before considering a position in any security. That includes consulting with your own licensed professional financial advisor.


Skybound Entertainment Launches Crowdfunding Campaign to Create an Invincible Game
Skybound Entertainment launches a crowdfunding campaign on Republic to create a AAA game based on its Invincible comic. The campaign...


36% of Cannabis Users Report a Reduction in Alcohol Consumption
A Numerator survey found that 36% of cannabis users reported decreased alcohol intake since using cannabis products. Cannabis users, mainly...


Green Arms Raised Almost 1 Million in its Crowdfunding Round on CrowdFundMe
Green Arms, an innovative startup facilitating citizen and business participation in renewable energy projects, has nearly reached 1 million euros...


Vithas and MSD Join Forces to Train and Innovate in Oncology Matters
Vithas and MSD have formed an alliance to enhance patient care, especially in cancer treatment. The collaboration focuses on innovation,...


What You Can Do to Create an Online Store People Trust
Learn how to build trust in your online store with expert tips. From sleek website design to secure payment processing,...
 |
|
 |  |
 |
|
-

 Fintech2 weeks ago
Visa Innovation Program: 5 Italian Fintech Companies Selected for the Future of Payments
-

 Business7 days ago
TopRanked.io Weekly Affiliate Digest: What’s Hot in Affiliate Marketing [CamSoda Affiliate Program]
-

 Crypto1 week ago
Why the Problem with Failed Solana Transactions Is Growing
-

 Crowdfunding3 days ago
4fund.com, a Polish Crowdfunding Portal Which Has Raised 275 Million Enters the Italian Market