Featured
Ongoing trade war with China puts the US closer to a recession
The trade wars intensify and markets are taking notice. China and now Mexico are targets of Trump’s trade war. Retaliation is assured.

China and the U.S. are locked in a global struggle for who runs the world. Stock markets no doubt have more to fall and indicators are not suggesting a bottom.
All this puts us closer to a recession even as our closely watched recession watch indicator is still not signaling a recession. But some other spreads have gone negative. Debt is a problem everywhere but, particularly in Canada, it is a major problem mostly for households. See Chart of the Week.
Gold and the gold stocks jumped sharply but is our correction complete? We do have some mixed signals.
It’s June and soon to be summer. Hopefully, the floods subside but the wildfires are getting underway and raising havoc. Markets often find a bottom in June before a summer rally. Weakness in the early part of this coming week but a rebound by week’s end could occur.
The trade war continues
The U.S./China trade war continues to rattle markets. The U.S./China trade war is like the shark in Jaws. Just when you thought it was safe to go back into the water, along comes Trump (Quint) to threaten (raise tariffs) the shark (China) and, to no one’s surprise, the shark bites back. Or, was it because the shark was terrorizing everyone in the first place? Markets have acted accordingly and now sit on the brink of falling into a deep hole.
Ray Dalio, the billionaire founder of Bridgewater Associates, views the U.S./China conflict as more than a trade war. He calls it “an ideological conflict of comparable powers in a small world.” Everyone is left watching, wondering what will happen next. As technical analysts, all we can do is watch to see if significant levels are breached. This week the Dow Jones Industrials (DJI) fell below its 200-day MA and below a trendline that may have been the neckline of a head and shoulders topping pattern. The DJI last fell below its 200-day MA back in December 2018. A 20% drop followed. The possible head and shoulders pattern projects down to around 23,800, a 10.8% decline from the recent top in April. In breaking below its 200-day MA the DJI joined the Dow Jones Transportations (DJT) that had already fallen well under that key technical level. Both the S&P 500 and the NASDAQ sit on the cusp of a breakdown.
Dalio went on to point out that Trump’s move to cut off supplies to Huawei amounted to the weaponizing of export controls. He said that “such conflicts can easily slip beyond their control and become terrible wars.” Dalio may have a point. The ban on Huawei adds to the litany of threats that the U.S. is making against China. The U.S. has, according to editorial writer James Gibney writing for Bloomberg, intensified maritime operations to counter China’s territorial encroachments in the South China Sea, blasted China for its exploitative behavior in advancing the Belt and Road Initiative (BRI), imposed tariffs to force China to reverse its alleged unfair trade practices, blocked Chinese investments in the U.S., and increased support for Taiwan.
For some, it is a reminder of steps taken by the U.S. in 1941 to counter Japan with the freezing of investments and an effective embargo on oil that Japan depended upon for its economy and military. Earlier, the U.S. had restricted the use of aviation fuel and scrap iron (apparently Japan depended on U.S. scrap iron as it represented three-quarters of its scrap imports). They also embargoed machine tools. China, unlike Japan, has not invaded anyone. But that hasn’t stopped the accusations that for 30 years China has been taking advantage of the U.S. The U.S. alleges that, in China’s desire to dominate the global economy, especially high-end manufacturing, they stole intellectual property from U.S. companies.
But China hits back. China can find its hogs, wheat, and soybeans elsewhere. They have cut a deal with Russia and Brazil. They have placed tariffs on U.S. goods. They have increased their military presence in the South China Sea. And China is ramping up its threats to impose restrictions on rare earths exports. China produces some 90% of global rare earths. Rare earths have wide usage in telecommunications, electric vehicles, renewables, electronics, automobiles, and, probably most important, military and defense usage. While the U.S. can source supplies of rare earths by simply finding more, that takes time. Restarting existing mines takes months. Building new processing plants takes years. The U.S. gets 80% of its rare earths from China. It is estimated that replacing China’s supply could take over a decade. We note that rare earth stocks have started to rise.
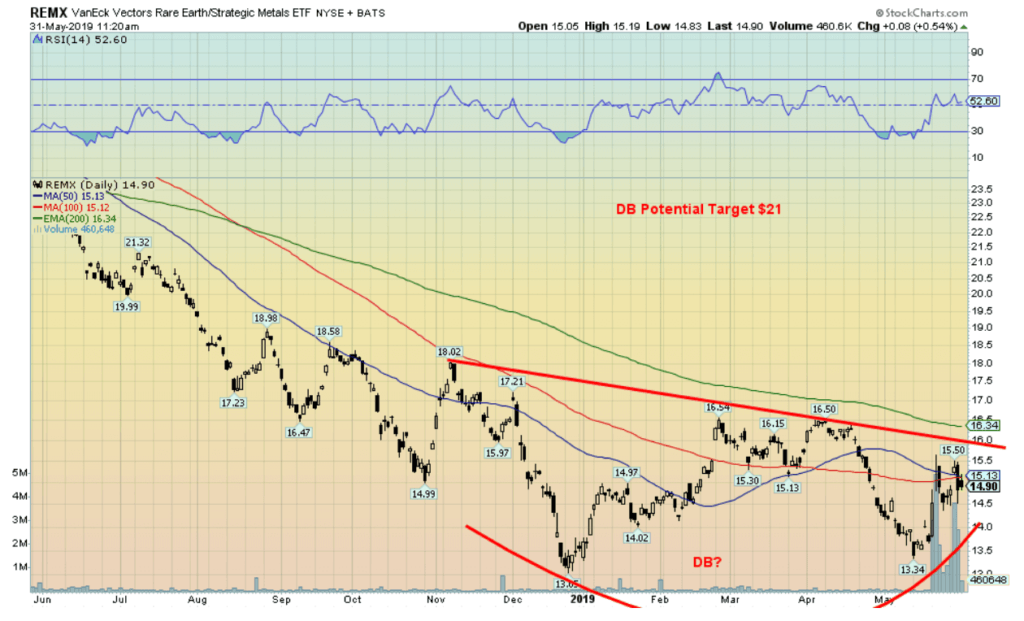
The VanEck Rare Earths Strategic Metals ETF (REMX-NYSE) has jumped recently and may be forming a double bottom. Its neckline is up at $16 and could on a breakout project up to $21. The double bottom scenario breaks down if REMX falls back under $13.34. REMX contains 20 companies that specialize in rare earths/strategic metals and they are primarily listed on the Shanghai Exchange (SSEC).
One of the prime areas where China could hit is U.S. corporations operating in China. Almost 20% of Apple’s (AAPL) sales are in China. All told, U.S. companies have some $158 billion in investments in China. Apple’s share of sales is not even that significant, compared with other companies. Qualcomm (QCOM) share of sales in China is 65%, Micron Technology (MU) 51%, Broadcom (AVGO) 54%, and Skyworks Solutions (SWKS) 83%. Other well-known names with a significant presence in China include Starbucks (SBUX), Nike (NKE), Intel (INTC), and Boeing (BA). Google (Alphabet) (GOOG) shut its search engine in China while Amazon (AMZN) has a website presence only. Major Chinese companies such as Baidu (BIDU), Alibaba (BABA), and Ctrip.com (CTRP) have little or no competition in China because the Chinese government protects them. American companies operating in China are already saying the trade war is hurting their business.
China and the U.S. are at war. No, not the conventional kind of war, but it is a war nonetheless. And it is difficult to predict where it will go and how it will impact stock markets. The reality is, this is not just about tariffs—it is about who is the world’s global power. It is a fight over control of critical resources and global supply chains. Tariffs are a sideshow, and contrary to Trump’s declarations that China will pay for them it is the U.S. consumer who will pay for them. Even Walmart has said it will pass on the cost.
All of this is playing out against a backdrop of the lowest unemployment in 50 years, record low-interest rates despite the recent hikes, and a U.S. economy that, if it is not exactly humming along, is at least stumbling along. Still, the risks are out there. Besides the U.S./China trade war, there is also an ongoing battle to ratify NAFTA (the old NAFTA stays in place as long as the revised one isn’t passed), threats of tariffs on European cars, ongoing Russian and Iran sanctions that increase tensions along the Russian border and in the Persian Gulf, and the ongoing conflicts in the Mid-East in Syria and between Israel and the Palestinians.
It is noteworthy that Trump is now slapping tariffs on Mexico, putting the revised NAFTA (USMCA deal) in danger. U.S. firms have considerable production in Mexico. The U.S. also imports food products from Mexico. Slapping tariffs on Mexico opens up a new danger to the U.S. and global economy. The stock market fell in sympathy. Bond yields also fell further and oil prices were hit hard. But gold rose. Trump is tying the tariffs to the alleged “illegal immigration crisis.” If Mexico fails to alleviate the crisis, the tariffs will rise again to eventually 25%. Mexico is expected to counter these tariffs with their own. One wonders if Trump decides to hit Canada as well.
There is also the threat of a constitutional crisis in the U.S., the start of impeachment proceedings against President Trump, and the potential for a serious debt crisis. Country debt crises are most at risk in Turkey, Argentina. The IMF has had to make loans to Argentina to keep them afloat. China’s real estate market is a potential debt crisis. One difference, however, is that China has the wherewithal to bail them out. In the Eurozone, the concern is with Italian banks in particular but also numerous others. Germany’s Deutsche Bank is considered to be a debt crisis waiting to happen. As well, consumer debt remains abnormally high in Western countries, particularly in Canada (see Chart of the Week).
There is always the threat of a black swan (usually defined as an unusual or unexpected event). Most analysts believe a black swan event can’t happen—that is, until it does. Over the past 50 years we have had unexpected events: the collapse of Penn Central in 1970, the Arab oil embargo in 1973–1974, the huge inflation of 1977–1980, the Latin America debt crisis of 1982–1985, the stock market crash of October 19, 1987, the Savings and Loans crisis of 1988–1992, the Mexican tequila crisis in 1994, the Asian financial crisis in 1997, the Russian/Long Term Capital Management (LTCM) crisis in 1998, the dot.com crash of 2000–2002 and the Lehman Brothers collapse in 2008. Who says that a black swan can’t happen? Since 1970 we have had one roughly every five years. We are overdue. Will trade wars become the black swan that topples the markets and plunges the world into recession or worse?
Markets and trends
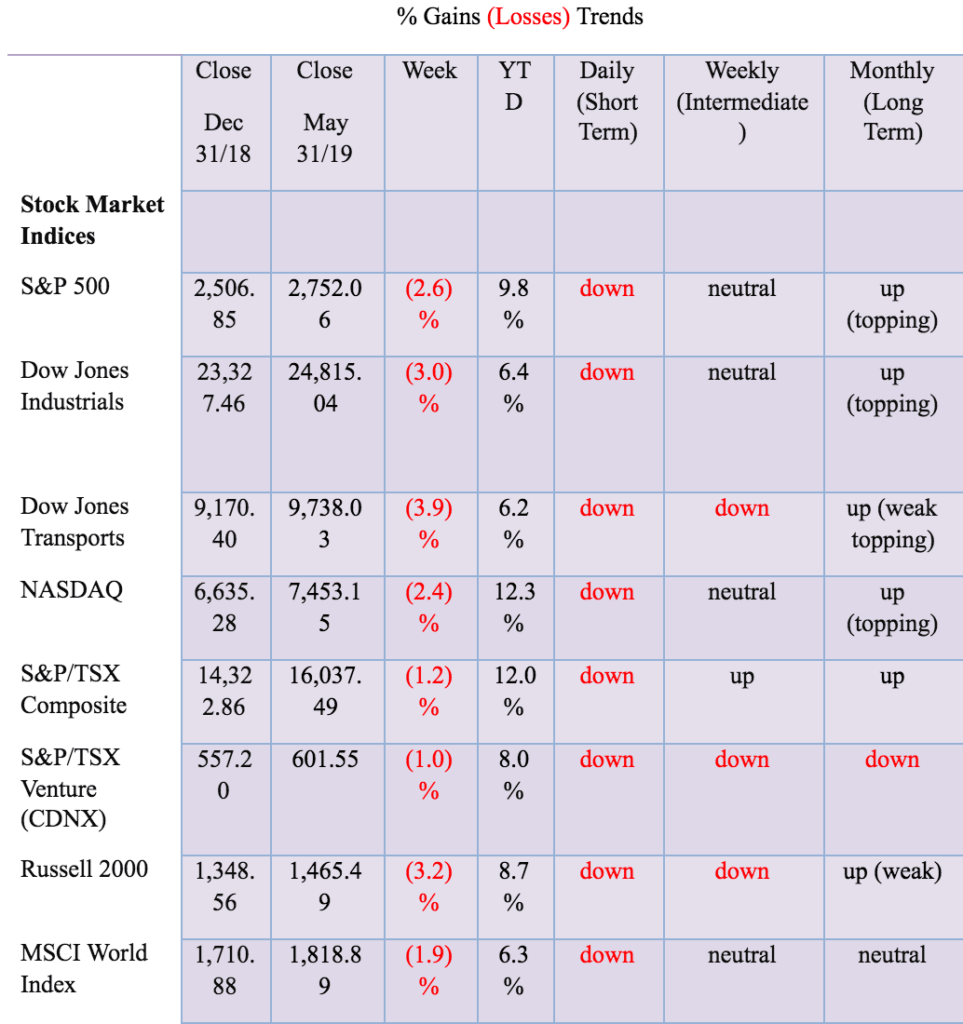

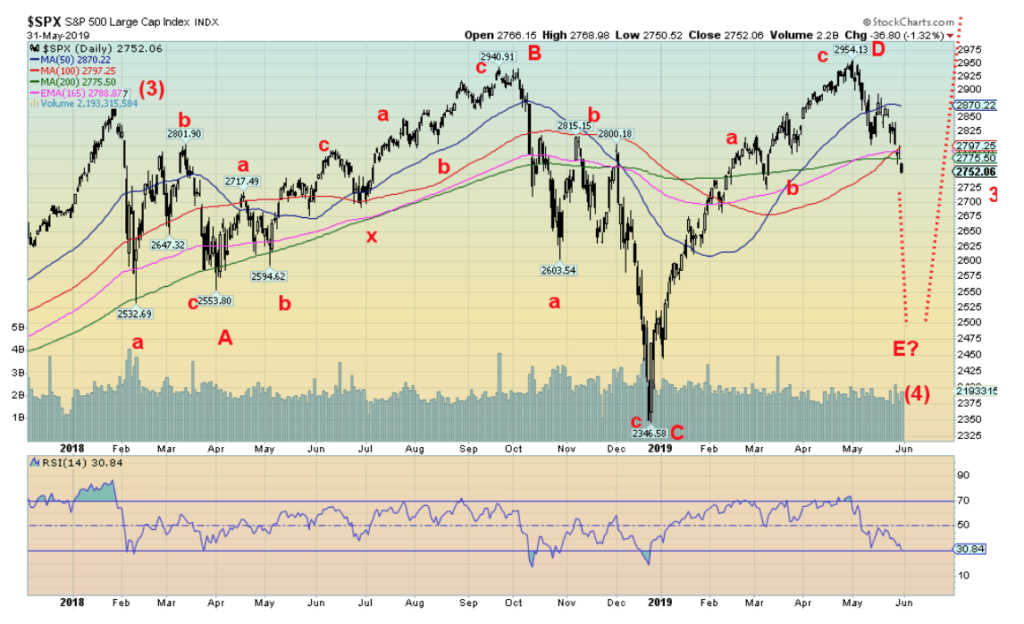
It was not a good week for the U.S. stock markets. The ongoing trade war between China and the U.S., followed now by Trump slapping tariffs on Mexico over immigration, has sent the markets into a downspin. That China reported some disappointing economic numbers this week didn’t help. The S&P 500, after appearing to find support at the 200-day MA, plunged through it on Friday, May 31. It ended a rather miserable month that saw the index lose 6.6%, its worst performance since December 2018. Sell in May, and go away? Seems that way. The S&P 500 fell 2.6% this past week while the Dow Jones Industrials (DJI) dropped 3.0% and the Dow Jones Transportations (DJT) fell 3.9%. The NASDAQ was down 2.4%. The small-cap Russell 2000 dropped 3.2%.
Overseas markets didn’t fare much better. The London FTSE, pressured by Brexit, fell 1.7%, the Paris CAC 40 was off 1.3%, and the German DAX was hit harder, losing 2.4%. Noteworthy was Deutsche Bank (DB) falling to multi-year lows at $6.77. Many continue to believe that Deutsche Bank is a time bomb waiting to go off. They are right. If it did, it would make Lehman Brothers seem like a picnic. In Asia, the Tokyo Nikkei Dow (TKN) fell 1.0% but the Shanghai Exchange (SSEC) defied the declines elsewhere and the negative China news, rising 1.6%. Maybe they believe that Chinese companies will benefit from the trade war and the Chinese government will, as they have in the past, ride to the rescue. Certainly, Chinese threats to hurt U.S. companies would favor Chinese companies.
With the S&P 500 dropping below its 200-day MA, our suspicion is that the index is in the process of making the E wave of a larger ABCDE wave that got underway back in January 2018. Notably, that marked the beginning of the current trade wars and tariffs. But these things can change on a dime or whim of the President. Unfortunately, trying to say it will when the President himself is an unknown makes it difficult to predict where and how far we might fall. E waves tend to be shorter so that suggests this one should not be as steep as the October/December 2018 collapse.
Once it is complete the market should begin another assault on the highs. There is a silver lining, after all. June is not known as a particularly robust month, ranking number 11 for the DJI and number 10 for the S&P 500 but only number 9 for the NASDAQ. But it is a month that often sees lows and then the start of a summer rally that carries into July/August and even September before topping. Portfolio pumping occurs for the end of the quarter and half year in June. Sentiment is not yet at levels that suggest a low. We’d be surprised here that the drop so far acts merely as a hook that takes us to new highs as some have suggested.
If the S&P 500 can regain 2,800 then it could make another test of 2,900. A decline under 2,750 and especially under 2,700 suggests further declines towards 2,600. We have some targets down there at 2,650 +/- 50 points. We certainly need further declines to get the market closer to pessimistic levels.
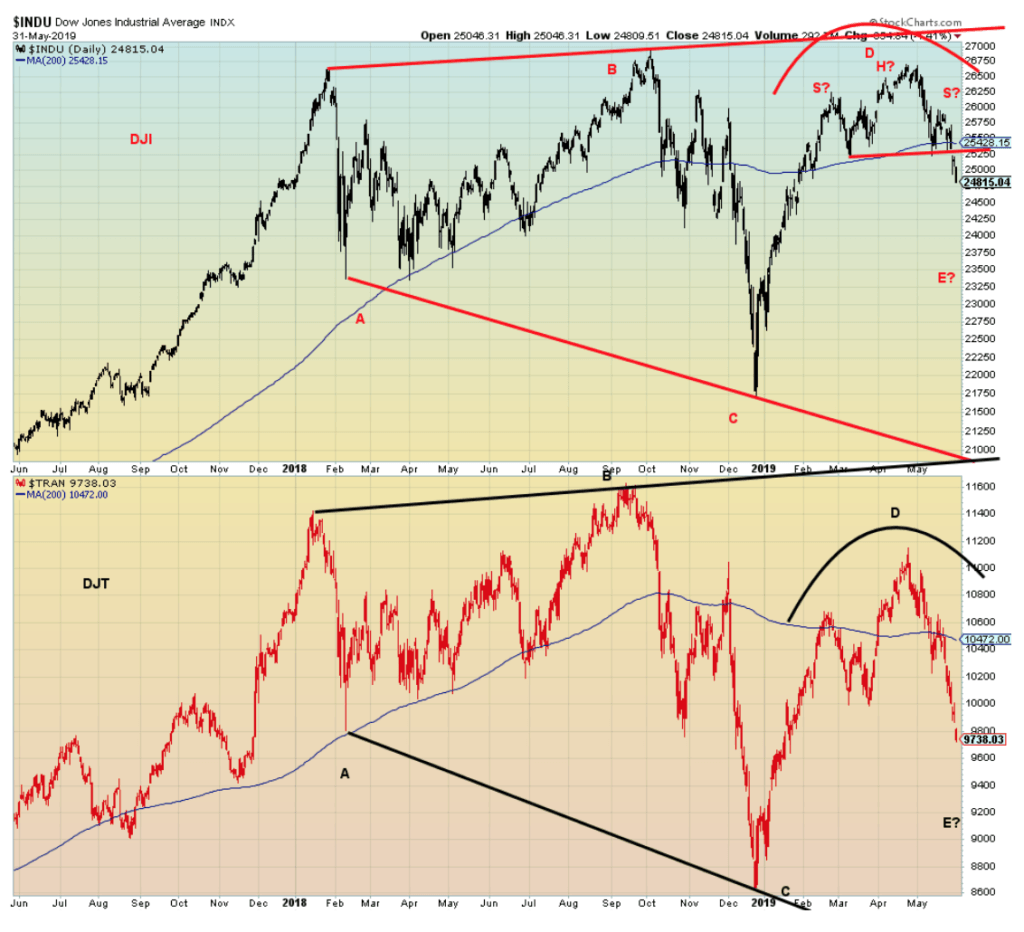
Both the DJI and the DJT have fallen under their 200-day MA, suggesting both have entered bear markets. However, the DJT is the only index where the intermediate trend has turned down. The others are clinging to neutral but another down week could turn them down as well. The DJI continues to look as if it made a head and shoulders top. Its target is down to 23,750. The DJT made a possible awkward H&S top. If correct, it projects down to 9,135. Look for further weakness early this coming week, but the market may attempt a rebound by the week’s end.
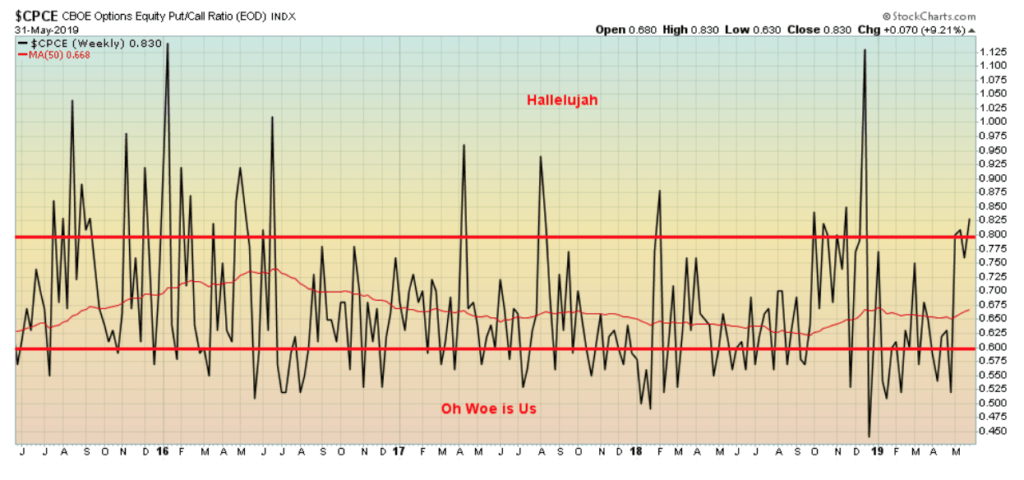
The CBOE options equity put/call ratio is, oddly, still in “Hallelujah” territory, suggesting the market remains too bullish. That bodes poorly for the market which is more likely to fall than to rise right now. In “Hallelujah” territory buyers are holding more calls than puts. We want the market in “oh, woe is us” territory with puts exceeding calls to suggest a bottom in the market.
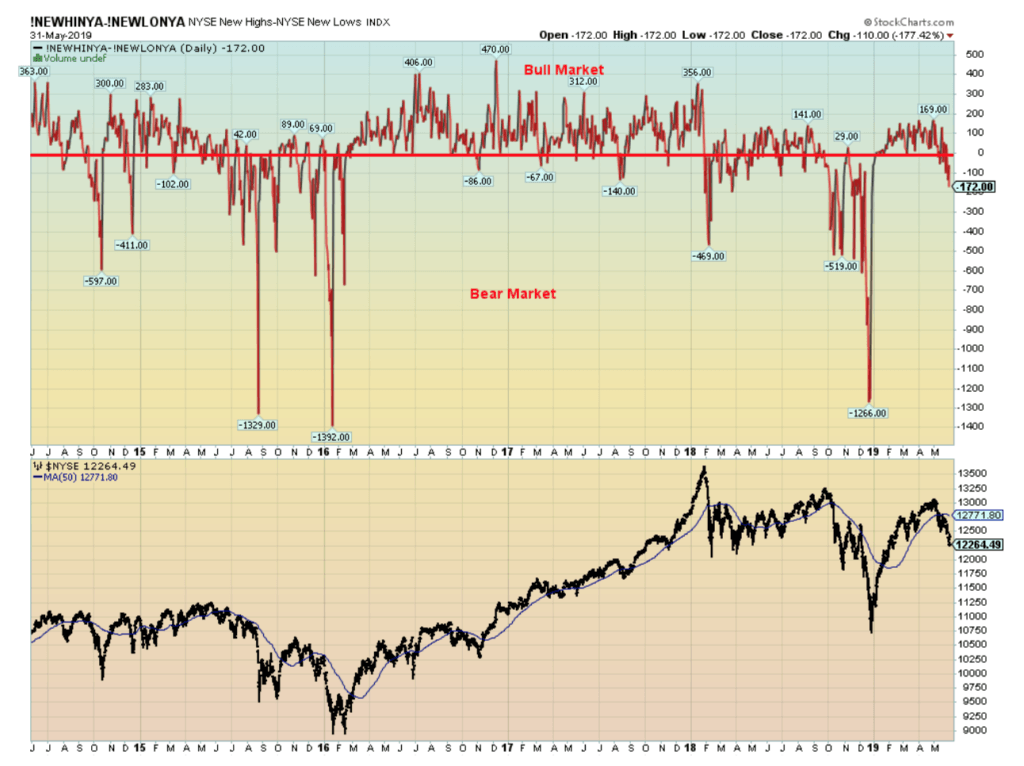
The NYSE new highs less new lows index has fallen into bear territory. It is not, however, at levels that might suggest a low. If we can get it down to at least -500, then we might begin to believe that a low could be at hand.
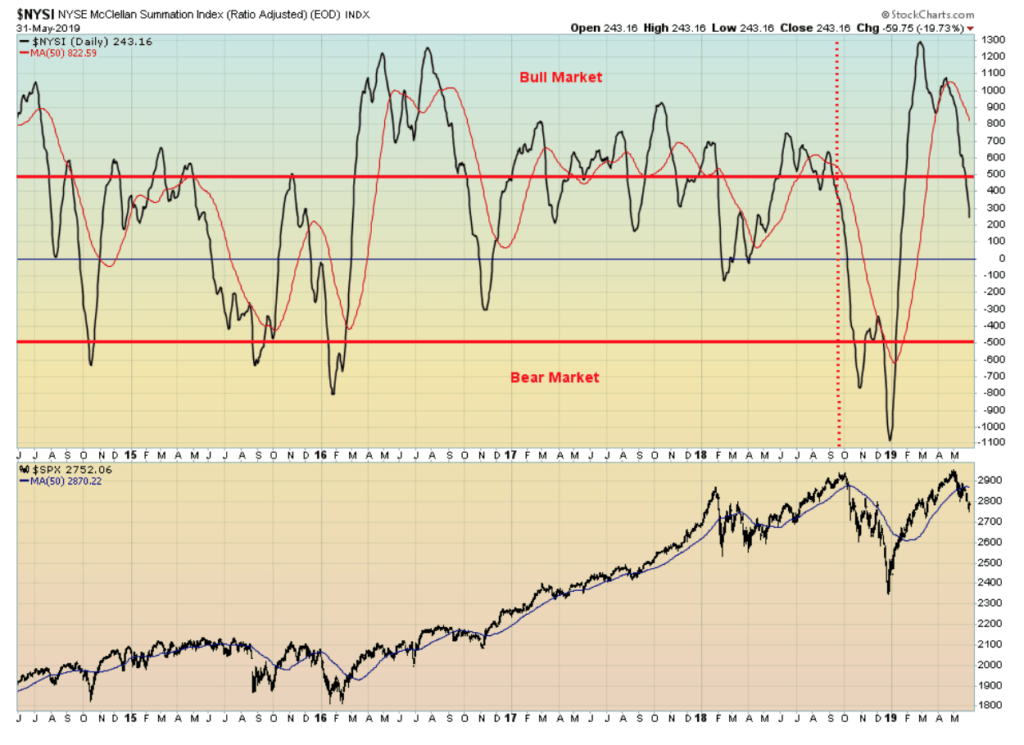
The McLellan Summation Index (ratio adjusted), known as the RASI, has now fallen below 500. That too is not yet in bear market territory under -500. However, as history shows, there can be hooks in this territory that sees it move right back up over 500 once again. We’d prefer to see it in bear territory to think about a low.
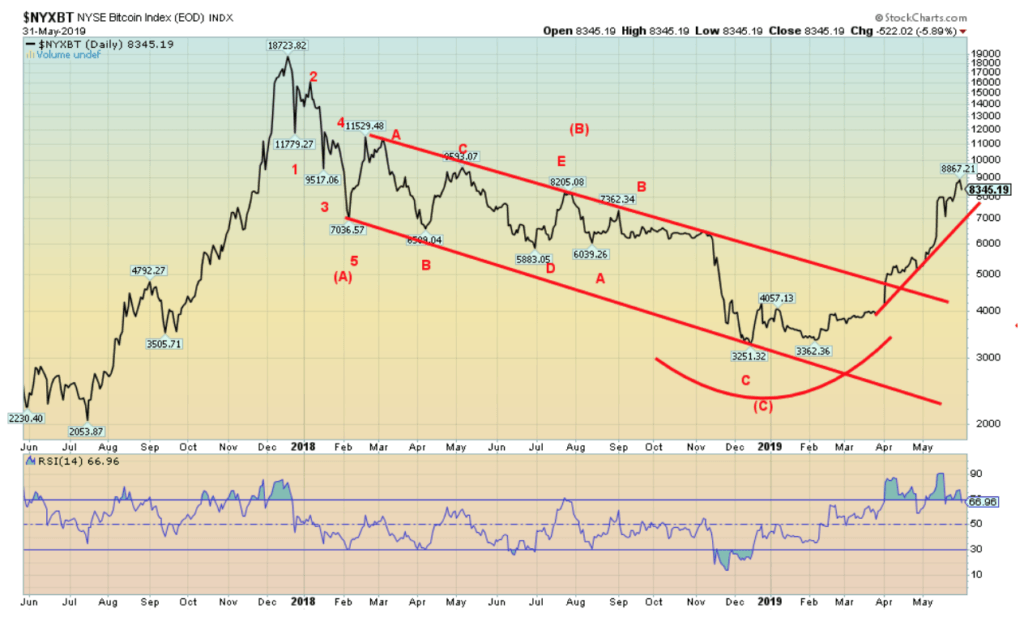
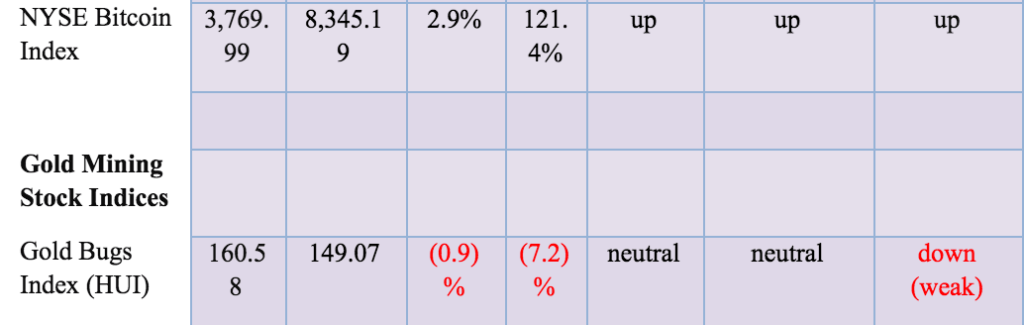
Bitcoin continues to dazzle with a run this past week towards $9,000. But volatility remains the name of the game as Bitcoin reversed once again and fell to $8,300. We continue to try and work off some of the excesses but the trend remains firmly to the upside. Many are touting this pullback as a buying opportunity. Given the powerful uptrend underway there is no way to counter that argument. At one point, Bitcoin traded over $9,000 before reversing and closing lower. We read a story that rumors and fake news helped propel Bitcoin to $9,000. It is yet another recognition that the cryptocurrency market remains the “wild west” and is not for the faint of heart. Indeed, it seems to be dominated by speculators. Maybe, in the end, it really does prove to be no different than tulips, beanie babies and cabbage patch dolls. It’s no surprise many people view this pullback as another buying opportunity.
The market cap of all the cryptos is $272.3 billion with Bitcoin representing $152.2 billion of that or 55.9%. There are 2,216 cryptos listed at Coin Market Cap and there are 16 cryptos with a market cap over $1 billion. The mania continues. Lots of support down to $7,000. Under $7,000 further declines are probable. Above that, the sky is the limit.
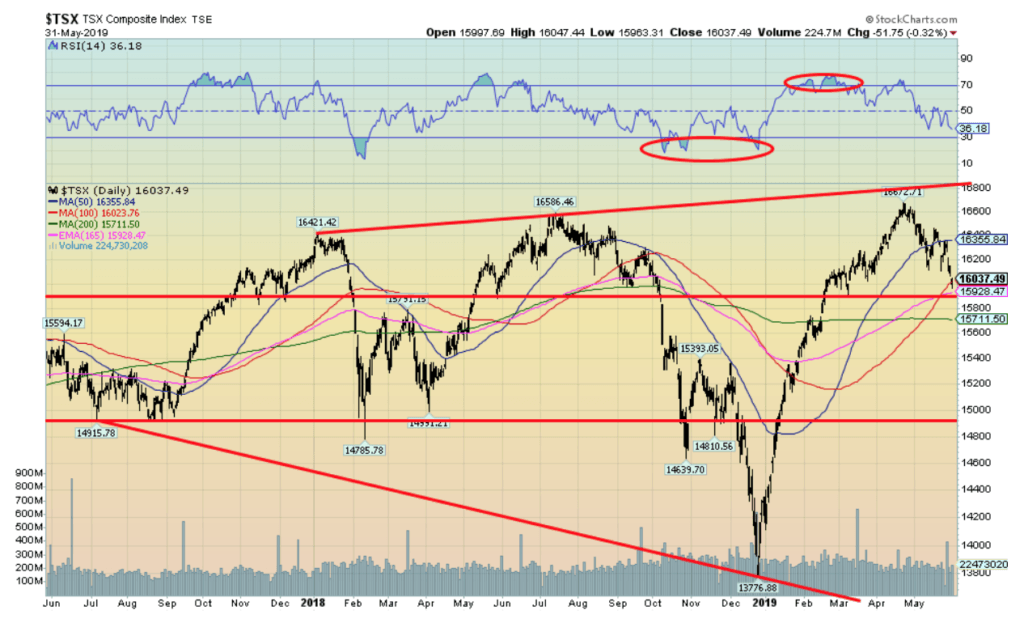
The TSX Composite continues to outperform the U.S. indices. This past week the TSX Composite fell only 1.2% compared to the 2% plus most U.S. indices lost. Probably helping it are the Gold, Materials, and Metals & Mining indices that were up 6.1%, 3.6%, and 1.4% respectively. Utilities gained a small 0.2%. All others were to the downside led by Health Care, off 7.9%, and followed by Consumer Discretionary, down 3.3%. Overall, it is difficult to say the TSX has made its final top. Support lies below, just under 16,000.
But a firm breakdown under 15,900 and especially under 15,700 could suggest a decline to 15,000. Indicators are not yet deeply oversold as they were during earlier declines. Like the U.S. indices, we could make an argument that the TSX is making some sort of broad ABCDE-type pattern starting with the top back in January 2018.
As a result, we have an A wave down (bottom in February 2018), a B wave up (top in July 2018), the C wave down (bottom in December 2018), and the D wave up (recent high in April). To come is the E wave down, which we may now be working on. Following an E wave decline, the TSX should then once again make another run for new all-time highs. A very whipsaw market to keep everyone guessing.
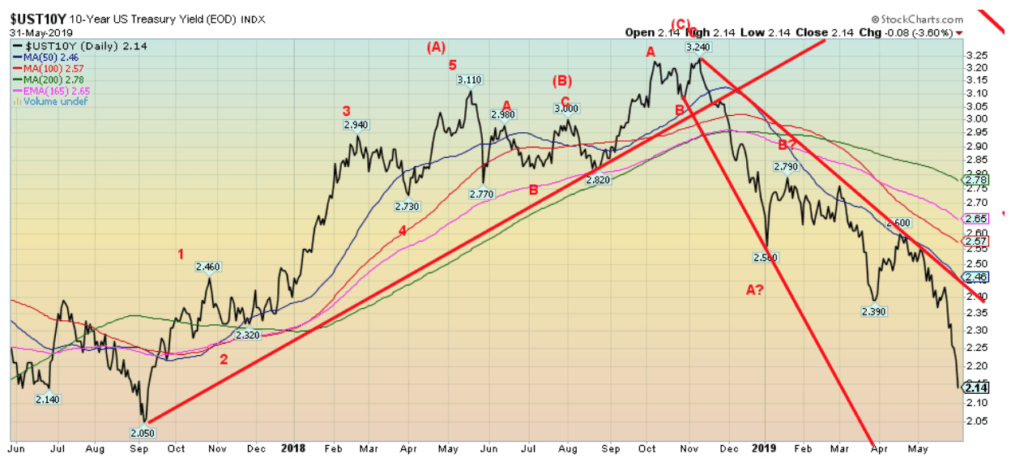
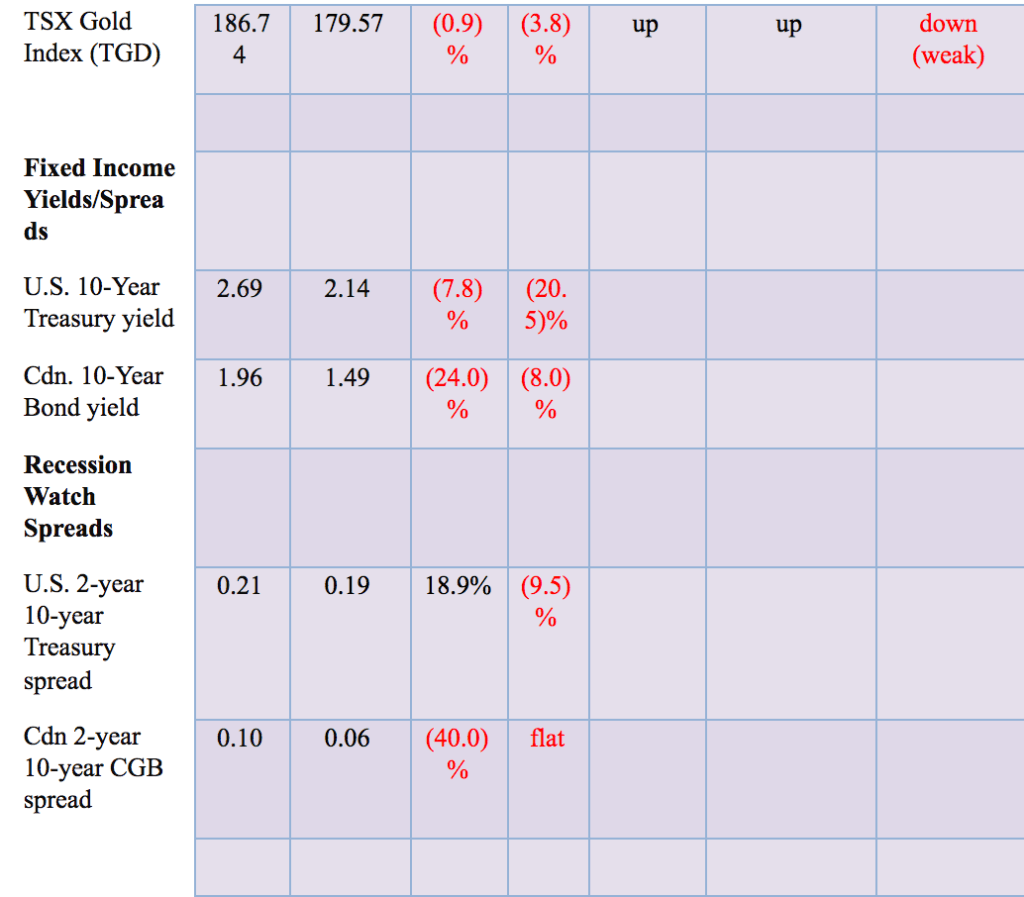
Bond yields fell sharply this week following the imposition of tariffs on Mexico. The expectation is that these tariffs are negative not only for the U.S. economy but for the global economy as well. The 10-year U.S. Treasury note fell to 2.14% this past week, down from 2.32% the previous week. In Canada, the 10-year also fell, this time down to 1.49% from 1.62%. Yields everywhere have been falling. The 10-year Japanese Government Bonds (JGBs) are down to negative 10 bp while the 10-year German Bund has fallen to negative 21 bp. Yes, negative.
All that lies below now for the 10-year U.S. is the 2.05% low of September 2017. The all-time low was seen in July 2016 at 1.37%. No matter how one cuts it, interest rates remain at historical lows. Despite cries from Trump for the Fed to cut interest rates, these are already low. Okay, they have been lower. But nobody is served by low-interest rates like this. Mortgage rates have fallen along with the drop in the 10-year.
Low-interest rates hurt savers and encourage irrational borrowing in an already debt-laden world. They borrow expecting that interest rates will stay low forever. They could be right. But what if they rise to levels where they are now too high? We have not hit that point. Nonetheless, we are once again at a sentiment extreme so it is possible we are near a short-term trough.
Recession watch spread
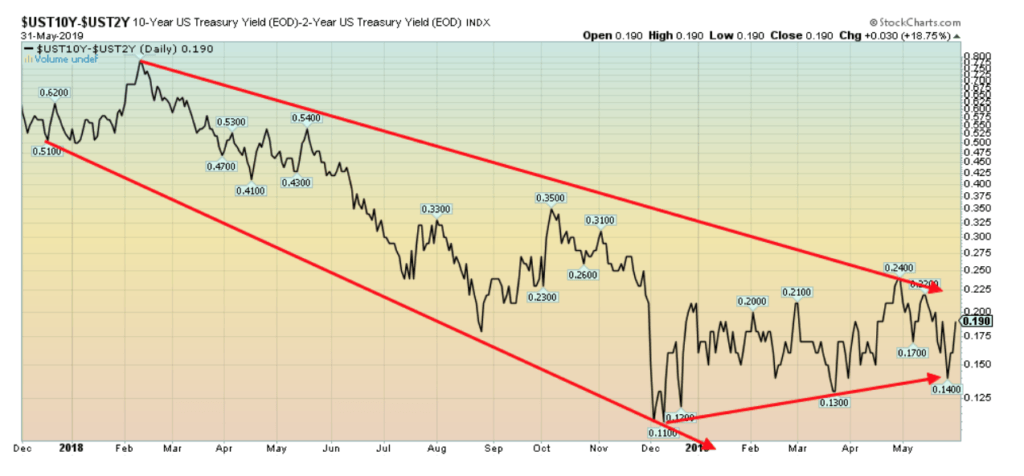
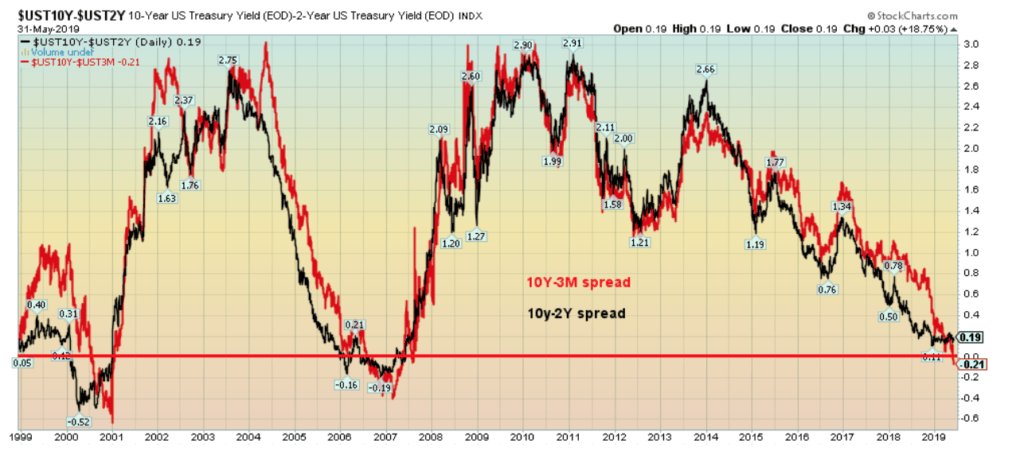
The closely watched 2-year U.S. Treasury note less the 10-year U.S. Treasury note rose to 19 bp this past week, up from 16 bp the previous week. So far, this spread is not indicating an impending recession despite all the negative background noise. Our chart below shows the 2–10 spread with the 3M-10 spread. The latter has turned negative. The 10-year—3-month spread is a negative 21 bp while the 3-month Fed funds spread is a positive 1 bp. The 2-year Fed funds spread is negative 9 bp. In previous recessions, the 2–10 spread tended to turn negative first before the 3-month—10-year spread.
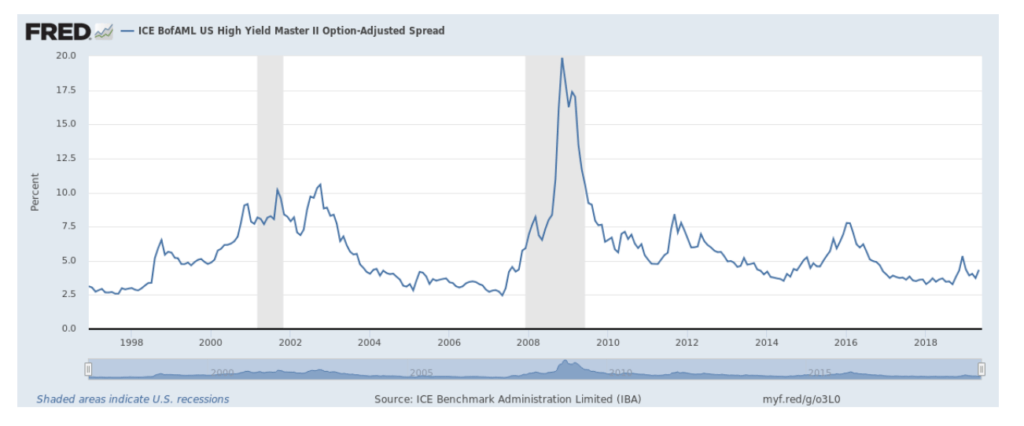
Along with watching the treasury spreads, we also keep an eye on high-yield spreads. The high-yield option-adjusted spread above is only at 4.33%. That remains below recent highs at 5.33% seen in December 2018. It is well off the highs of November 2008 at the height of the Lehman Brothers financial panic. At that time, it reached 19.88%. It was also higher in 2011 during the euro/Greek crisis and in 2016 following the end of QE. At this point, the high-yield spread is not suggesting any impending recession. However, note that it has started to creep higher.
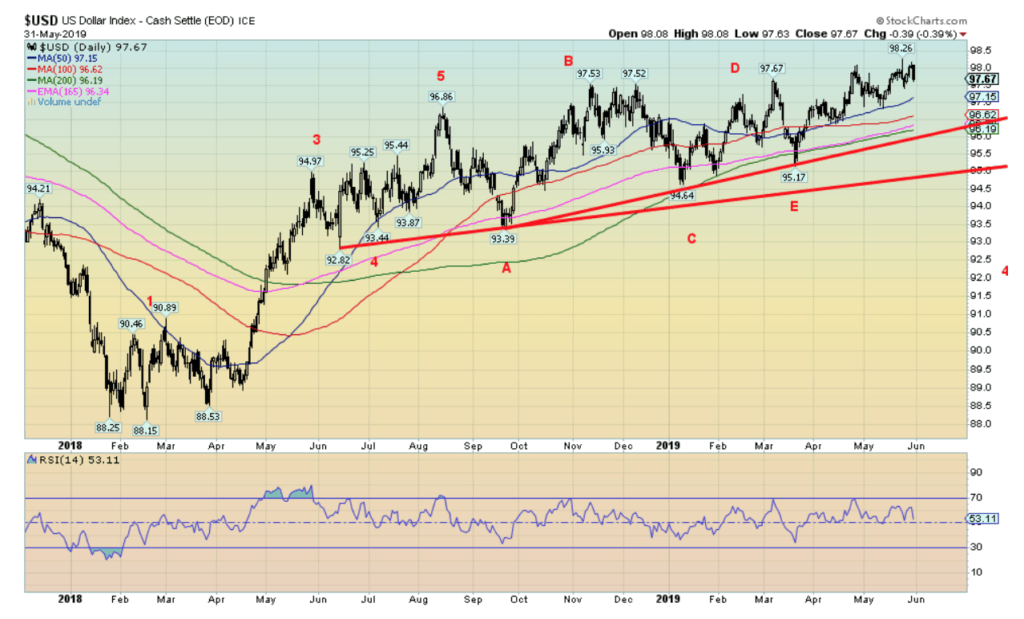
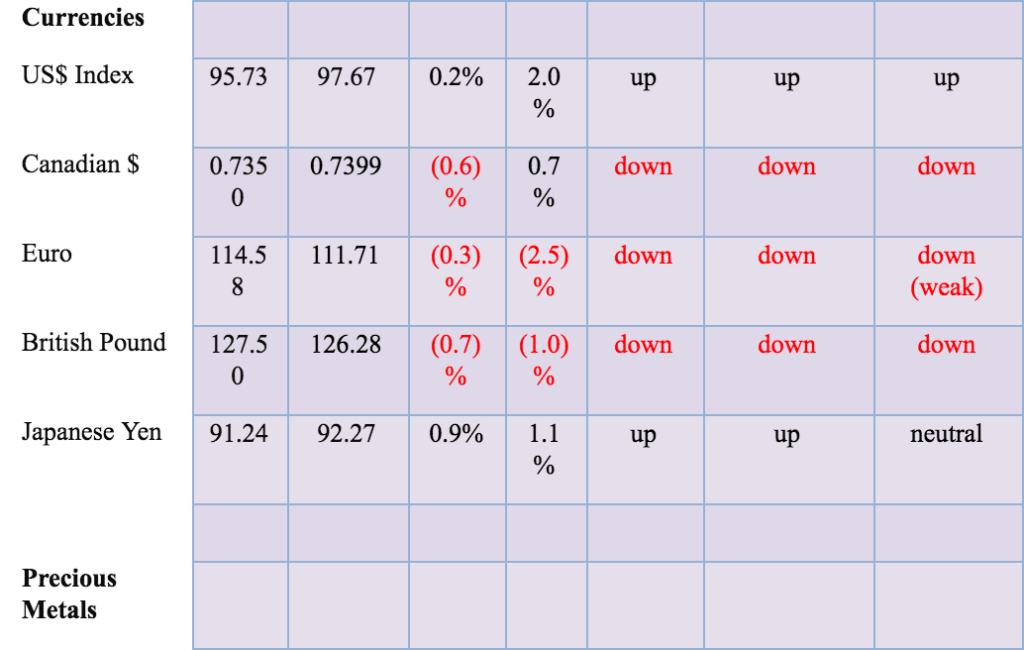
The US$ Index made a high this past week at 98.19, then once again reversed to the downside on Friday following the announcement that Trump was placing tariffs on Mexico. Weak economic data from China helped the US$ Index to rise earlier in the week. Nonetheless, the US$ Index managed to close higher on the week, gaining 0.2%. The Cdn$ fell 0.6% and the euro—struggling with Brexit and with Eurosceptic parties making considerable gains in the recent elections—lost 0.3%.
The pound sterling fell even further, off 0.7%. The Japanese yen was the major beneficiary of all the turmoil elsewhere, gaining almost 0.9%. We are not sure that the recent rise in the US$ Index is over yet. A break below 97.15 would help convince us it is possible. As we note, Trump’s propensity to threaten and then even back off means that we could quickly see the US$ Index return to the upside. A more significant breakdown exists down at 96.20 and under 95 the decline should become terminal.
Meanwhile, targets up to 101.50 to 102 remain unfulfilled and thus still a possibility. New highs above 98.26 would put us on our way. In looking at the commercial COT for the euro, we note that it is currently at 57%, one of the highest in months. That suggests that the commercials are gearing their books to take advantage of a coming rise in the euro and a fall in the U.S. dollar.
That it hasn’t happened yet doesn’t mean it won’t happen. The pattern on the current rise on the US$ Index is quite a zig-zag. These type of zig-zags often take the form of an abcxabc. If correct, then it is possible the abcx is complete. We have had an A wave rise and we are now working on the B. The C is to come.
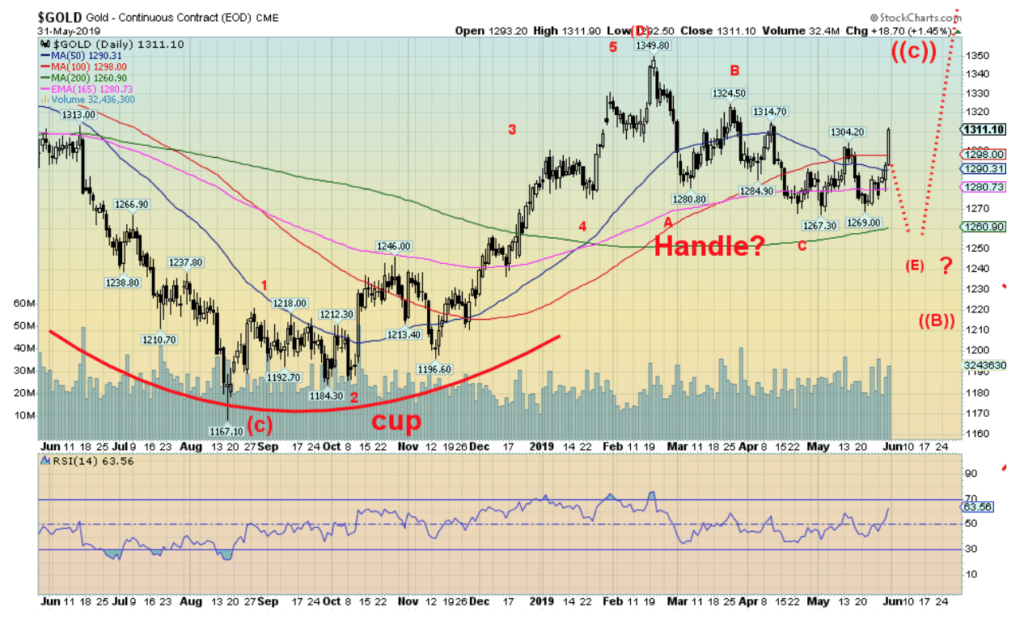
Gold prices exploded to the upside on Friday, May 31, 2019, following the announcement that Trump was slapping tariffs on Mexico. Gold prices rose along with the stock market, but bond yields and oil prices fell. The question now is, have gold prices bottomed? On the surface that appears to be the case. We caution, however, that silver prices, that normally lead these rallies, lagged significantly.
While gold rose 2.1% this past week, silver prices were up only 0.1%. Platinum fared worse, falling 1.1% while palladium rose 0.6%. Copper suffered along with other industrial metals and oil, losing 2.2%. Gold took out the high of May 14 at $1,304. More importantly, gold needs to take out the other recent highs at $1,314 and $1,324 as well. Over $1,324 our confidence rises that we should make an assault on the $1,350 high and the major $1,350 $1,370 breakout zone.
As a result, we have not eliminated our thoughts of potential targets down to $1,235 to $1,250. All that would be needed is for Trump to suddenly back off his Mexican tariffs. He has backed down before when it became clear that the damage could be considerable. Or a sudden breakthrough in the talks with China. Trump is well known for his threats, only for them to dissipate later.
As well, we question as noted whether the U.S. dollar has topped. Still, the cup and handle pattern remains intact and that has considerable potential but not until new highs are seen above $1,350. The cup and handle pattern projects up to around $1,535 with further potential to $1,725.
While a return back under $1,300 would be a slight negative, only a decline back through $1,290 would suggest that we could be on our way to fulfilling the earlier targets for the E wave down. That would complete a rather complex B wave stemming from the July 2016 high at $1,377. Since then despite a few attempts, gold has failed to break over the key $1,370 zone.
For the short term, we are cautious, but for the longer term, we are quite bullish. We did not reach the kind of bearish sentiment numbers that we normally associate with a bottom. A quick rise like this can quickly lead to very bullish sentiment. For that reason alone, we are cautious but optimistic.
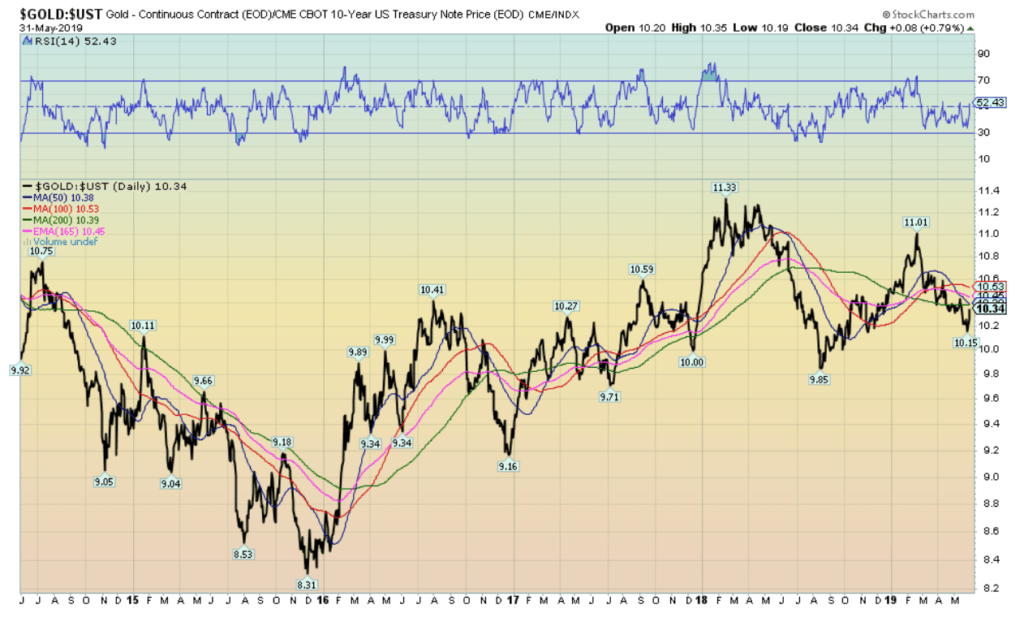
Above is a chart of gold and the U.S. 10-year Treasury note ratio. A rising ratio favors gold over bonds and a falling ratio favors bonds over gold. It was a rather jagged rise, but from December 2015 until early 2018, gold was generally favored over bonds. This period saw bond prices falling and while gold wasn’t exactly rising sharply there has been a general rise since that low in December 2015.
However, once bonds bottomed the ratio has generally favored bonds over gold. What is interesting here is that even as bond prices have been rising sharply the ratio is not making new lows below what was seen back in August 2018. Gold made its bottom in August 2018. The ratio topped with gold’s top at $1,350 in February 2019. What this ratio is hinting at is that with bonds’ failure to drag this ratio to new lows we suspect the next good move will favor gold over bonds.
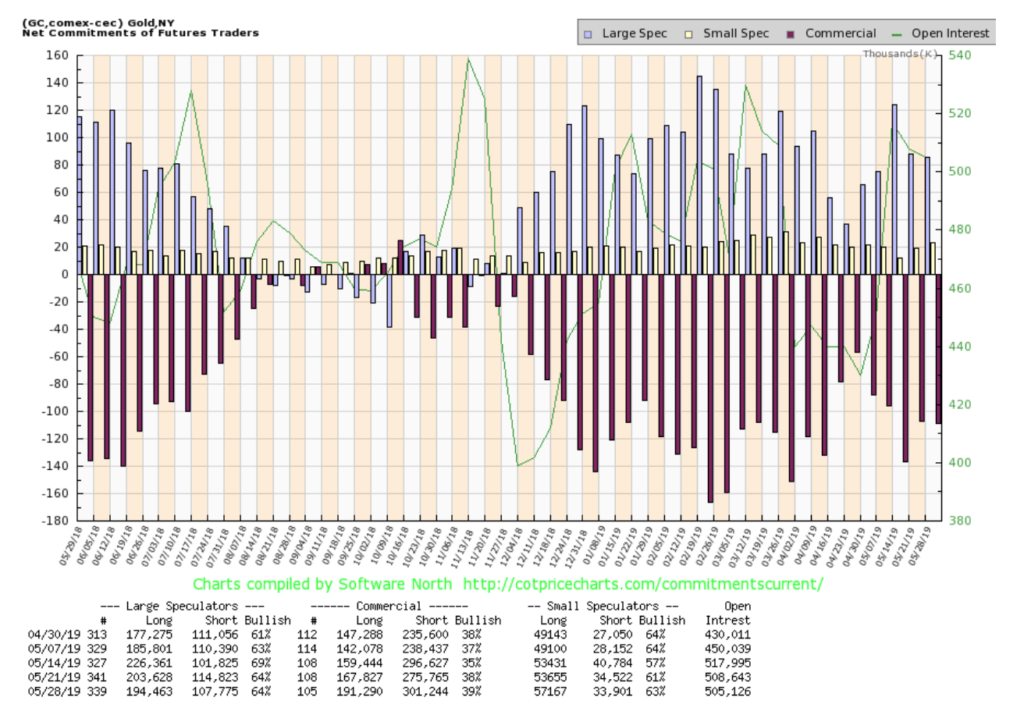
The gold commercial COT rose slightly this past week to 39% from 38%. Long open interest took a big jump up, roughly 24,000 contracts but short open interest also rose up 26,000 contracts. This is a mixed message. The commercials seem to be hedging their own bets. We don’t know whether they could be putting on calendar spreads.
A calendar spread is when you buy a near month and sell a later month or vice versa. Irrespective of this, the gold commercial COT remains well below the levels seen late last summer that preceded a move in price from $1,167 in August 2018 to $1,350 in February 2019. On that basis alone, while we are bullish longer term for gold, we are cautious near term. The current rally could be short-lived.
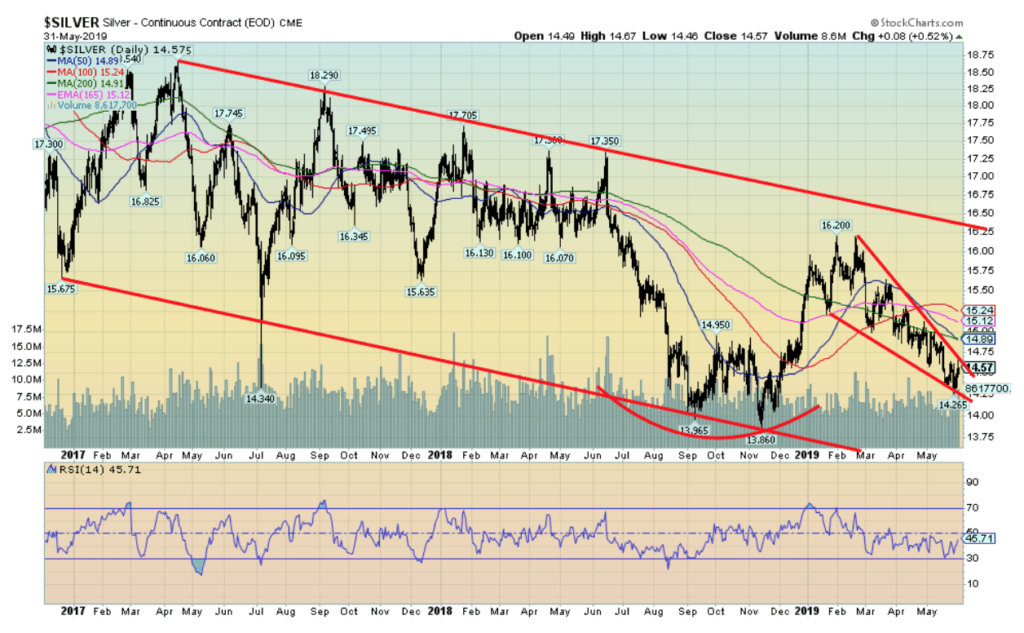
Despite a strong up move by gold this past week, silver prices barely budged. The gain on the week was $0.01 or under 0.1%. Silver lagging is not a great sign as our expectation in a strong rally is that silver prices should lead, not lag. As a result, it is a negative that keeps us suspicious of the strong rally seen on Friday.
Nonetheless, as the silver commercial COT shows, the commercials continue to accumulate silver and that is a major positive going forward. We do note that silver diverged with gold recently. In November silver prices made new lows for its down move while gold did not. This was repeated this past week when silver prices saw new lows down to $14.27 while gold prices did not make new lows.
A strong rally followed the November 2018 low. Will the same thing happen this time? Silver needs to break out of what appears to be a descending wedge triangle. If this is correct, then silver could rise towards $15 to $15.25. A firm breakout over $15.25 and especially over $15.50 would be needed to suggest that silver will make towards $16.20 and the January February highs. New lows are possible under $14.35. We are bullish on silver, but short term we are suspicious of silver’s failure to lead the rally this past week.
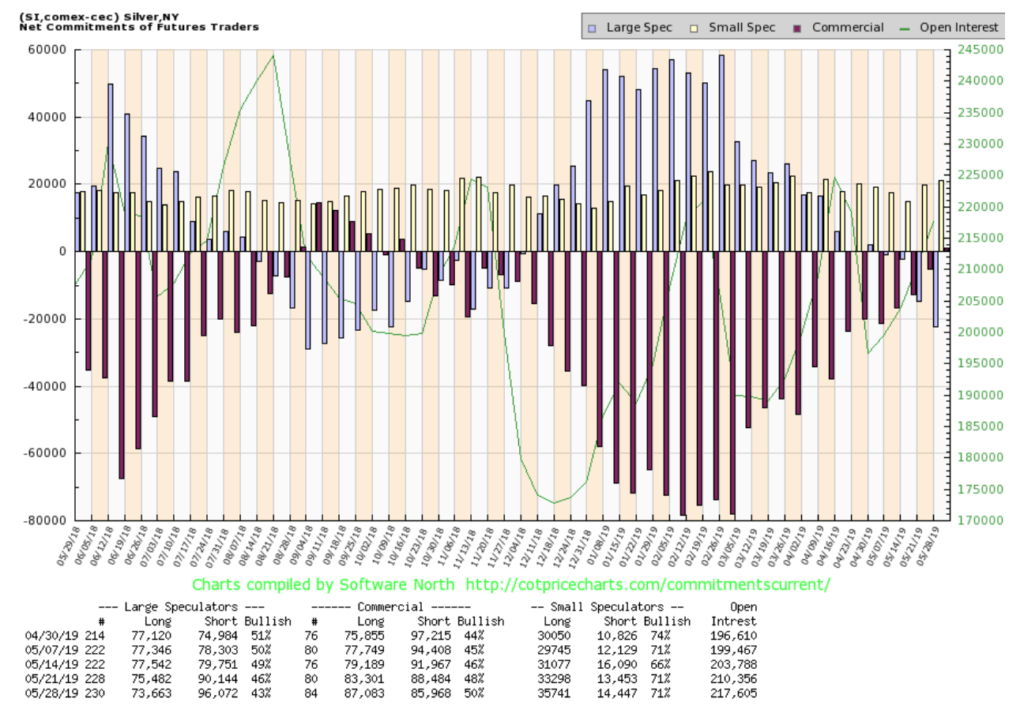
The silver commercial COT improved once again, this time to 50% from 48%. Long open interest jumped just under 4,000 contracts while short open interest fell roughly 2,500 contracts. The large speculators COT fell to 43% from 46% with short open interest jumping almost 6,000 contracts. We note that small speculators also increased their short open positions. At 50% the commercial COT is at the levels we saw in late summer 2018 just before silver prices rose from $13.86 to $16.20 a 16.9% move. We view the report as bullish.
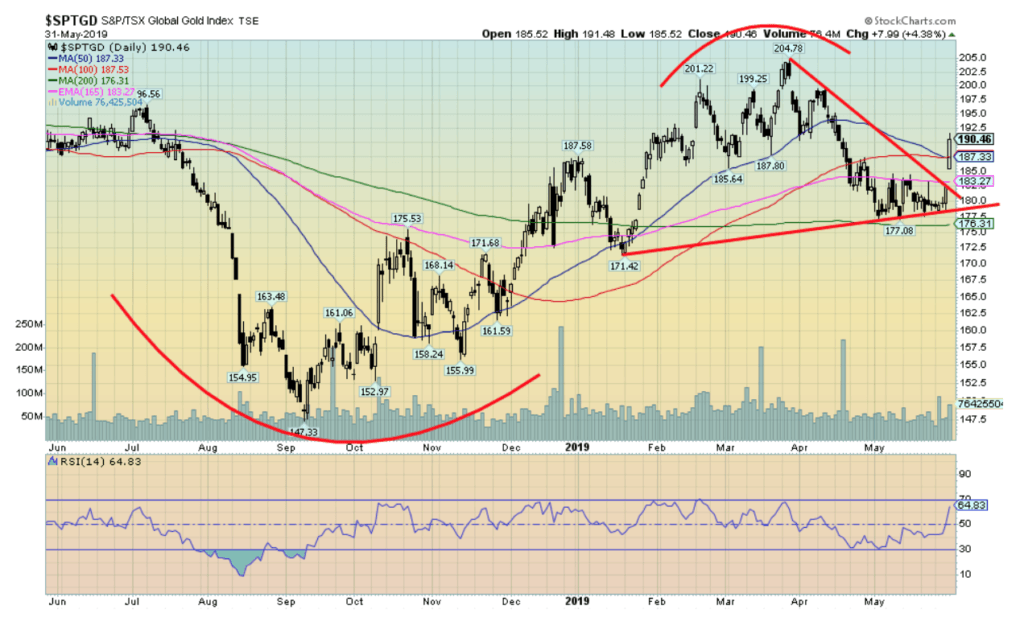
Gold stocks have broken out. Not only did they break the downtrend, but on Friday, May 31 the TSX Gold Index (TGD) gapped higher and closed over both the 50- and 100-day MAs. On the week, the TGD was up 6.1% while the Gold Bugs Index (HUI) was up 5.4%. The TGD is now up 2% on the year. Indicators have turned positive and both the short and intermediate term trends have turned up.
The HUI has also turned even as the short and intermediate trends remains neutral. Another up week would turn that index positive as well. For the short term at least the TGD has given a buy signal. Numerous gold stocks enjoyed a strong up day on Friday although for many junior exploration stocks they remain moribund. We don’t expect to see some good life in that market until gold clears $1,400.
Nevertheless, it was a good week. There remain numerous hurdles above. The next level to overhaul is 198–200. Above 200 the most recent high near 205 set in March should fall. 184–188 should now provide support. Below 184 we would be concerned that new lows could be coming. It is noteworthy that the TGD held its 200-day MA in the recent downtrend.
Some might look at this chart and wonder if a head and shoulders top could potentially form. We don’t believe it will, largely because the move this week took out the highs of the left shoulder. Normally the right shoulder is lower. Failure to make any further progress from here, however, could raise thoughts of a head and shoulders top. Volume was decent on Friday but not gangbusters.
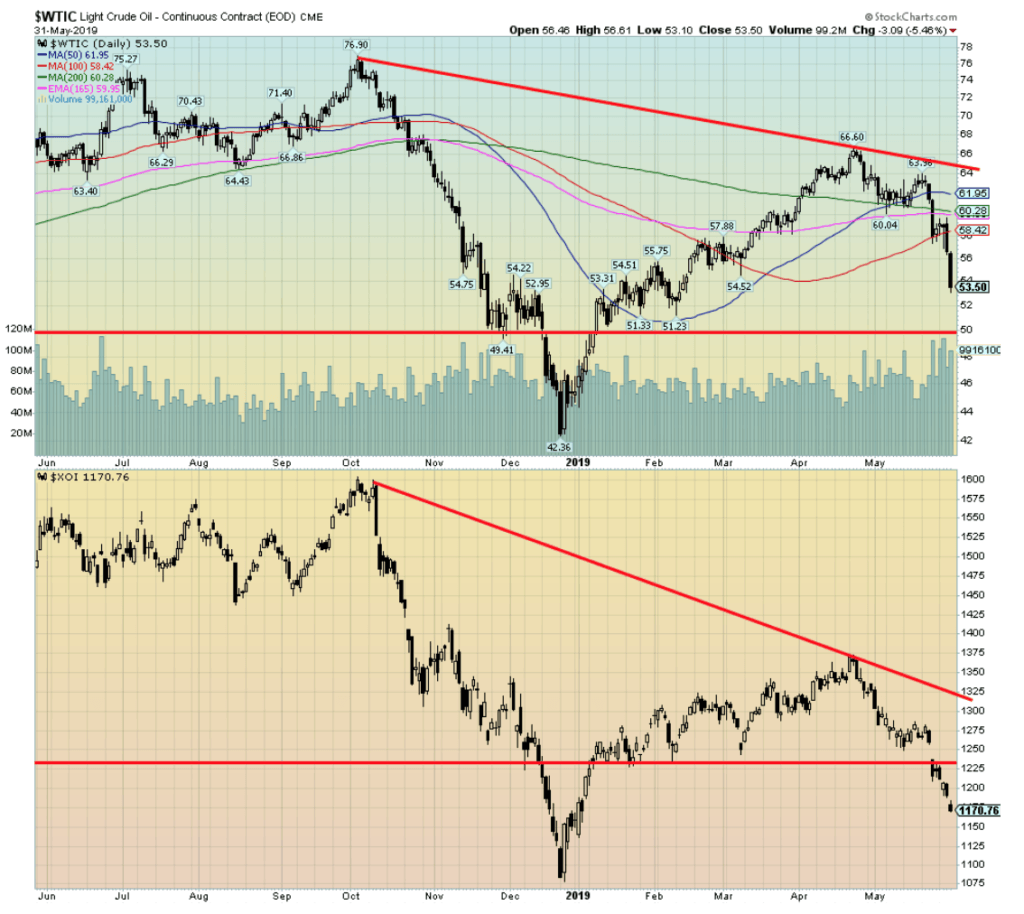
Despite a drawdown in U.S. crude supplies, WTI oil fell sharply on Friday, May 31 to end the month as the worst since November 2018. May is poised to end with the largest drop in six months. China upping the ante with a threat of holding back rare earths and the new opening of the trade wars with tariffs on Mexico sent oil prices tumbling. WTI oil ended the week down 8.8%. The decline was sufficient enough to turn the intermediate trend to the downside. Natural gas wasn’t spared as it too fell, losing 5.4%. None of this is very helpful to countries that want higher oil prices—i.e., Russia and Saudi Arabia—nor is this friendly to Alberta.
Canadian heavy crude tends to be at least $16 to $20 below WTI oil. Ballooning oil in storage is not helping Alberta’s position. Energy stocks predictably fell as well with the U.S. Oil & Gas Index (XOI) down 4.3% on the week, however, the TSX Energy Index (TEN) fared much better losing only 0.9%. WTI oil could be poised for further losses. As we can note, there is considerable support down to $50 but below that level, a serious test of the December 2018 low of $42.36 is most likely in play. Only regaining back above $60 could change this negative scenario.
Chart of the Week
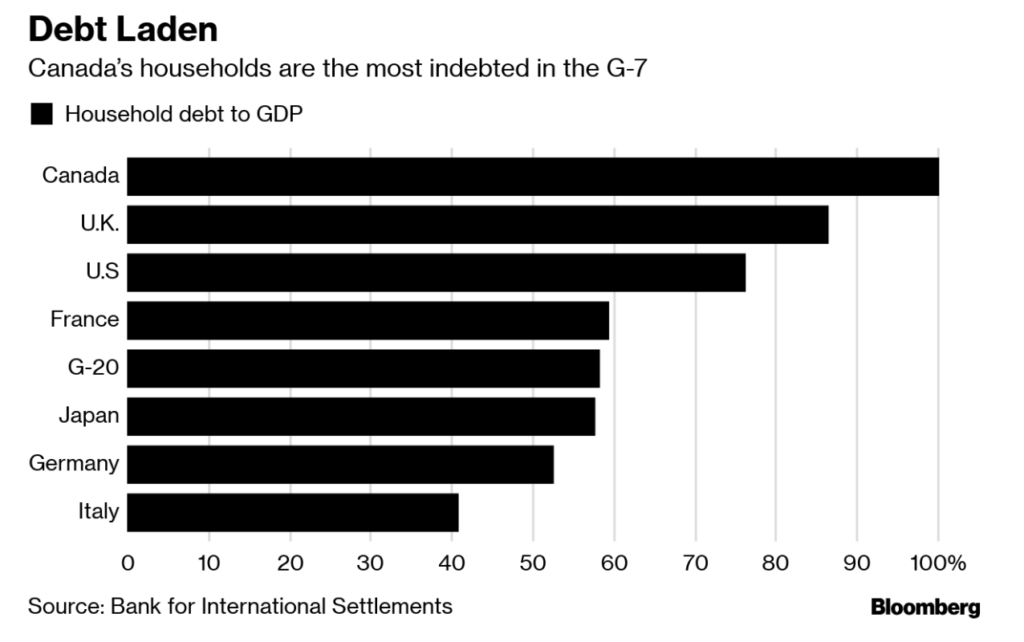
Canadians are an indebted bunch—the most of the G7 nations and the G20 nations. We must love our credit cards, mortgages, and lines of credit. But credit does keep the economy greased. Slow down credit and you most likely slow down the economy as well. After all, the consumer makes up some 63% and even as high as 75% of the economy. So, without the consumer with his credit card, where would the economy be?
Are the high consumer debt levels in Canada a problem? Consumer debt (mortgages, lines of credit, credit cards, etc.) totals some $2.2 trillion. It represents 179% of household disposable income and is 100.2% of Canada’s GDP. With the BofC rate held at 1.75%, one need not worry too much about further hikes in interest rates, according to Stephen Poloz the governor of the BofC. The bank has indicated that the likelihood of further rate hikes in 2019 is virtually nil. A little higher for 2020, but other odds say the bank will cut before they hike.
The debt is only a problem as long as they don’t meet the monthly payments. But delinquency rates are low. Apparently only 0.18% for mortgage debt and 1.07% for all other types of debt (as of 2018). And the consumer debt is mostly only a problem for individual consumers—unless there are massive defaults as we witnessed in the U.S. in 2007 when defaults mounted on sub-prime mortgages.
While sub-prime debt in the U.S. is still a problem, especially with student and automobile loans, the number one reason consumers go bankrupt in the U.S. is medical bills. Despite people having insurance, some 63% of U.S. consumer bankruptcies are medical bills. It is not just the uninsured that go bankrupt. In Canada, the number one reason for bankruptcy is an overextension of credit.
It has been said that 40% of Americans couldn’t cover $400 of emergency expenses. Here in Canada half of Canadians are $200 away from not being able to pay their bills and meet their living expenses. What if unemployment rose? Defaults would multiply.
Consumer debt is high in G7 countries. But is it a problem for the financial system? We think not unless of course there were massive defaults comparable to the sub-prime collapse in 2007. The burden, otherwise, is mostly on the consumer.
There are a number of debt dangers around the world. But the real dangers lie in corporate debt and, to a lesser extent, in sovereign debt.
(Featured image by DepositPhotos)
—
DISCLAIMER: David Chapman is not a registered advisory service and is not an exempt market dealer (EMD) nor a licensed financial advisor. We do not and cannot give individualized market advice. David Chapman has worked in the financial industry for over 40 years including large financial corporations, banks, and investment dealers. The information in this newsletter is intended only for informational and educational purposes. It should not be considered a solicitation of an offer or sale of any security. The reader assumes all risk when trading in securities and David Chapman advises consulting a licensed professional financial advisor before proceeding with any trade or idea presented in this newsletter. We share our ideas and opinions for informational and educational purposes only and expect the reader to perform due diligence before considering a position in any security. That includes consulting with your own licensed professional financial advisor.


Skybound Entertainment Launches Crowdfunding Campaign to Create an Invincible Game
Skybound Entertainment launches a crowdfunding campaign on Republic to create a AAA game based on its Invincible comic. The campaign...


36% of Cannabis Users Report a Reduction in Alcohol Consumption
A Numerator survey found that 36% of cannabis users reported decreased alcohol intake since using cannabis products. Cannabis users, mainly...


Green Arms Raised Almost 1 Million in its Crowdfunding Round on CrowdFundMe
Green Arms, an innovative startup facilitating citizen and business participation in renewable energy projects, has nearly reached 1 million euros...


Vithas and MSD Join Forces to Train and Innovate in Oncology Matters
Vithas and MSD have formed an alliance to enhance patient care, especially in cancer treatment. The collaboration focuses on innovation,...


What You Can Do to Create an Online Store People Trust
Learn how to build trust in your online store with expert tips. From sleek website design to secure payment processing,...
 |
|
 |  |
 |
|
-

 Biotech1 week ago
Vertex Strengthens its Position in Nephrology and Buys Alpine Immune Sciences for $4.9 Billion
-
 Biotech5 hours ago
Vithas and MSD Join Forces to Train and Innovate in Oncology Matters
-

 Crypto2 weeks ago
A Critical Look at the Progress of IOTA in the First Quarter of 2024
-

 Business4 days ago
Gold & Silver Continue Looking Strong