Featured
Silver gold ratio hit a 25-year high last week
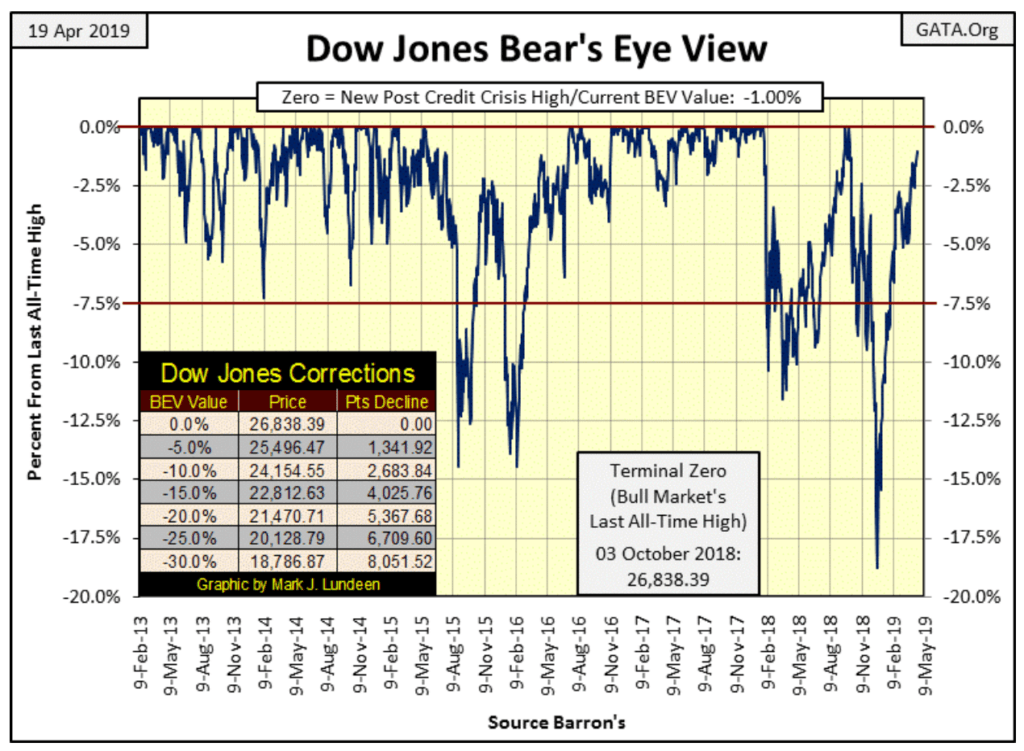
Talk about drama! The Dow Jones this week closed only one percent away from its last all-time high of last October 3rd.
From here it should be easy for the Dow Jones to make a new BEV Zero in the Bear’s Eye View chart below. But I don’t get a sense of urgency on the part of the bulls, so maybe not next week.
©Mark Lundeen
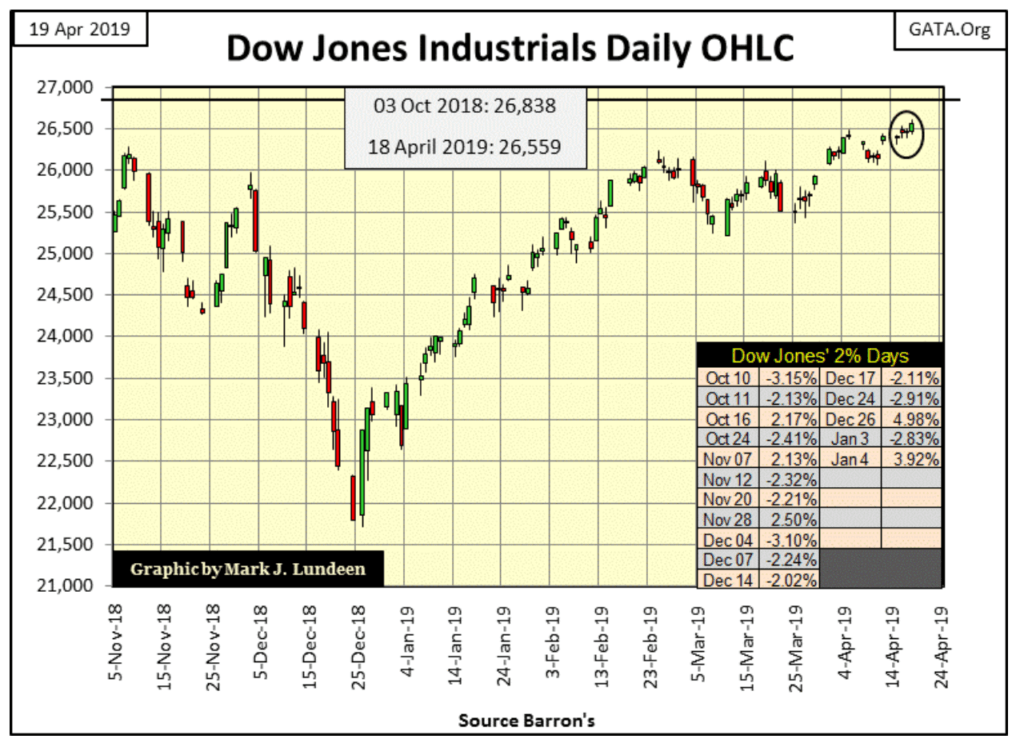
Looking at the Dow Jones in the daily bar chart below, market action again looks good. I know the stock market does best with low volatility, but seeing the Dow Jones so close to making history, advancing with such pathetic small daily steps is boring me to death.
Come on! The Dow Jones is only 268 points; one percent away from making history. One would expect a little excitement from the bulls in the stock market, but it’s not there. It’s almost as if trading is dominated by robot traders programmed by the big Wall Street firms. I wonder just how much public participation is in this market?
©Mark Lundeen
It’s a safe bet public participation in today’s bull market is far below where it was in the 1990s, and again before the 2007-09 credit crisis. After those two bubbles deflated, they greatly deflated the capital accounts of the general population that used to buy and sell the stocks trading on Wall Street. That plus having to endure two massive bear markets in less than a decade, the 2000 to 2002 78 percent bear market in the NASDAQ composite and the 2007 to 2009 54 percent bear market in the Dow Jones brutalized the bulls.
Wall Street itself isn’t looking too good either. It all comes back to an unpleasant fact that the Federal Reserve has “injected” too much “liquidity” into the financial system. When this “liquidity” is ingested by corporations, it metabolizes into insupportable liabilities on their balance sheets, where debt service for all too many companies today absorbs their profitability.
Most of the big blockbuster states in the Electoral College have spent more than they can pay back. At some point, a shock wave of defaults is going to spread terror in the debt markets.
Every now and then I receive comments on how the Federal Reserve System can support low bond yields indefinitely. Well yes they can, as long as the issuers of those bonds continue servicing their interest and principal payments. Whether the FOMC can maintain low yields as bond defaults roll across America is another thing entirely, and the day is coming when we’ll come to that point in the municipal and corporate bond markets.
At first fiduciaries and money managers will most likely “seek the safety” of the Treasury Bond market, as everyone knows Uncle Sam can’t go broke. He has the printing press making all the dollars he needs to pay his bills you know! Unfortunately, the dollars the Treasury’s debts are denominated in are backed only by the Full Faith and Credit of the United States Government. In other words, they are only accepted as payment for goods and services in the economy because the financial system has confidence in them. You can count on Mr Bear targeting confidence in the US Dollar as a high priority target in his pending bear market.
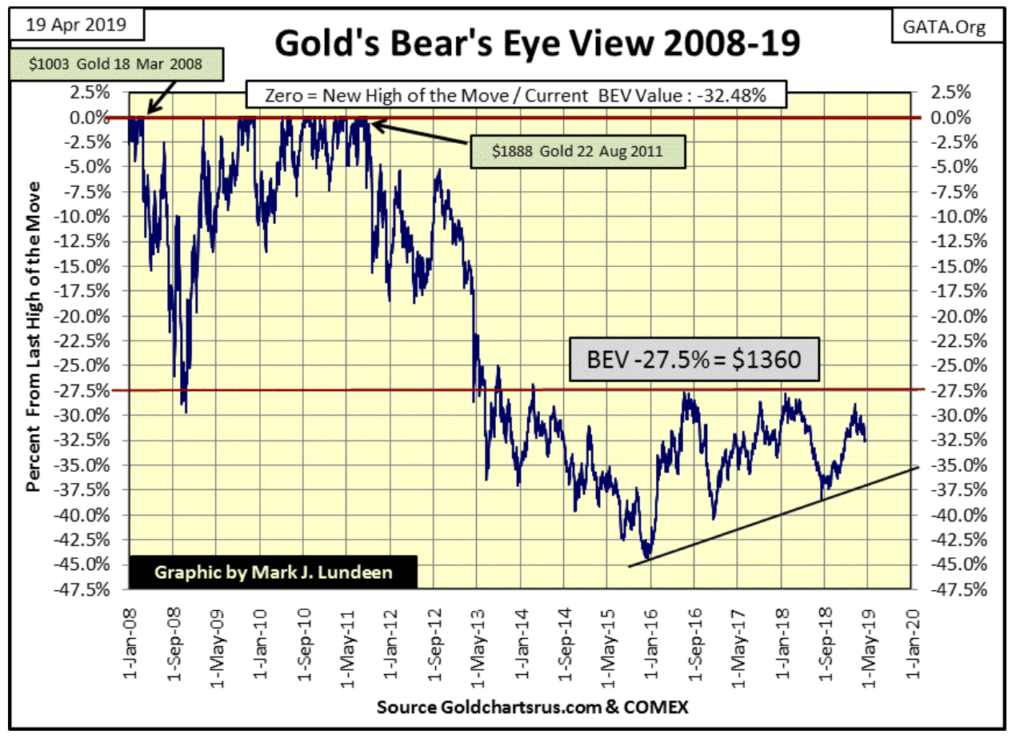
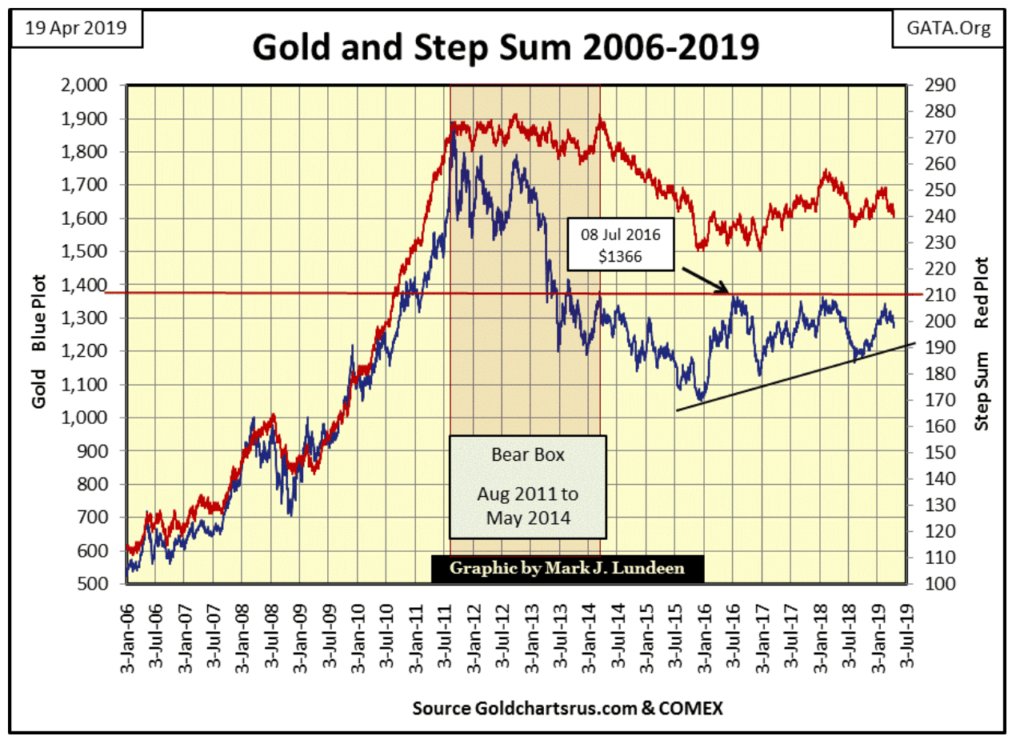
Which brings us to gold’s BEV chart below; so how does gold look at the close of this week? Gold is seeing a bit of a correction from its advance of September 2018 to January this year. Nothing to be worried about as it prepares for its fifth assault on its BEV -27.5 percent line ($1360) since 2013.
©Mark Lundeen
Gold and its step sum remain attractive, and hopefully ready for a break out sometime this year. Studying gold’s price plot (Blue Plot) below, when gold peaked in August 2011 to its December 2015 bear market bottom, the bears had their way with the bulls. However, after four years of that the bears have become a spent force in the market allowing the bulls to advance the price of gold for the past three years. When the bulls once again begin charging up the hill, they should take out their old all-time high of August 2011 without much trouble.
But before the bull market in gold, silver and the mining shares become obvious to all, I still believe we’ll need volatility in the stock and precious metals markets to increase dramatically. In other words these markets need to once again see days of extreme volatility on a regular basis.
For the Dow Jones that means for it to once again see regular daily moves of two percent or more. Of course this would be very bearish for the stock market, but it’s deflation in the financial markets that sends flight capital into the old monetary metals. When this capital flight arrives in the gold and silver markets, we’ll see frequent daily moves of three percent or more in gold, and five percent daily moves is the magic number for silver.
Until these markets once again become volatile markets, I’m expecting more of the same boring market action we’ve seen in the past few months.
©Mark Lundeen
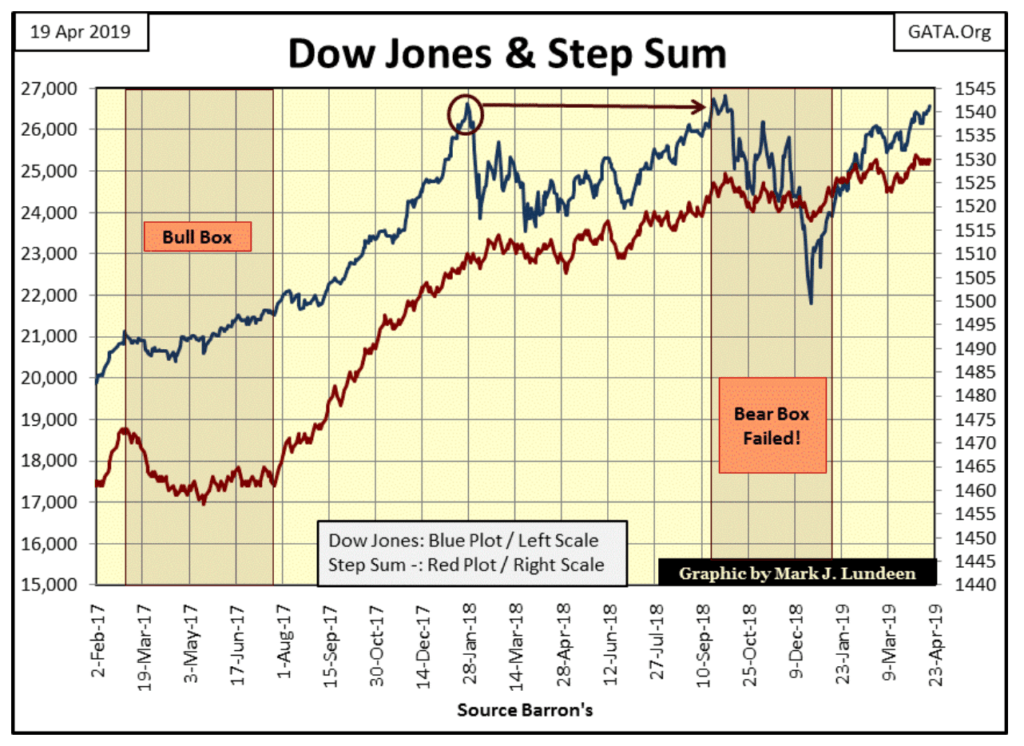
The Dow Jones and its step sum are seen below. The Dow’s step sum hasn’t moved much since early February, yet the Dow Jones itself continues to advance. That’s good market action. Now if the Dow Jones can manage to close above 26,858 next week, we’ll once again find it making market history.
©Mark Lundeen
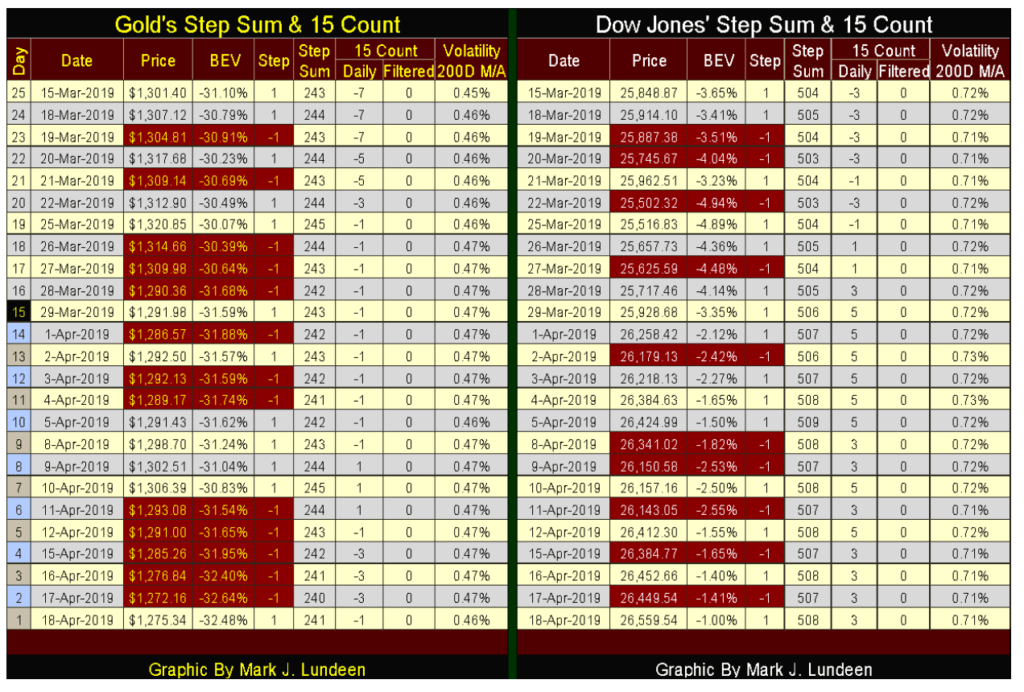
In the past few weeks gold has seen more declining than advancing days in its step sum table below, yet it has held on to its valuation. Then this week the price of gold slipped a bit. What that means for next week I haven’t a clue. Maybe the price of gold continues slipping down, or it could begin its assault on $1360, and then next week closing price may be near this week’s. In any case I remain a long-term bull on gold and silver.
©Mark Lundeen
The Dow Jones is seeing more advancing than declining days in the table above, and it’s using these net advancing days to advance in price. But as noted above, unlike 1999 and again in 2007, there is no sense of urgency for the Dow Jones to once again close at new all-time highs, making this one boring market to comment on.
I’ve been following the Gold Antitrust Action Committee’s (GATA) Bill Murphy and Chris Powell since the late 1990s. After their twenty-plus years of struggle, if Bill and Chris have one sore spot, it’s that certain people who should be GATA’s natural allies in their war on price manipulation in the gold and silver markets (mining company executives & pro-gold market experts) have chosen to remain silent, or have shown GATA serious disrespect.
Returning to the precious metals markets, GATA’s problems with the gold and silver markets are much more than just what some people will or won’t say to the public. When GATA first went public in 1998, central banks were net sellers of gold. As the entire world was fixed on the ever rising high-tech NASDAQ Composite Index, gold appeared to be an antiquated monetary asset. In the 1990s central bankers actually complained about their burden of holding and guarding what at the time was described as a “dead asset” that paid no interest to its owners.
The following quote by Warren Buffett from the 1990s sums up most people’s opinion on gold as it deflated towards its 20-year bear market bottom in July 1999: “We dig gold out of the ground, then we melt it down, dig another hole, bury it again and pay people to stand around guarding it. It has no utility. Anyone watching from Mars would be scratching their head.”
So, from the mid-1980s to 2000, central banks were more than willing to lend Wall Street their gold by the tonnage to receive a two percent rate of return. The big banks used this gold for leasing to mining companies to finance resource development and to speculators who sold in the open market to drive down the price of gold at the tail-end of the 1980-2001 bear market.
Most of this gold (monetary gold leased to Wall Street decades ago) is now gone and will never be returned to its central bank owners. But what a difference twenty years makes! Today in 2019, central banks now stand first in line to purchase as much gold as they can within the confines of the gold market’s limited supply.
In time the public will once again desire to own gold. Whenever that day comes, the public will be shocked at how little gold and silver was left to them by the central banking cartel. And when that day arises the price of gold and silver the public will have to pay won’t be subsidized, as it is now. Which is an excellent reason to believe the gold and silver miners will once again provide the public with a superb proxy for precious metals in a gold and silver bull market.
The silver to gold ratio (SGR) is the number of ounces of silver an ounce of gold can be traded for. More frequently the SGR is called the gold to silver ratio; why I don’t know as that is neither grammatically or mathematically correct, but as long as everyone knows it’s a ratio of silver to gold, no harm is done.
Before gold was demonetized in 1971, and silver kicked out of the monetary system in 1964, a long, long time ago the SGR was fixed by law. I know pre 1934 gold was fixed at $20.67 per ounce of gold, and an American $20 double eagle coin wasn’t exactly 1 ounce of gold, but for this example let’s state as a fact that before 1934 a $20 gold piece could be exchanged for 20 silver dollars, because it could.
This was so as the value of any coin then in circulation was fixed by the content of gold or silver it contained. The pre 1934 SGR of 20:1 was fixed by the approximate ratio of silver to gold found in nature as mining companies mined money from the ground. This ratio could vary significantly from one ore deposit to another and even from year to year for any particular ore body. But at some point a decision must be made to how many ounce of silvers (silver dollars) is to be equivalent to a single$20 gold piece, and that was fixed at 20.
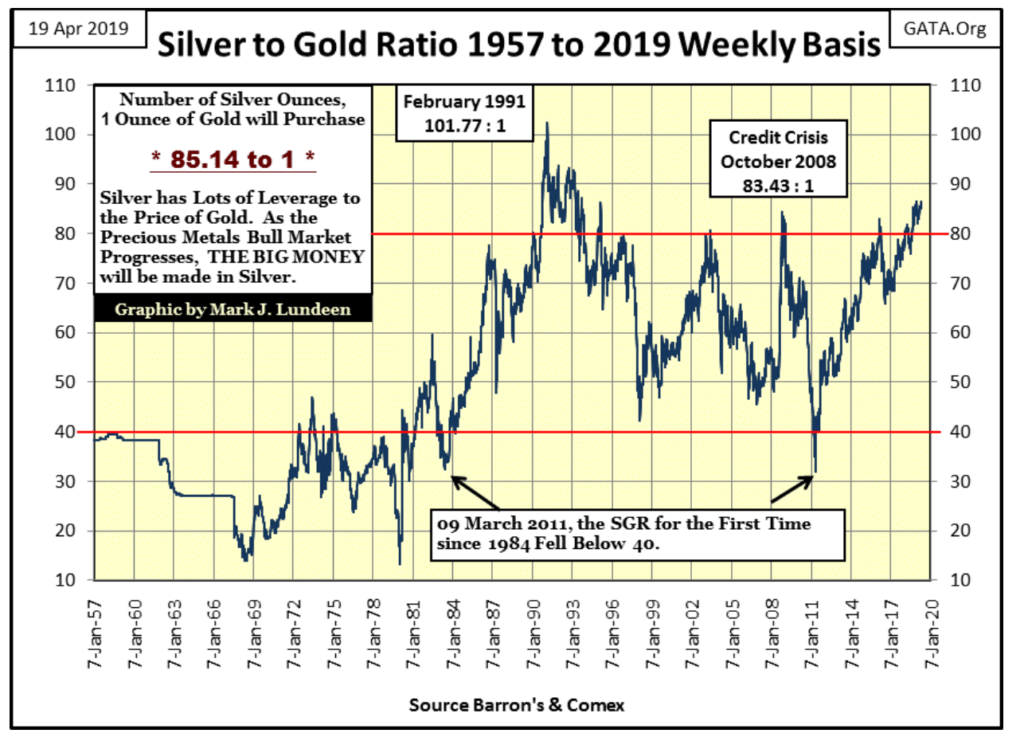
Below is a plot of the SGR going back to January 1957, to this week’s close. Before 1968 the ratio was bounded between 20 and 40 ounces of silver to one ounce of gold. Note that 1957 was the year a run on the US Treasury’s gold reserves began that didn’t end until August 1971. Currency in Circulation in 1957 was $31.8 billion. In December 1968 CinC increased to $50 billion dollars, an eleven year, 57 percent increase in CinC. Seeing the SGR cut in half, from 40 to below 20 during this period shows the price of silver more than doubled during this run on the US Treasury’s gold reserves, from $0.91 to $1.98 an ounce.
After August 1971, when the US Treasury decoupled the dollar from gold, allowing Washington to issue paper dollars unchecked by a metal monetary standard, it didn’t take long for this ratio to shift up above 30.
©Mark Lundeen
Since 1984, the SGR has in the main traded between 40 to 80 ounces of silver to one ounce of gold, and in doing so what is the SGR telling us? Other than the global monetary system was hijacked by monetary maniacs, I can’t really say. But two things can be said with certainty:
-
-
Declines in the SGR from 80 are periods of advancing gold and silver prices. Advances up to 80 are periods of declining gold and silver prices.
-
-
SGRs of >80 are market extremes, as in extremely cheap silver prices.
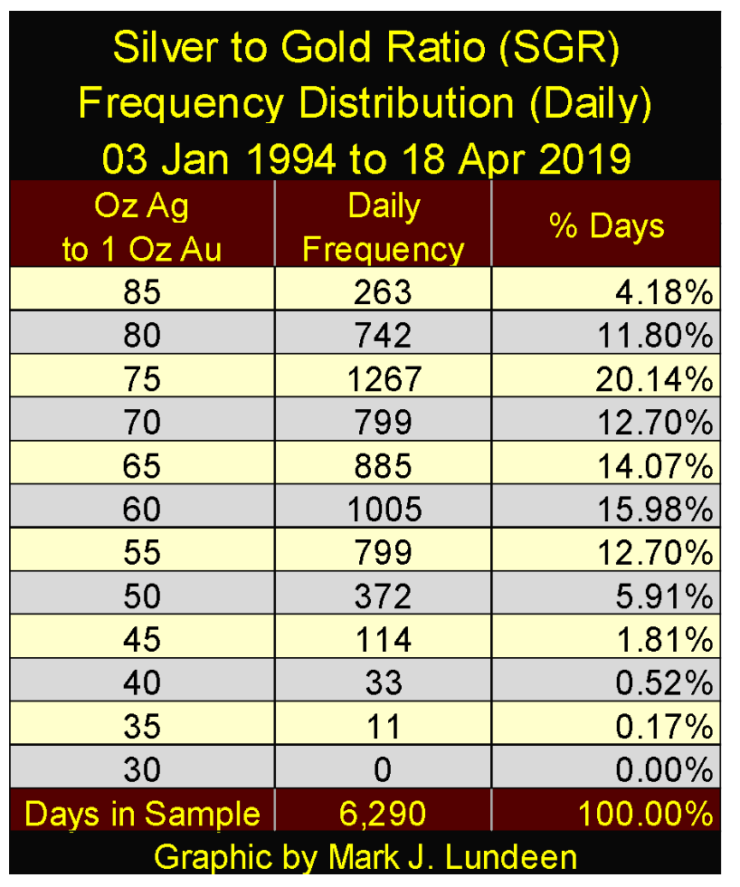
The SGR chart above uses weekly closing data, but I have daily data going back to 1969 in another file, which I used to construct the frequency distribution table below. I began the table in January 1994 as going back any further seems pointless.
Looking at row 85 of the SGR table below, which includes all the SGRs from >85 down to 80.01 from January 1994 to this week’s close, we see 263 daily closes in the past twenty-five years in this row. Looking at the SGR chart above (post January 1994) seeing the SGR at 80 or above is a market extreme that the market doesn’t long tolerate. So it’s interesting that of these 263 daily closings, 218 of them have occurred since February 2018, within the last year.
Also, the highest SGR values since January 1994 occurred just last week with April 11th’s SGR close of 86.36. I should note my gold and silver prices may not be the same as yours, as my source doesn’t provide COMEX closing prices, but the price of gold and silver at 10PM central time, as that’s when I download my data. Nonetheless, the SGR for the past year has been at a market extreme that from one day to the next has refused to decline below 80 for now well over a year.
©Mark Lundeen
What does all this mean? Clearly something got stuck in the precious metals markets. What happens when the SGR once again breaks far below its current value of >80 is something I’m looking forward to. Before that happens, I expect we’ll have to wait a bit longer as the central-bank cartel attempts to replenish their reserves of gold they squandered decades ago.
(Featured image by a98ntfp via Shutterstock)
—
DISCLAIMER: This article expresses my own ideas and opinions. Any information I have shared are from sources that I believe to be reliable and accurate. I did not receive any financial compensation for writing this post, nor do I own any shares in any company I’ve mentioned. I encourage any reader to do their own diligent research first before making any investment decisions.


The World’s Largest Insurers Have ESG Blind Spots, According to ShareAction
The evaluation of the 65 insurance companies carried out by ShareAction confirms the need for constant evaluation of the sustainable...


Spending on R&D in Biotechnology Increased by 13% in 2022 and Reached 2.56 Billion
In 2022, spending on biotechnology Research and Development (R&D) increased by 13% to reach 2.56 billion euros. Company expenditure grew...


Consolidation in Sight in the Italian and European Crowdfunding Sector
The trend towards the creation of “super platforms” could materialize well beyond a single isolated case: according to the European...


JuicyFields – the Largest Investment Fraud in the Cannabis Industry
The JuicyFields case is a warning to investors around the world, illustrating the risks associated with attractive but unverified investment...


AI Will Revolutionize Mental Health, Generating 2.5 Billion in Spain
The AI boom extends to mental health, with startups emerging in Spain aiming to leverage technology for patient and professional...
 |
|
 |  |
 |
|
-

 Impact Investing2 weeks ago
Umbrella eMobility and Enerfip Launch a Crowdfunding Campaign to Promote Sustainable Mobility in Spain
-

 Cannabis7 days ago
The Legal Cannabis Industry in the U.S. Provides Over 440,000 Full-Time Jobs
-

 Biotech2 weeks ago
Johnson & Johnson Buys Shockwave Medical for 12 Billion
-

 Cannabis3 days ago
Cannabis Legalization Reduces the Likelihood of Youth Using It