Featured
There Were some Buys Signals on the Stock Market this Past Week
This week we look at Russia’s forced default and rising energy and food prices. The sharp rise in food prices is a bad omen that could trigger a humanitarian crisis. Oddly few are talking about it. We continue the theme with our chart(s) of the week (page 6) featuring an energy and a food ETF. WTI oil up 408%, natural gas (NG) up 421%, gasoline up 522%, heating oil up 285%, and Brent oil up 299%.
Everything was up this past week but only natural gas (NG) hit fresh 52-week highs. Tourmaline Oil Corp., the largest natural gas producer in Canada, generated record cash flow and free cash flow in its first quarter of the year. Bond prices rose (yields fell) and we are seeing some signs that the bond market may have topped (in yield).

It has been reported that global stock markets have lost at least $11 trillion so far in 2022. The U.S. stock markets have lost an estimated $7 trillion. After sliding for seven consecutive weeks, U.S. stock markets rebounded this past week. The slide was only the fourth time a seven-week drop has occurred since World War II. The markets topped back on January 4, 2022. That’s only 143 days down to May 27, 2022. The longest recorded S&P 500 decline? 916 days from October 25, 1939 to April 28, 1942. It took until July 3, 1944 to exceed the October 1939 high. As they say—it’s early.
The headlines are replete with mention of soaring oil and gas prices, soaring food prices, and what is the Fed going to do next against signs that, instead, the economy may already be slowing. It is interesting to note that support for sanctions is beginning to falter. Apparently, in some recent polls, 51% in the U.S. said the focus should be limiting damage to the economy, not sanctioning Russia. Yet there is talk of even more sanctions against Russia and adding sanctions against countries that refuse to comply with U.S. sanctions against Russia; i.e., China and India. If that were to happen, prices could soar even more.
Russia is once again being put on the brink of default. The U.S. is apparently ending a waiver on May 25, 2022 that allows Russia to pay its debt to U.S. bond holders. While removal of this waiver only applies to entities in the U.S., it would have impact everywhere because of the outsized role of U.S. banks globally. This is an unprecedented move where geopolitics is sparking the default, not their ability to pay. Geopolitics played earlier roles in defaults by Venezuela and Iran.
Russia says they will pay in rubles. We doubt that will fly. But there are unintended consequences. Russia still sells its oil and gas to someone, even at a discount, and their coffers are filling up with potentially record trade surpluses. This helps push up the ruble against the U.S. dollar. The Russians could take those reserves, then go in and buy back their debt for pennies on the dollar. Of course, that assumes that bond holders would sell to them and that the U.S. would allow that to happen.
History is replete with defaults by sovereign entities and corporations, but we’ve never heard of one where the default was caused by the country that was the recipient of the bond payments.
The Incredible Rise of Energy Prices March 2020–May 2022
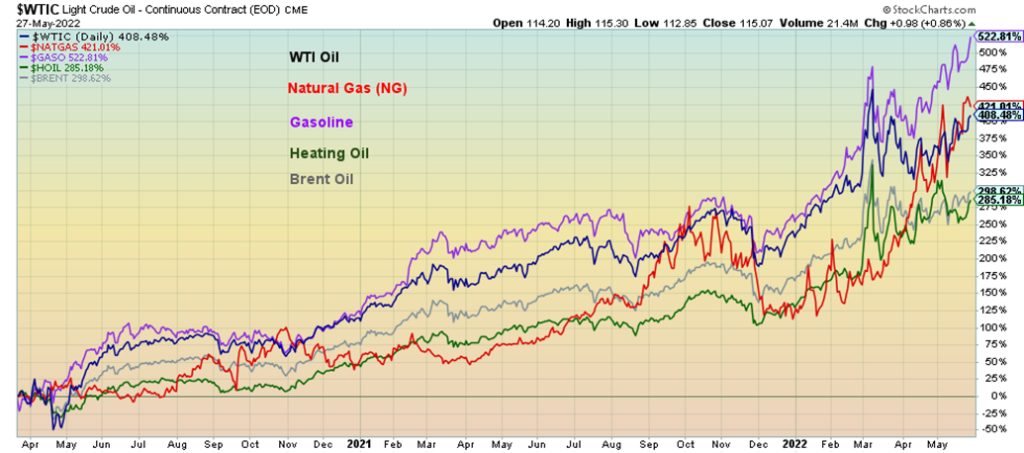
Above is the incredible rise of energy prices since March 2020. WTI oil up 408%, natural gas (NG) up 421%, gasoline up 522%, heating oil up 285%, and Brent oil up 299%. And we wonder why there is 8.3% inflation in the U.S. and 6.8% inflation in Canada. No wonder energy inflation was last up 30.3% in the U.S. year over year. Higher energy prices also feed back into food prices as transportation costs rise. Notice the big jump in energy prices in 2022, particularly after the Russian invasion in late February 2022. That event has played a significant role in the rise of energy prices and inflation.
But of larger concern should be the growing potential for a major food and humanitarian crisis, including a major famine that could impact 10% of the world’s population. As we know, Russia and Ukraine produce some 29% of the world’s global wheat and 19% of the world’s global corn. Russia/Ukraine rank third and eighth in global wheat production. China, followed by India, are the world’s largest producers of wheat. They can’t make up the difference as they consume it. The U.S. and Canada are ranked fourth and fifth respectively, but they too consume a lot of their production and have been experiencing droughts, the same as many others. The EU is also a large producer and if the EU were considered as one entity, they would rank second.
However, it is the importers that are of concern. The world’s largest importer of wheat is Indonesia. But numerous countries in the Middle East and Africa are also very large importers. Many countries get 70% to 100% of their grains from either Russia or Ukraine. Key countries include Egypt, Kenya, Sudan, Somalia, numerous central African countries, plus Jordan, and other Middle Eastern countries. Further east, Bangladesh and Indonesia are large importers.
700 million people in the Middle East and Africa are at risk of famine. Not helping are severe droughts. Also not helping is the lack of fertilizers. Russia is a very large exporter of fertilizers, but sanctions have cut that off as well. Farmers can’t get fertilizers and that in turn is going to lower yields. Add in high energy costs and a major crisis is brewing. Many are already seeing it at the grocery stores. But North Americans (Canada, U.S.) are not likely to suffer a famine like Africa.
A major global food crisis could trigger revolts, particularly in the Middle East. The Arab Spring of 2011 was triggered primarily by a food crisis. The Arab Spring, coupled with a food crisis and war, also triggered the last mass migration from Africa and the Middle East to the EU. When you are hungry and desperate, you’ll do anything to escape it. Central America is also experiencing drought and that in turn could trigger another mass migration to the U.S. border, leading to yet another border crisis in the U.S.
Soaring Food Prices: March 2020 to May 2022
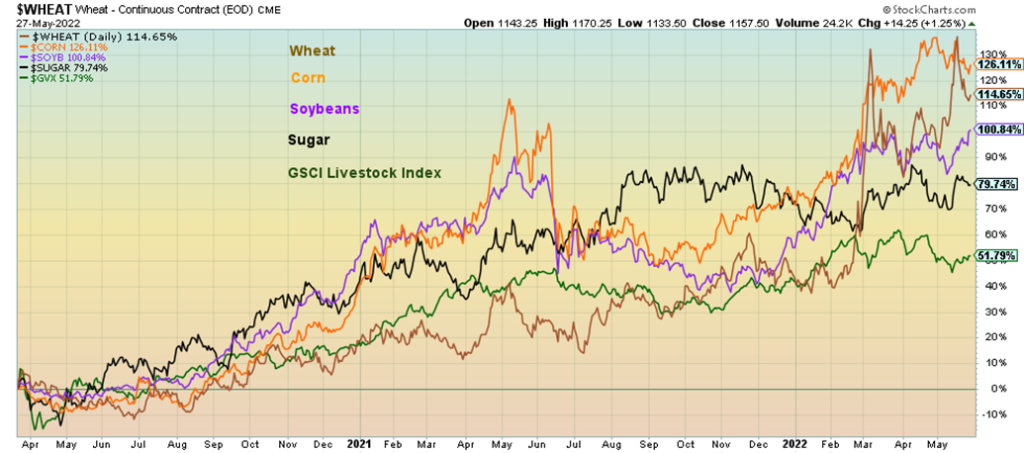
Since March 2020 food prices are up sharply. Again, note how they have jumped in 2022 following the Russian invasion. Since March 2020, wheat is up 153%, corn up 126%, soybeans up 95%, sugar up 100%, and the Livestock Index (GVX) up a modest 52%. Sugar is up almost 80%.
The food crisis most likely hasn’t hit yet. We’d be looking more towards Q4 or into 2023 for a global food crisis and a humanitarian crisis. Russia has proposed easing some of the restrictions on getting Russian and
Ukrainian wheat out. However, that would require the U.S. to ease some sanctions. The U.S. have refused. Investors may wish to look at food stocks.
Soaring World Food Prices 1999–2022
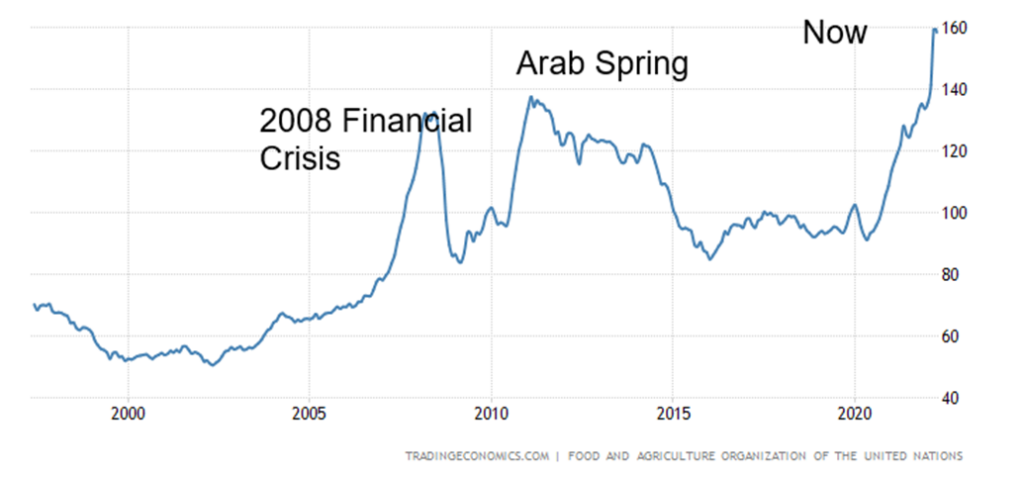
Chart of the Week
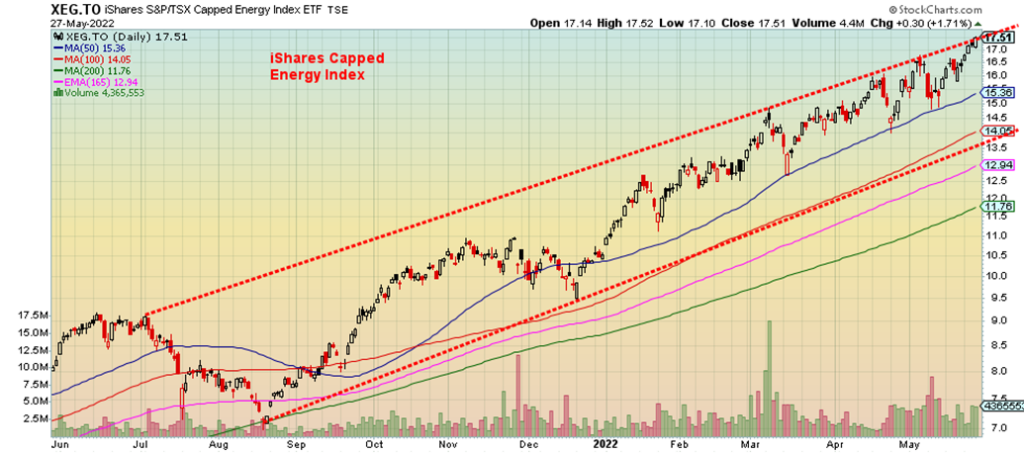
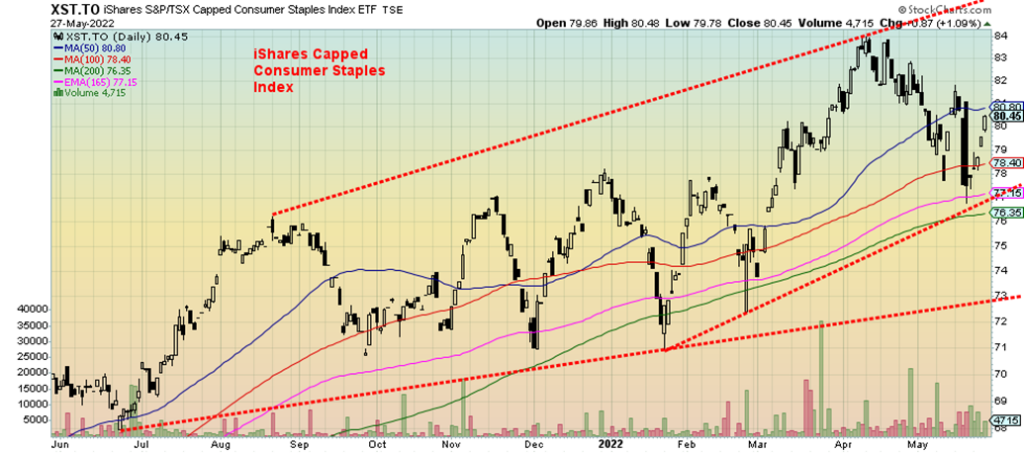
In keeping with the food and energy theme, here are the charts of the iShares Capped Energy Index (XEG/TO) and the iShares Capped Consumer Staples Index (XST/TO). The XEG has been on a steady upward climb. It currently appears to be at the top of a channel. So, it could be subject to a pullback. If XEG can get down to the 100-day MA that has been acting as support on the way up (currently around $14), then it might be an ideal
entry point. Indicators are not particularly overbought. It’s more difficult buying it at these levels. The ETF is up almost 66% so far in 2022. At current prices, XEG has a yield of 1.2%.
The XST has not performed as well, gaining only 3.7% so far in 2022. Not exactly a barn burner when comparing it to the XEG. It does yield a small 0.6% at current prices. The ups and downs over the past year have been sharper. XST is currently down, just over 4% from its recent high. But with food inflation soaring, this one might be a worthy addition. The chart is positive with a stair-step rise, albeit very steep stairs. But it continues to make higher highs and higher lows. One would have to use $76 as a stop.
Markets & Trends
| % Gains (Losses) Trends | ||||||||
| Close Dec 31/21 | Close May 27/22 | Week | YTD | Daily (Short Term) | Weekly (Intermediate) | Monthly (Long Term) | ||
| Stock Market Indices | ||||||||
| S&P 500 | 4,766.18 | 4,158.34 | 6.6% | (12.8)% | down (weak) | down | up | |
| Dow Jones Industrials | 36,333.30 | 33,212.96 | 6.2% | (8.6)% | neutral | down | up | |
| Dow Jones Transports | 16,478.26 | 14,444.66 | 7.1% | (12.3)% | down (weak) | down | up | |
| NASDAQ | 15,644.97 | 12,131.13 | 6.8% | (22.5)% | down (weak) | down | neutral | |
| S&P/TSX Composite | 21,222.84 | 20,748.58 | 2.7% | (2.2)% | down (weak) | down | up | |
| S&P/TSX Venture (CDNX) | 939.18 | 724.19 | 3.2% | (22.9)% | down | down | neutral | |
| S&P 600 | 1,401.71 | 1,248.94 | 6.6% | (10.9)% | neutral | down | up (weak) | |
| MSCI World Index | 2,354.17 | 2,051.95 | 2.6% | (12.8)% | down (weak) | down | neutral | |
| NYSE Bitcoin Index | 47,907.71 | 28,958.54 | (2.9)% | (39.6)% | down | down | up (weak) | |
| Gold Mining Stock Indices | ||||||||
| Gold Bugs Index (HUI) | 258.87 | 260.64 | 1.6% | 0.6% | down | neutral | neutral | |
| TSX Gold Index (TGD) | 292.16 | 302.72 | 0.4% | 3.6% | down | neutral | up (weak) | |
| Fixed Income Yields/Spreads | ||||||||
| U.S. 10-Year Treasury Bond yield | 1.52% | 2.74% | (1.8)% | 80.3% | ||||
| Cdn. 10-Year Bond CGB yield | 1.43% | 2.79% | (1.8)% | 95.1% | ||||
| Recession Watch Spreads | ||||||||
| U.S. 2-year 10-year Treasury spread | 0.79% | 0.25% | 25.0% | (68.4)% | ||||
| Cdn 2-year 10-year CGB spread | 0.48% | 0.24% | 20.0% | (50.0)% | ||||
| Currencies | ||||||||
| US$ Index | 95.59 | 101.70 | (1.4)% | 6.4% | neutral | up | up | |
| Canadian $ | .7905 | 0.7857 | 1.0% | (0.6)% | neutral | down | neutral | |
| Euro | 113.74 | 107.29 | 1.6% | (5.7)% | neutral | down | down | |
| Swiss Franc | 109.77 | 104.44 | 1.8% | (4.9)% | neutral | down | down | |
| British Pound | 135.45 | 126.30 | 1.1% | (6.8)% | neutral | down | down | |
| Japanese Yen | 86.85 | 78.68 | 0.6% | (9.4)% | neutral | down | down | |
| Precious Metals | ||||||||
| Gold | 1,828.60 | 1,857.30 | 0.8% | 1.6% | down | neutral | up | |
| Silver | 23.35 | 22.10 | 2.0% | (5.4)% | down | down | neutral | |
| Platinum | 966.20 | 943.00 | 0.2% | (2.4)% | down (weak) | down | neutral | |
| Base Metals | ||||||||
| Palladium | 1,912.10 | 2,054.80 | 5.9% | 7.5% | down | down | neutral | |
| Copper | 4.46 | 4.306 | 0.7% | (3.5)% | down | down | up | |
| Energy | ||||||||
| WTI Oil | 75.21 | 115.07 | 4.3% | 53.0% | up | up | up | |
| Natural Gas | 3.73 | 8.73 (new highs) | 8.0% | 134.1% | up | up | up | |
New highs/lows refer to new 52-week highs/lows and, in some cases, all-time highs.
Is the bear over? We are sure everyone got excited over the best week for the markets since November 2020. Everybody leaped, taking out the steep downtrend line from the March high. Volume was decent and advances were outpacing decliners 8.5:1 on the NYSE. It was a halleluiah week. So, is the bear over? Well, it is at least a temporary low, but we are loath to say “the bear is over.” There were numerous positive divergences on the indicators at the recent lows, giving us clues that a low could be at hand. But there remains a lot of work to be done.
So, what spurred the markets higher? Interest rates fell this past week as the 10-year slipped. Inflation expectations were tempered by some signs that the economy could be slowing. See in particular Q1 GDP and a sliding housing market. Consumer sentiment is the lowest in over a decade. While Fed hikes are built in for June and July there is some growing consensus that the Fed may slow after that if the economy continues to falter. The war is also “over there” and interest has waned. The result saw the stock market rise, gold rise and the US$ Index fall. As noted, bond yields fell. All this despite continued rising energy prices.
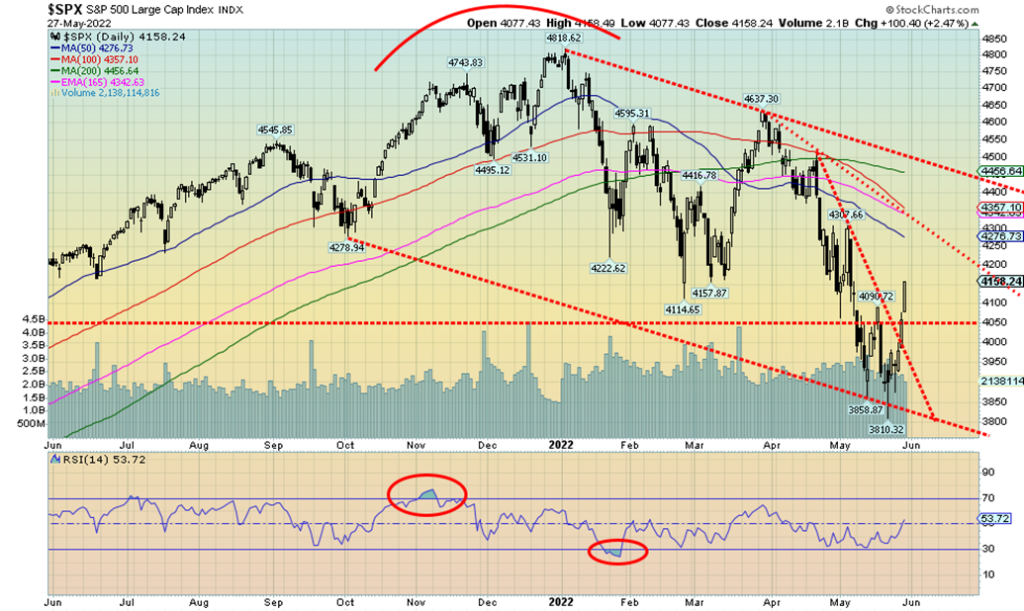
The S&P 500 gained 6.6% this past week, the Dow Jones Industrials (DJI) was up 6.2%, the Dow Jones Transportations (DJT) was up 7.1%, and the NASDAQ gained 6.8%. The S&P 500 Equal Weight Index gained 6.4% and we can’t help but notice the outperformance of the SPXEW vs. the SPX. The SPX is down 12.8% year to date but the SPXEW is down only 7.8%. The S&P 600 (small cap) gained 6.6% while the S&P 400 (mid cap) was up 6.5%. Everybody was happy. In Canada, the TSX Composite was up 2.7% and the TSX Venture Exchange (CDNX) up 3.2%. In the EU, the London FTSE gained 2.6%, the Paris CAC 40 was up 3.7%, and the German DAX gained 3.4%. Asian markets did not fare as well as China’s Shanghai Index (SSEC) fell 0.5% while the Tokyo Nikkei Dow (TKN) gained a small 0.2%. The NYSE Bitcoin Index fell 2.9% but the MSCI World Index was up 2.6%.
While the breakout is great and it is highly likely we are setting up for a summer rally, we are under no illusions that this is the start of the new bull market. If it is, it has to prove itself. New bull markets can only be confirmed with moves to new all-time highs. But given how extended the markets were at the January high, it
is highly unlikely that a new bull market is getting underway. It’s more likely is we are setting in for at least a two-year bear and any rally now should fall short of the January high. We are now five months down from the January high. The downtrend line from the January high is up around 4,500 so we’d first need to overhaul that level. The 200-day MA is at 4,455. Visible resistance is seen at 4,250 up to 4,500. To the downside, a breakdown back under 4,000 could signal that the rebound rally is over.
The markets this week were buoyed by lowering inflation expectations and some signs that consumer demand continues strong. But the housing market is slipping and it is an important component. As well, Q1 GDP was reported again at negative 1.5%. If Q2 is negative, we have an official recession.
Monday is the Memorial Day holiday, signaling the official start of summer and the summer driving season. Follow-through to the upside this coming week would be important to confirm that we are indeed making a bottom and starting a rebound rally that could carry us into July at minimum.
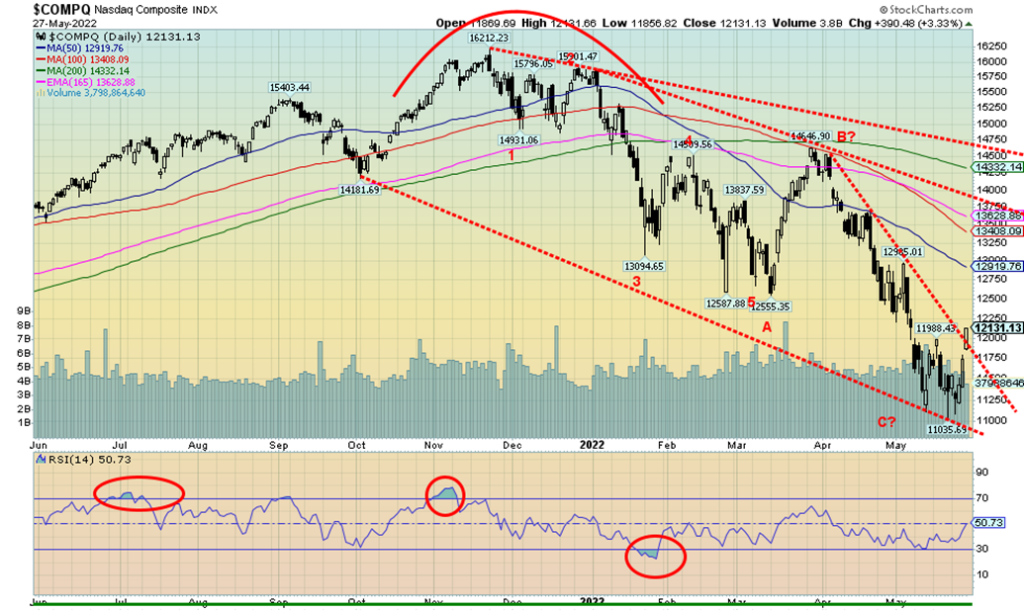
The NASDAQ is slower off the mark than the big cap DJI or S&P 500. It is, of course, laden with the FAANGs which actually had a stellar week. The NASDAQ gained 6.8% and is breaking that steep downtrend line from the high of what we believe is the B wave. The C wave fell in five waves. The FAANGs performed well as follows: Meta (Facebook) up 0.8%, Apple +8.6%, Amazon +7.0%, Netflix +4.7%, Google +3.3%, Microsoft +8.2%, Tesla +14.4% (quite the jump), Twitter +5.0% (all helping Elon Musk get richer), Baidu +11.7%, Alibaba +7.7%
and Nvidia +12.8%. With the NASDAQ giving us at least a small buy signal, we would not be able to confirm a bottom until we regain over 13,000. Just closing over 12,000 gave us our short-term buy signal. There is massive resistance up to 14,750, but over that level we’d be looking at either a double top or new highs. A lot of work to do.
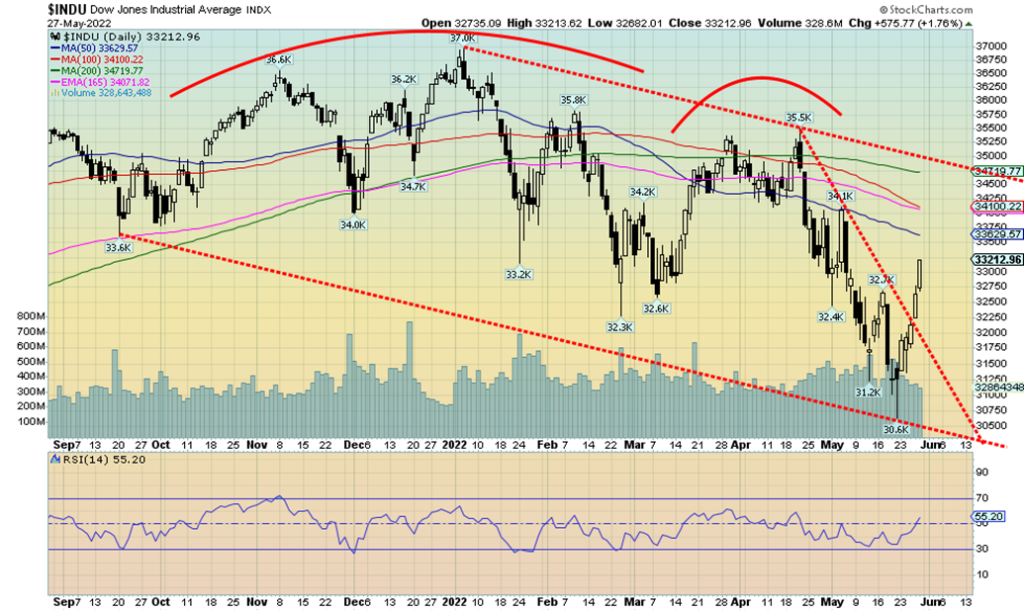
The Dow Jones Industrials (DJI) made a swift 6.2% gain this past week, the second consecutive weekly rise. But we note volume wasn’t all that impressive, so the hint to us is this is a bear market rally. Possible targets for the DJI are up to the 200-day MA and the downtrend line from the January top. That could take us to 34,700 to 35,000. A breakout over 35,000 and especially over 35,500 could set the January 4 high in play. A move back under 32,250 would be negative and under 31,200 new lows are highly probable. Below 30,600 the recent low long-term support is most likely down at 26,000–27,000.
Consumer Sentiment
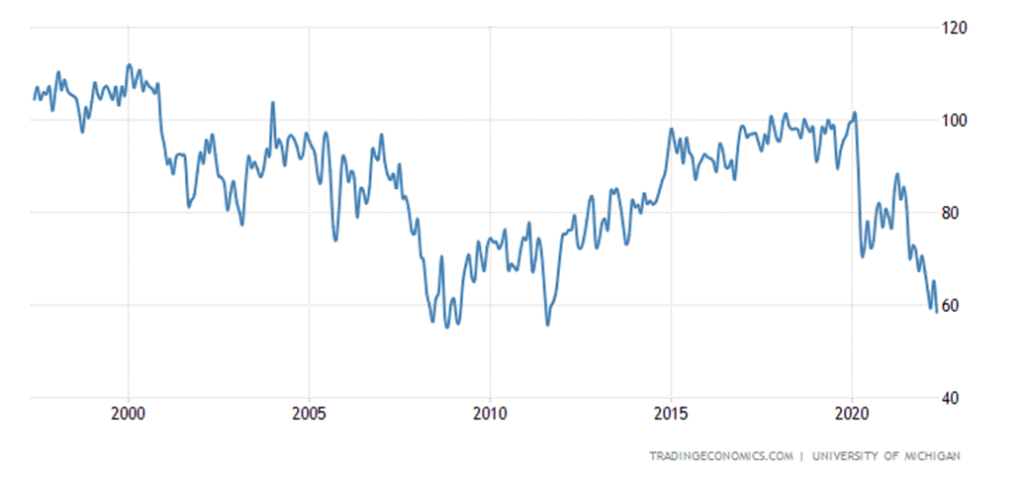
Consumer sentiment continues to languish at the lowest levels seen since 2011 and edging towards the levels seen during the 2008 financial crisis. The May final consumer sentiment came in at 58.4 which itself was revised downward and below expectations. Consumer expectations came in at 55.2, also below expectations and below April’s 62.5. No wonder, with Q1 GDP second estimate coming in at negative -1.5%. The first estimate was negative 1.4% and the market thought it would improve to negative 1.3%. We suspect a recession has already started. Corporate profits were also reported down 4.3% in Q1, below the expected forecast of a gain of 0.5%. Personal spending gained 0.9% in May but personal income was up only 0.5%. Are consumers spending more than they are earning? New home sales in April plunged 16.6% when they expected only a decline of 1%. Pending home sales fell 3.9% in April. All this is consistent with numbers that could also point to a negative growth for Q2. Two consecutive quarters of negative growth is an official recession. Unemployment is a lagging indicator.
S&P 500 Earnings (EPS)
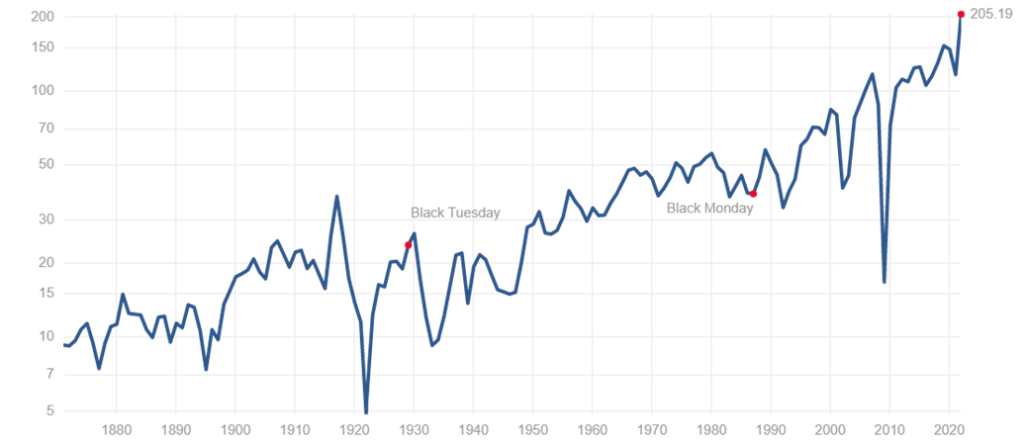
This chart of S&P 500 earnings (EPS) actually only goes to December 2021. As we noted above, the preliminary estimate for Q1 earnings is a decline of 4.3%. We’ll have to await further readings to see if this has any legs to the downside as was seen in the 2008 financial crisis. The earnings yield remains low compared to its historical. The current yield is 4.8% vs. a long-term average of 7.29%.
Shiller S&P 500 PE Ratio
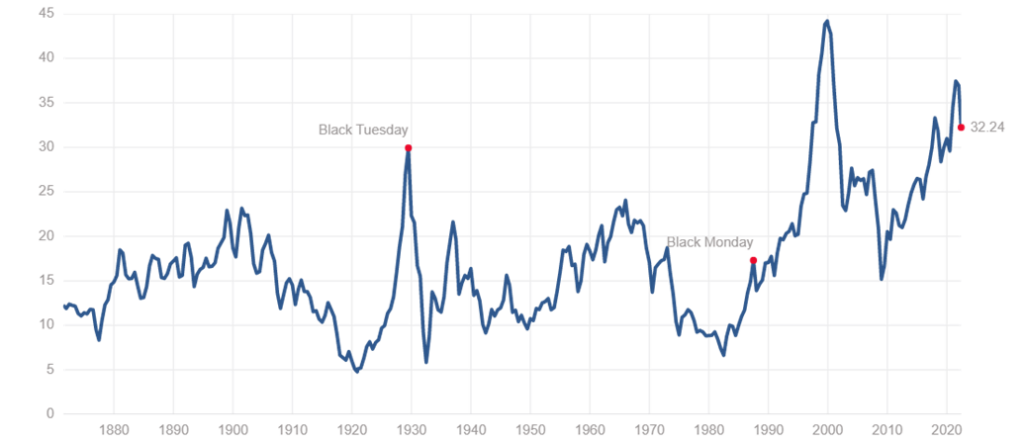
Even PE ratios are coming down. This latest Shiller PE is to the current week of May. Grant you, it remains quite high and is down nowhere near historical averages around 17. The traditional PE ratio for the S&P 500 is down to 20.83, not that far above the long-term mean of about 16.
GDP Growth Rate 1997–2022
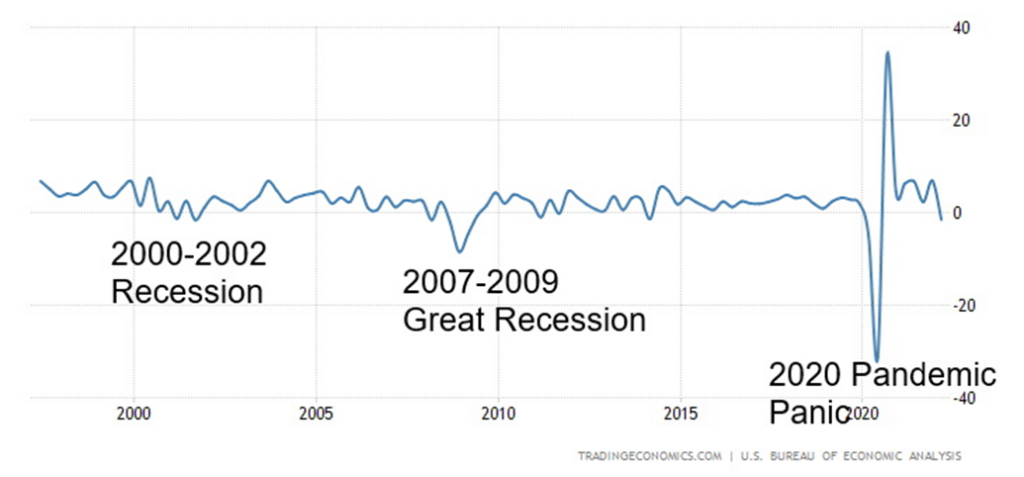
The US economy contracted an annualized 1.5% on quarter in the first three months of 2022, slightly worse than initial estimates of a 1.4% decline, with the biggest drag coming from trade. Imports surged more than initially anticipated (18.3% vs 17.7% in the advance estimate), led by non-food and nonautomotive consumer goods and exports dropped slightly less (-5.4% vs -5.9%), mainly due to nondurable goods. Also, private inventories subtracted 1.09 percentage points from the growth, the most in three quarters, led by decreases in wholesale trade (mainly motor vehicles) as well as mining, utilities, and construction (notably, utilities). Meanwhile, fixed investment growth was revised lower but remained robust while housing investment grew much less than initially forecasted (0.4% vs 2.1%). On the other hand, consumer spending rose more (3.1% vs 2.7%), led by housing and utilities and motor vehicles and parts while spending on gasoline and other energy goods decreased.
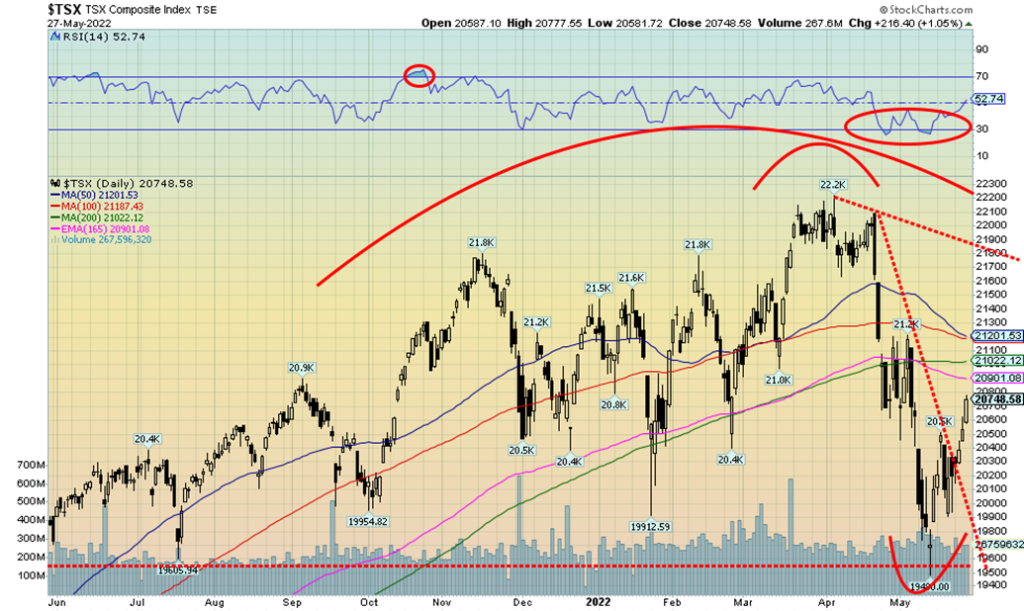
The TSX gained 2.7% this past week—nice, but well short of the stellar gains seen by the U.S. indices. The TSX Venture Exchange (CDNX) gained 3.2%. Both the TSX and the CDNX have given us short-term buy signals. But we’d prefer to see the TSX over 21,200 to confirm a low. We did break out over the steep downtrend line from the April all-time high at 22,213. Twelve of the 14 sub-indices gained this past week. The big loser? Health Care (THC) fell 6.0%. Utilities (TUT) fell 0.4%. Health Care has fallen so hard this year that it is looking like a buy. The Health Care ETF XHC/TO is a potential target. The big winner on the week was Energy (TEN)—surprise! —with a gain of 6.8%. Other decent winners were Metals & Mining (TGM) +3.3%, Consumer Discretionary (TCD) +3.0%, Consumer Staples (TCS) +3.0%, and Financials (TFS) +3.9%. TFS and TEN are two large components of the TSX. The rise for the TSX has been quick and there is considerable resistance from roughly 20,900 up to 21,200. But if that zone can be overhauled then further gains are possible. A breakdown under 20,000 would be negative and new lows could lie ahead.
10-year Treasury Bond/Canadian 10-year Government Bond (CGB)
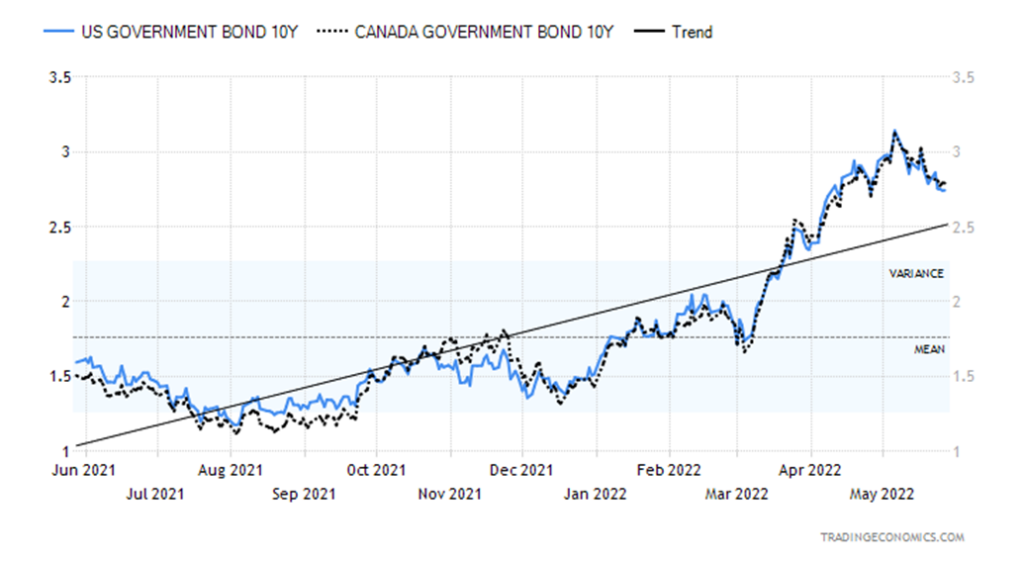
U.S. treasuries eased this past week as the 10-year U.S. treasury note slipped to 2.74% from 2.79%. Yields fell because of some weaker than expected economic numbers, especially the Q1 second estimate GDP of negative 1.5% when the market was actually expecting a better number. The first estimate was a contraction of 1.4%. If Q2 shapes as negative which is quite possible, then we’d be in an official recession. Consumer spending was buoyed by the personal spending jump in April of 0.9% above the expected 0.7% gain, but some caution is indicated as personal income rose only 0.4% below the expected 0.5% gain. Finally, the Michigan Consumer Sentiment Indicator came in at a disappointing 58.4 vs. the expected 59.1 and Aprils 65.2. It’s the lowest consumer sentiment since 2011. In Canada, the 10-year Government of Canada bond (CGB) slipped to 2.79% from 2.84%. However, our recession watch spreads 2–10 rose in the U.S. to 25 bp and in Canada to 24 bp. If the U.S. 10-year drops below 2.70%, a decline to 2.50% could in the offing. The 10-year is showing signs of having topped, but we await a drop under 2.70% to confirm. A return back over 3% would most likely set up new highs.
This week we get the big employment numbers for May, out on Friday, June 3. Canada reports the following week. The expectation is for nonfarm payrolls to rise 320,000 vs. 428,000 in April and for the unemployment rate (U3) to fall to 3.5%. Watch for gains in hourly earnings expected to be up 5.5% month over month.
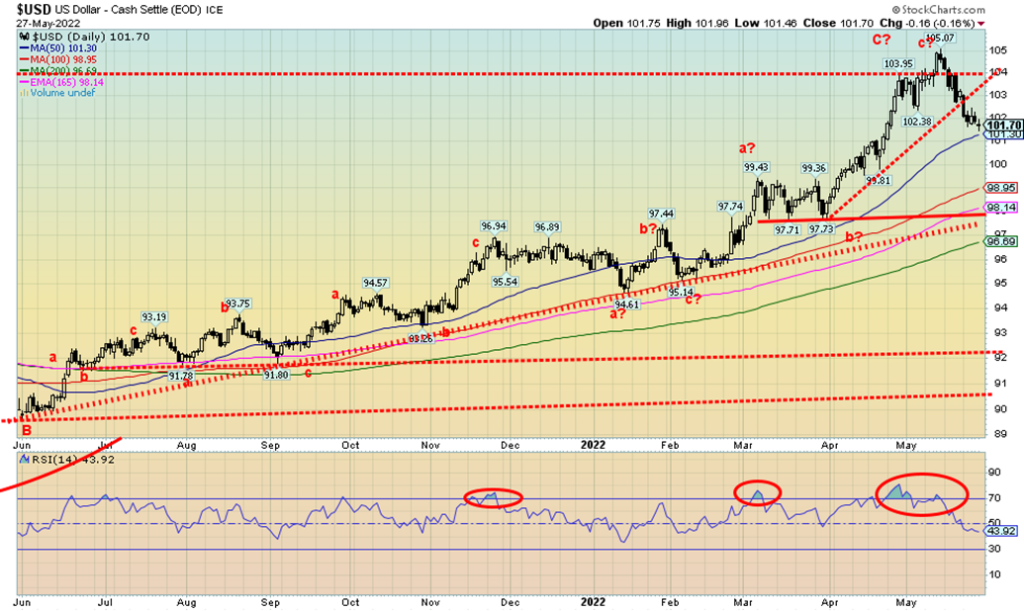
The US$ Index fell for the second consecutive week, losing 1.4%. Currencies gained with the euro up 1.6%, the Swiss franc gaining 1.8%, the pound sterling up 1.1%, and the Japanese yen jumping 0.6%. The Canadian dollar gained about 1.0%. The US$ Index was buoyed by traders paring expectations of interest rate hikes by the Fed, although 50 bp hikes in June and July are built in. As well, some consumer spending numbers helped with personal spending being up, but one should note personal income was not as robust. U.S. treasuries also saw yields ease as some weak economic numbers including Q1 GDP recorded a contraction of 1.5%. Could this all help shift the psychology of the market? The US$ Index broke support just below 103 and also broke under 102, closing at 101.70. Support looms just below. But a break under 101 could send the US$ Index down to 98/99 support. Final support is around 98 and a breakdown under that level could signal a bear market for the US$ Index. To the upside, only a return over 104 would suggest to us that we were in the process of testing the recent high at 105.07. The daily trend for the US$ Index has turned neutral from up. Another down week could turn the trend down.
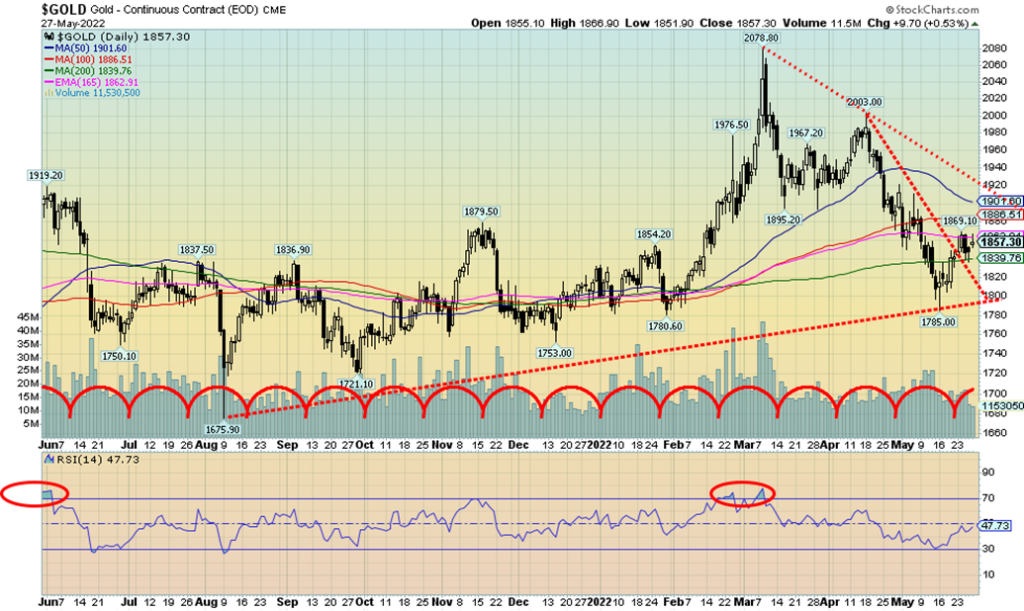
Gold gained 0.8% this past week, the second consecutive weekly rise. Gold broke its steep down trend line from the recent high at $2,003 and we did close over the 200-day MA, a positive development. Silver gained about 2.0%, platinum was up 0.2%, palladium jumped 5.9%, while copper was up 0.7%. The gold stocks improved as well with the Gold Bugs Index (HUI) up 1.6% and the TSX Gold Index (TGD) gaining 0.4%.
Gold’s rise was spurred on by a weakening US$ Index, some easing of inflation concerns, falling U.S. treasury yields, and a strong performance by the stock market this past week. It also eased some concerns about the Fed hiking interest rates, but many still expect 50 bp hikes in both June and July. Despite the nice rise, we still have some further resistance at the $1,885 level and we still need to clear above $1,900/$1,920 to confirm that a low is in. Indicators are turning up. Gold’s recent low at $1,785 held a support zone and we were nowhere near the August low of $1,676.
Still, we would not consider ourselves out of the woods just yet. Following gold’s low in August 2021 at $1,676, gold chopped around for the next few months with a series of ups and downs but a rising low. Gold finally broke out in February for that strong up move to $2,078, just shy of the August 2020 high of $2,089. As we noted last week, that could be a double top and, if correct, any rally now could fail the previous $2,078 high. We could then fall to new lows below $1,676 and make the 7.8-year cycle low and the 23.5-year cycle low. But that could be months away. In the interim, we need to take advantage of this potential move, but the best part of the move may not get underway until July or even August.
We are buoyed by the fact that we move into a seasonally strong period for gold, but that doesn’t get underway until at least July. Hence our thoughts of chopping around through June. Gold’s close this past week at $1,857 was positive and any close over $1,848 by May 31 would help give us a monthly reversal signal. It was a good week for gold and helped push gold positive once again in 2022. However, gold has a lot of work to do to convince that our low is in. Major support remains at around $1,750. We don’t expect to test that.
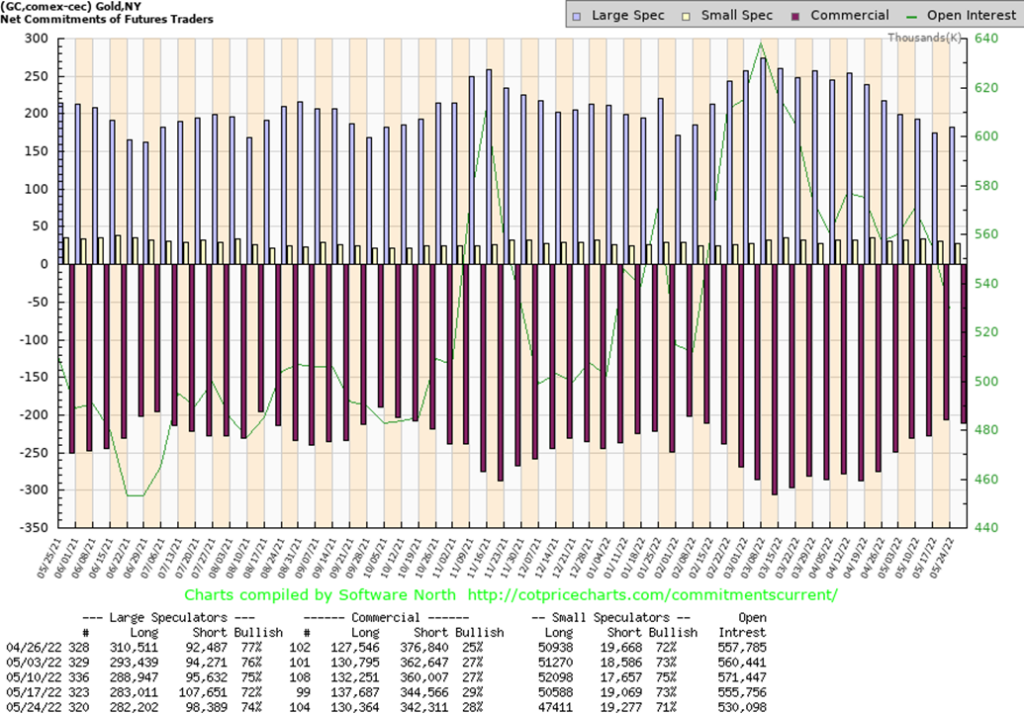
The gold commercial COT (bullion companies and banks) slipped to 28% from 29% this past week as long open interest fell over 7,000 contracts while short open interest dropped only just over 2,000 contracts. We were surprised to see the drop in the longs, considering the up week for gold. Overall open interest fell over 25,000 contracts. The large speculators COT (hedge funds, managed futures, etc.) rose to 74% from 72% as their long open interest fell about 1,000 contracts but short open interest fell over 9,000 contracts as the large speculators appeared to be covering shorts.
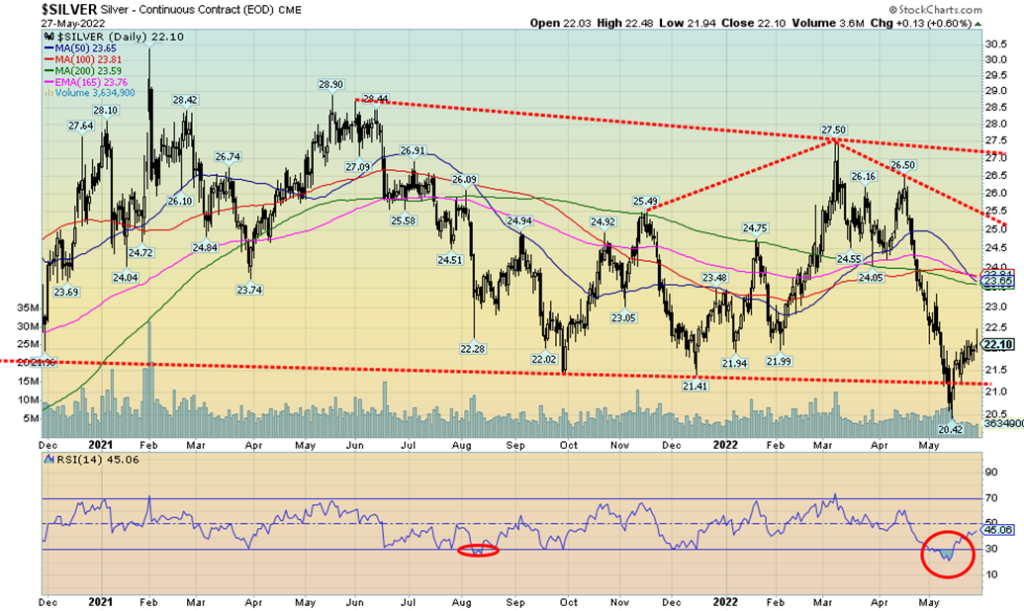
Silver followed gold higher this past week—or was it the other way around? As noted with gold, a weakening U.S. dollar, some signs that inflation may be abating, and a drop in U.S. treasury yields were positive for gold and silver this past week. Silver gained about 2%. Not quite the stellar gains seen in the stock market, but gains nonetheless and the second consecutive week to the upside. Silver still needs to confirm a low for us and we won’t see that until we at least close over $23 and preferably over $24. Silver breaks out over $25.50 and firmly breaks out over $27. A long way to go. The collapse to $20.42 diverged nicely with gold as silver saw new lows for this move but gold did not. Any pullback now that takes silver back under $21 would set up a move to new lows below $20.42. In the interim, we do at least have near-term buy signals in place and the best moves may be yet to come. Fibonacci retracement levels for the recent down move from $27.50 are 38.2% – $23.12, 50% – $23.96, and 61.8% – $24.80. Above $25.83 new highs above $27.50 are probable.
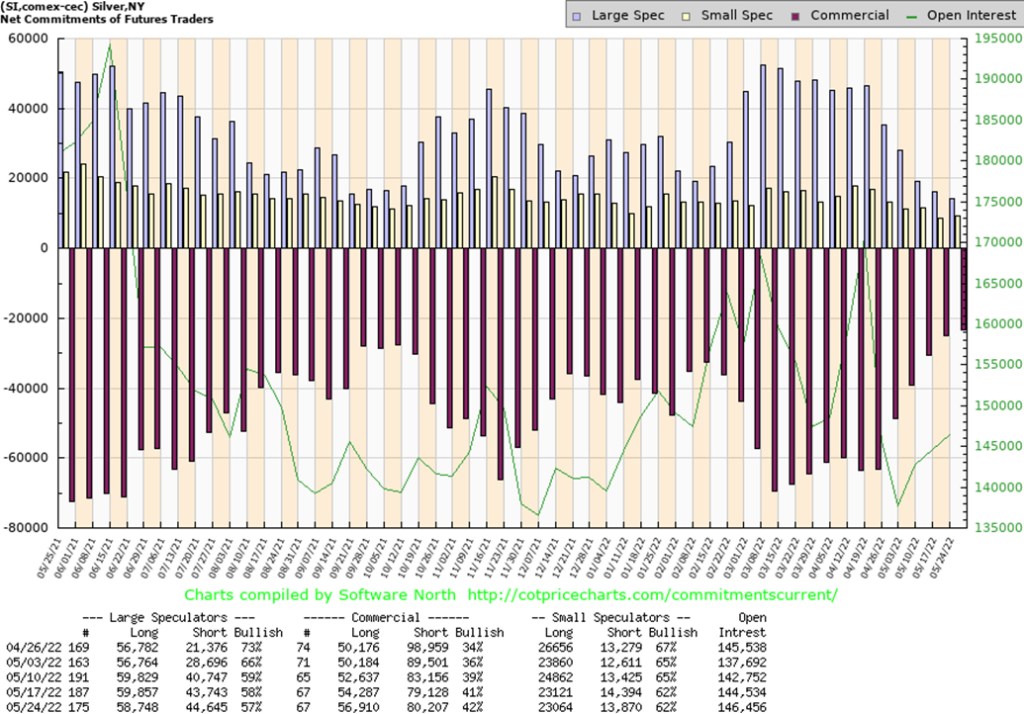
Another improvement in for the silver commercial COT, jumping to 42% from 41%. It was mostly because of a rise of about almost 3,000 long contracts even as short contracts also rose up about 1,000. The large speculators COT slipped again to 57% from 58%. Overall open interest rose about 2,000 contracts on a positive week for silver. Overall, we continue to view the silver COT as positive.
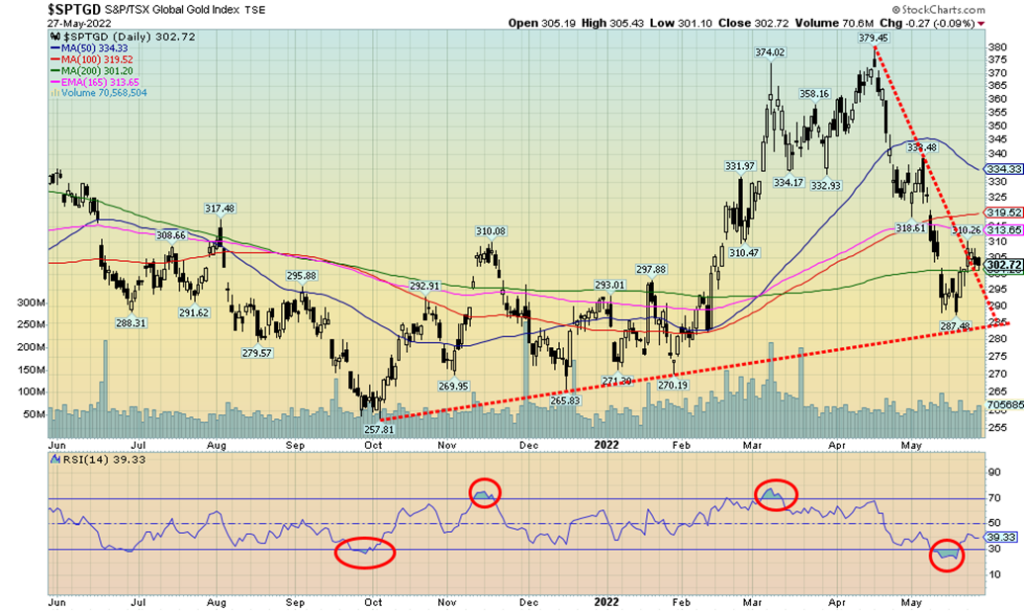
Gold stocks appear to be breaking out of the steep downtrend. This past week the TSX Gold Index (TGD) gained 0.4% while jumping over the downtrend line and also closing back over the 200-day MA. The Gold Bugs Index (HUI) gained 1.6%, breaking out over its steep downtrend line, but did not close back over its 200-day MA. Both indices returned into the plus column for 2022 with the TGD up 3.6% and the HUI up 0.6%. The Gold Miners Bullish Percent Index (BPGDM) fell to 27.59 low but not quite in what we’d call bear territory under 25. For the TGD there is more important resistance to overcome above 320 and again above 335. Above 340 we would be leaving the bear move behind. Note how close the low came to touching that gentle uptrend line from the October low. The TGD was also rising out of deeply oversold levels. So, is this a rebound bounce, or the start of something more substantial? That cannot be determined just yet. While it is nice to have a small buy signal for the gold stocks, we’ll feel more comfortable that a low is in, clearing above at least 320. We could also go into a series of bounces as we did from October 2021 to late January 2022 before we suddenly burst higher, taking out the November 2021 high. Notice how in November 2021 we did break out over the 200-day MA only to see the TGD pull back then make a series of lower highs. The TGD then fully broke out in February. If something like that occurred, we could chop around here for the next month or so into July before making a final low either in July or by early August. Regardless of that, at least for the moment we believe the worst is over. If the broader markets continue to rise, that will help the gold stocks as well.
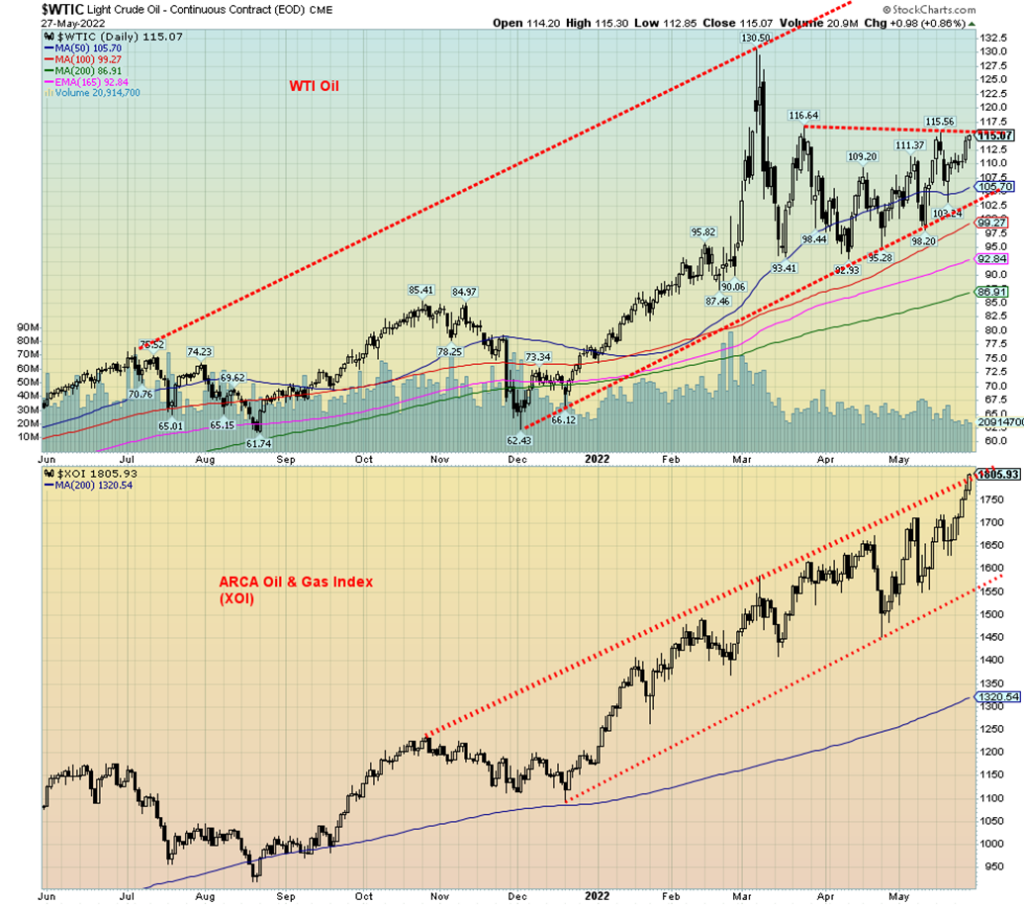
Rising demand, spurred on by signs that China is prepared to loosen restrictions, the onset of the summer driving season in the U.S., dwindling reserve inventories in the U.S., and continued signs that the EU is prepared to ban Russian energy products all had oil prices rising this past week. WTI oil rose almost $5 this past week or 4.3%. Add in the U.S. seizing two Iranian oil tankers in the Mediterranean this past week and putting significant downside pressure on talks with Iran to end sanctions and stop Iran’s nuclear program—and you have the makings of another potential supply squeeze that could send oil prices even higher.
Natural gas (NG) rose 8% to 52-week highs. The energy stocks were also up with the ARCA Oil & Gas Index (XOI) up 8.6% and the TSX Energy Index (TEN) gaining 6.8%. Both indices made fresh 52-week highs. WTI oil
appears poised to break out over resistance. A firm move over $116 could project up to $150. Above $122 new highs above $130.50 are highly probable. The XOI appears to be at the top of a channel so it could pull back this week and still be in a bull channel. The XOI could also bust out of the channel, demonstrating it might be taking off on a runaway move.
Either way, the potential for increasing demand, coupled with squeezes on supply, could continue to put upward pressure on oil prices. The question is, how is everyone faring with prices at the pump?
Copyright David Chapman, 2022
__
(Featured image by sergeitokmakov via Pixabay)
DISCLAIMER: This article was written by a third party contributor and does not reflect the opinion of Born2Invest, its management, staff or its associates. Please review our disclaimer for more information.
This article may include forward-looking statements. These forward-looking statements generally are identified by the words “believe,” “project,” “estimate,” “become,” “plan,” “will,” and similar expressions. These forward-looking statements involve known and unknown risks as well as uncertainties, including those discussed in the following cautionary statements and elsewhere in this article and on this site. Although the Company may believe that its expectations are based on reasonable assumptions, the actual results that the Company may achieve may differ materially from any forward-looking statements, which reflect the opinions of the management of the Company only as of the date hereof. Additionally, please make sure to read these important disclosures.
David Chapman is not a registered advisory service and is not an exempt market dealer (EMD) nor a licensed financial advisor. He does not and cannot give individualised market advice. David Chapman has worked in the financial industry for over 40 years including large financial corporations, banks, and investment dealers. The information in this newsletter is intended only for informational and educational purposes. It should not be construed as an offer, a solicitation of an offer or sale of any security. Every effort is made to provide accurate and complete information. However, we cannot guarantee that there will be no errors. We make no claims, promises or guarantees about the accuracy, completeness, or adequacy of the contents of this commentary and expressly disclaim liability for errors and omissions in the contents of this commentary. David Chapman will always use his best efforts to ensure the accuracy and timeliness of all information. The reader assumes all risk when trading in securities and David Chapman advises consulting a licensed professional financial advisor or portfolio manager such as Enriched Investing Incorporated before proceeding with any trade or idea presented in this newsletter. David Chapman may own shares in companies mentioned in this newsletter. Before making an investment, prospective investors should review each security’s offering documents which summarize the objectives, fees, expenses and associated risks. David Chapman shares his ideas and opinions for informational and educational purposes only and expects the reader to perform due diligence before considering a position in any security. That includes consulting with your own licensed professional financial advisor such as Enriched Investing Incorporated. Performance is not guaranteed, values change frequently, and past performance may not be repeated.


PharmaMar Increases Profit by 64% in the First Quarter, Up To 2.3 Million
PharmaMar's profits rebound with a 64% increase to 2.3 million euros in Q1 2024 compared to the same period last...


Cannabis Reform in Belgium: What Changes Does the Latest Report Propose
Belgium faces challenges in drug policy, especially with cannabis. Recent Senate reports highlight flaws in the current system, urging reforms...


Druo Processes $50 Million in International Transactions
Druo, a Colombian fintech company, responds to the need for streamlined and cost-effective financial processes in the payments sector amid...


Grifols Announces Positive Results from Fanhdi Phase IV Study
Grifols reports positive results from its Phase IV study of Fanhdi for von Willebrand disease (VWD) treatment, showing safety and...


Ecomill Authorized to Operate Under the New EU Crowdfunding Regulation
Ecomill joins authorized crowdfunding platforms under European Regulation. Dedicated to energy transition and sustainability, it enables capital raising for renewable...
 |
|
 |  |
 |
|
-

 Crypto1 week ago
Solana Rolls Out First Update to Address the Problem of Failed Transactions
-

 Crowdfunding2 weeks ago
Crowdfunding to Support the Grande Teatro di Lido Adriano Was Launched
-

 Fintech6 days ago
Starting from 2025, Expected Revenues Will Exceed Investments in the Fintech Sector
-

 Business2 weeks ago
TopRanked.io Weekly Affiliate Digest: What’s Hot in Affiliate Marketing [CamSoda Affiliate Program]