Featured
What investors need to know about the coronavirus and the stock market
Coronavirus. Who suspected that was coming. Epidemics and even pandemics are a somewhat regular occurrence. A check of statistics shows that there has been at least a dozen that have had an impact worldwide since 1900. That’s at least one every 10 years. But what is the effect on markets? We have a look. But will coronavirus morph into a worldwide pandemic or eventually just stay an epidemic?
“Just when you thought it was safe to go back into the water…” along came coronavirus! With all due respect to the tagline from Jaws 2 (1978), coronavirus is not a great white shark. So, just what is coronavirus? Well, it is a virus, a member of the same family as the common cold, only deadlier. Earlier examples of the coronavirus family included both SARS and MERS. Maybe they’ll come up with an acronym for the current virus. And, like earlier viruses, it does have the potential to become a pandemic.
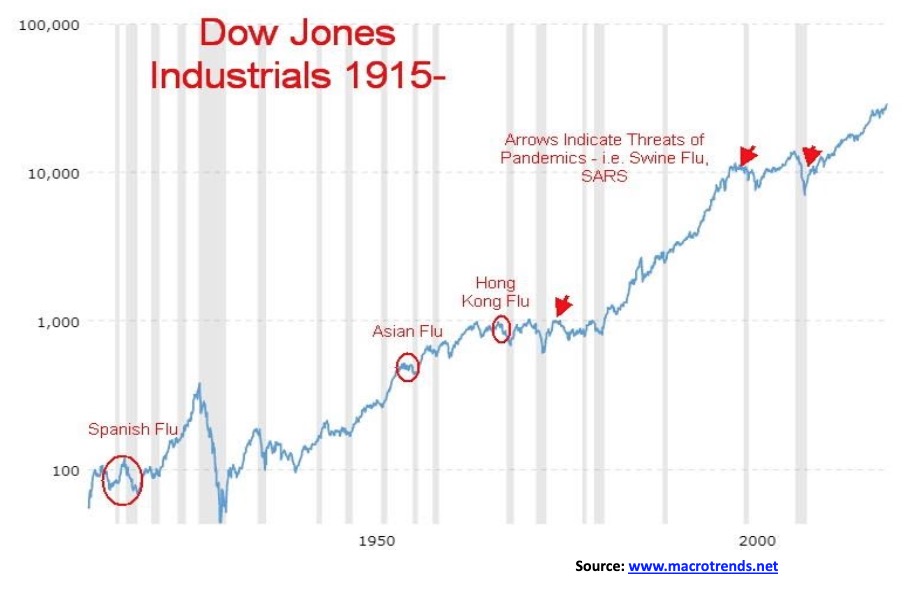
So, do investors have anything to worry about? As can be expected, the record is sketchy and it depends on how bad it gets. The current coronavirus is not yet a pandemic but it is threatening to become one. There have been very few pandemics over the past century. The worst was the Spanish flu of 1918–1920 that killed an estimated 50 million worldwide. The stock market, as measured by the Dow Jones Industrials (DJI), did lose 10% during that period, but it was uneven as the market rallied sharply into 1919 before collapsing into 1921. There was the post-World War I recession of August 1918–March 1919, followed by the depression of 1920–1921. The Spanish flu pandemic was not the major cause of the recession/depression but it definitely played a role because of the negative economic impact of so many coming down with the flu and the high death toll.
The only other two pandemics recorded in the past century were the Asian flu pandemic of 1957–1958 and the Hong Kong influenza of 1968. There was a recession from August 1957 to April 1958. The DJI fell roughly 14% during that recession. The stock market peaked in November 1968, but a recession never arrived until after the pandemic was over. It was known as the recession of 1969–1970 and the DJI fell about 31% from November 1968 to June 1970. But all that occurred after the pandemic was declared over and the pandemics were not a significant cause of the recessions.
The other major epidemics were the Swine flu epidemic of 1976 and the SARS epidemic of 2002–2003. There was also a Swine flu epidemic in 2009. One could also consider the HIV/AIDS crisis a pandemic. All had little or no strong influence on stock markets at the time. Unless this current coronavirus outbreak morphs into something bigger, the odds of it having a major long-lasting impact on stock markets are low.
However, there is no denying a potential negative impact. Asian stock markets have already fallen: China’s Shanghai Index is down 3.2%, Hong Kong’s Hang Seng is down 3.8%, the Singapore Straits has fallen 1.4%, and the Tokyo Nikkei Dow (TKN) is off 1%. Transportation stocks are taking a beating as travel is being restricted. The Dow Jones Transportations (DJT) is down 1.9% while WTI oil has fallen 7.5% and Brent Crude is off 4.3%. Lower oil prices will benefit motorists. Given the crisis, they may be thankful that Chinese exchanges are closed this coming week and the Hong Kong exchange is closed until Wednesday.
With restrictions on travel growing, hotel and cruise ship stocks are down. There is the challenge of trying to contain the spread of the virus as China has taken the unprecedented step of shutting down an entire city of 9 million, Wuhan, along with most of the region around it, an area with upwards of 40 million people. Last we read some 65 million are apparently under lockdown. That’s quite a feat to maintain. China Disneyland has been shut down and the Chinese Lunar New Year celebrations are on hold or canceled. The impact on the travel industry has been immediate as transportation stocks have already fallen.
The good news is that the World Health Organization (WHO) has not yet named it a global health emergency. This may yet turn out to be temporary disruption or, in the end, will be no worse than what occurred during the SARS crisis. The virus has seen confirmed cases thus far in 11 countries—led by China, but also including Taiwan, South Korea, Japan, Thailand, Vietnam, Australia, Nepal, U.S., Saudi Arabia, and France plus a presumed case in Canada. That total is expected to grow. Still, the authorities are dealing with a new type of coronavirus, that is yet unknown to science.
Given all the disruption caused by coronavirus, one tends to forget that China is still dealing with the revolt in Hong Kong and the unresolved trade war with the U.S. The so-called phase 1 trade deal is merely a band aid, not a final solution. Put everything together and China’s GDP numbers for Q1 are sure to take a hit—and that, in turn, could impact the rest of the world.
Equity markets can react in unknown ways to pandemics and threats of them. Panic could set in concerning the spread of coronavirus. That panic then spreads to the equity markets. In the cases over the past century, other factors played a role in whether a market went up or down. It is difficult to mitigate the potential impact of pandemics or war for that matter. On the other hand, solutions could be found and the crisis slowly winds down on its own. Markets tend to react negatively at first as in a knee jerk reaction. As more information comes out, the market could begin a more sustained sell-off. If the crisis appears under control the markets would rebound. The problem is, the markets are coming down from record levels, overvalued and with extreme bullish sentiment. That’s not a good sign.
The costs to the global economy are also unknown. The SARS crisis, as an example, cost the global economy an estimated $40 billion with the biggest impact on the travel industry, retail trade and lost productivity. In terms of fatalities and deaths, the current crisis is small so far. With SARS, the death toll was only around 800 worldwide. Compare that the millions who have lost their lives through AIDS or malaria or, more dramatically, the upwards of 50 million lives lost during the Spanish flu pandemic. Thousands of jobs were lost, although many of them were temporary. Many who came down with SARS also recovered fairly quickly. Does the disease attack primarily the young and the elderly, or does it attack the most economically active age group of 15–55? All of these are considerations.
Over the long term, the market goes up. But we live in the here and now. And in the short term at least, there could be a bumpy ride.
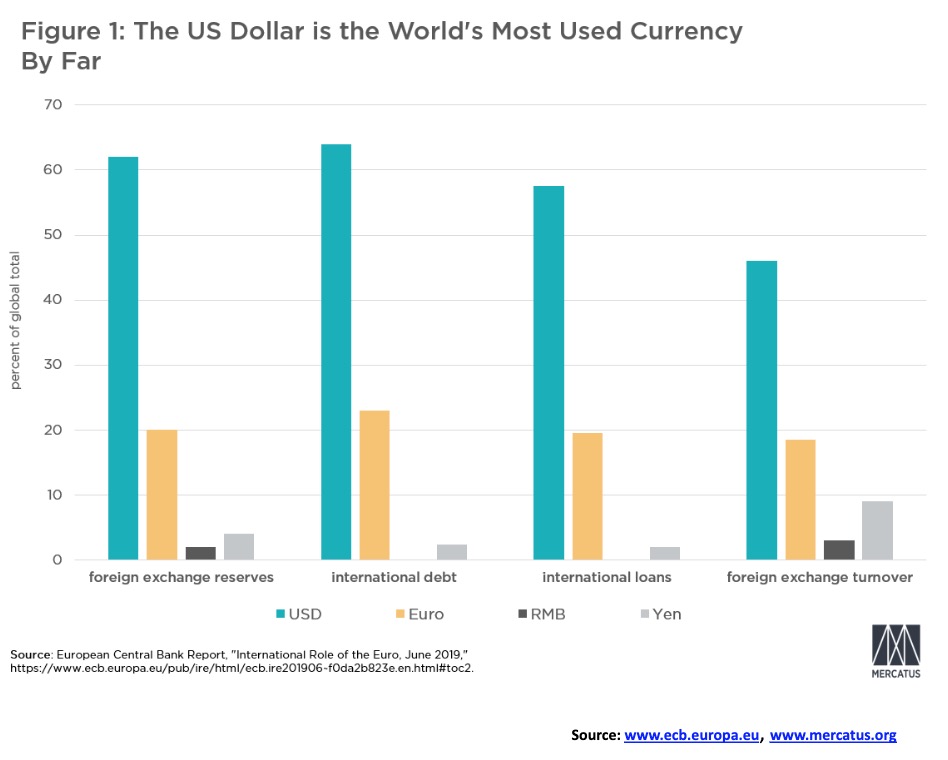
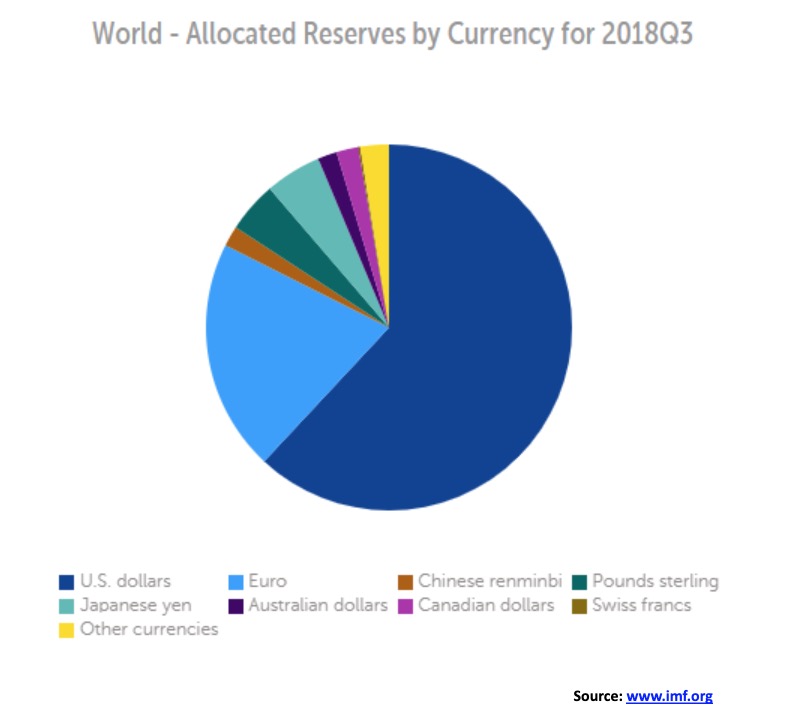
The U.S. dollar remains the most used currency in the world. When they talk about U.S. dollar hegemony, there is actually something to back it up. The U.S. dollar makes up 50–80% of invoiced world trade. There is an estimated $28 trillion of U.S. dollar debt held outside the U.S. 70% of the world’s currencies are tied to the U.S. dollar. U.S. dollar securities make up almost 63% of the reserve currencies held by central banks. The euro is a distant second, making up about 20%. Central banks hold more Canadian dollars as foreign exchange reserves than Chinese yuan 2% vs. 1.2%. The world’s largest payment system is the Society for Worldwide Interbank Financial Telecommunications or simply SWIFT. The SWIFT network has more than 11,000 financial institutions in more than 200 countries and they exchange over 32 million transactions every day.
SWIFT’s headquarters are located in Belgium and its chairman is from Pakistan. Since it is a co-operative, its members are the owners. But—and herein lies the controversy—it is effectively controlled by the U.S., thus enabling the U.S. to bar financial institutions and countries from using SWIFT if they apply sanctions against them.
For sure, there are many benefits besides being the global medium of exchange. It helps the U.S. as well, giving them cheaper imports and lower financing costs. The U.S. dollar and its assets led by U.S. treasuries are the “go to” purchase when one is seeking safety. That helps keep the value of the U.S. dollar up. But the desire for U.S. dollar assets and the dominance of the U.S. dollar keeps the world somewhat hostage to the Fed and its policies. With a high amount of U.S. dollar liabilities being held abroad, they are vulnerable to both Fed policies and a strong U.S. dollar. This is exacerbated if their revenue is in a weak currency but their liabilities are in U.S. dollars.
The dominance of the U.S. dollar is being challenged. China’s massive One Belt, One Road (OBOR) initiative is fueling megaprojects around the world—in Asia, Africa, South America, and as well Eastern Europe, Indonesia, and even Mexico and the West Indies. China is spreading everywhere. In 2000, the U.S was the major trading partner of over 80% of countries. By 2018 that number had fallen to 30%. China is now the major trading partner for 128 of 190 countries. And we wonder why the U.S. started a trade war with China in January 2018 as both countries are in a battle effectively for global trade and economic dominance.
China has also initiated a challenge to U.S. dominance of global financial institutions such as the International Monetary Fund (IMF), the World Bank (WB), and the Asian Development Bank (ADB). China’s answer to the ADB is the Asian Infrastructure Investment Bank (AIIB). China was also the leader of the BRICS (Brazil, Russia, India, China, South Africa) in the creation of the New Development Bank (NBD) and the Contingent Reserve Agreement (CRA), all designed to allow them to work outside the control of the U.S.-dominated WB and IMF.
There is growing trade and settlement in Chinese yuan. China now deals with a number of Asian countries and Russia in Chinese yuan and in the case of Russia also Russian rubles. China and others are setting up payment systems to rival SWIFT that will allow them to escape U.S. dollar hegemony.
Oil is still priced in U.S. dollars and requires settlement in U.S. dollars, but that is being challenged as well. Iraq and Libya both tried to challenge that system, as did Syria, later. Russia is demanding payment for its oil in euros or rubles. Iran has tried to break out of the U.S. dollar for its oil and natural gas. Is it any wonder then that many are tied to U.S. invasions or sanctions? Iraq, Libya, and Syria tried to ditch the U.S. dollar. They were invaded or, in the case of Syria, the U.S. supported the revolt against the regime of Bashar Assad.
The U.S. Treasury Department, the Commerce Department, and the State Department sanction or embargo more than 30 countries including Afghanistan, Belarus, Burundi, Central African Republic, China, Ivory Coast, Cuba, Cyprus, Democratic Republic of the Congo, Eritrea, Fiji, Haiti, Iran, Iraq, North Korea, Syria, Sudan, Venezuela, Belize, Bolivia, Comoros, Equatorial Guinea, Laos, Gabon, Libya, Mauritania, Nicaragua, Papua New Guinea, Somali, Russia (Crimea), Rwanda, South Sudan, Ukraine, Yemen, and Zimbabwe.
The level of sanctions varies, with severe sanctions and a near-total embargo against Iran and North Korea. Not all are related to oil and attempts to the ditch the U.S. dollar, but it is not a coincidence that many are.
Putting all this together, it is probably no surprise that the U.S. dollar is overvalued. This results in persistent and large trade deficits. It was ironic, as the trade deficit widened even as trade wars were initiated against China and others. Because of the demand for U.S. treasuries, it results in a persistent and widening budget deficit. It also encourages a higher degree of leverage in the U.S. economy. Oddly enough, the U.S. dollar also acts as a store of value, a medium of exchange, and a unit of account. It sounds odd calling the U.S. dollar a store of value, but consider that when trouble hits a foreign currency the “go-to” currency is the U.S. dollar. Real estate and gold also act as a store of value. In the case of gold, no wonder many accuse the Fed, through the bullion banks, of trying to suppress the value of gold. Its rise is a challenge to the supremacy of the U.S. dollar. The U.S., as a result, has to protect the value of the U.S. dollar as the world’s reserve currency and the world’s most demanded currency. And it seems, by any means, possible. No wonder the U.S. is considered the Saudi Arabia of money.
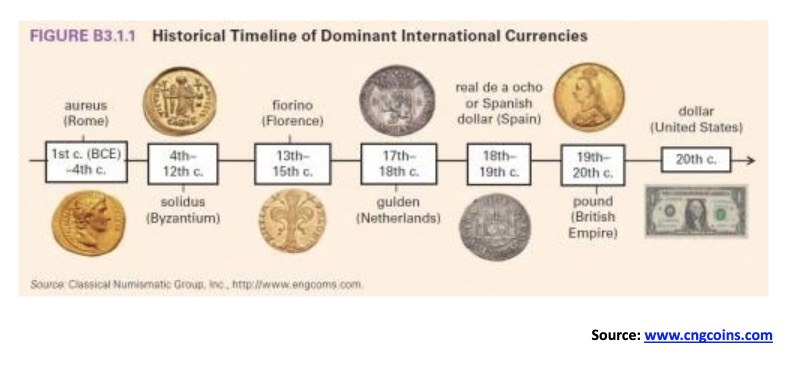
No currency lasts forever as the world’s reserve currency. Over the centuries, what would be considered the world’s reserve currency has varied depending on what country or empire is dominant. Probably the first dominant currency was the silver drachma of ancient Athens (Greece). It was followed by the gold aureus and silver denarius of Rome. But empires come and go. As the Roman empire disintegrated, the gold aureus was replaced by the gold solidus and the silver denarius disappeared all together as the currency was debased time and time again. The gold solidus continued as the dominant currency of trade with the rise of the Byzantine empire out of the ashes of the Roman empire. The Arab dinar largely replaced the solidus by the 8th century, although the two did coexist. By the 13th century, the fiorino of Florence became the dominant trade currency, to be replaced by the Venetian gold ducat by the 15th century. The Dutch Gulden became dominant in the 17th and 18th centuries alongside the Spanish real, given the rise of the Dutch trading empire and the Spanish empire in the Americas. With the rise of Great Britain in the 18th century, the British gold sovereign became dominant. It lasted into the 20th century and was eventually supplanted by the U.S. dollar after World War II. If one looks back in history, the rise and fall of dominant currencies was also accompanied by wars as the dominant currency of the day fought to maintain its reign. But eventually they all fell. What fate lies for the U.S. dollar?
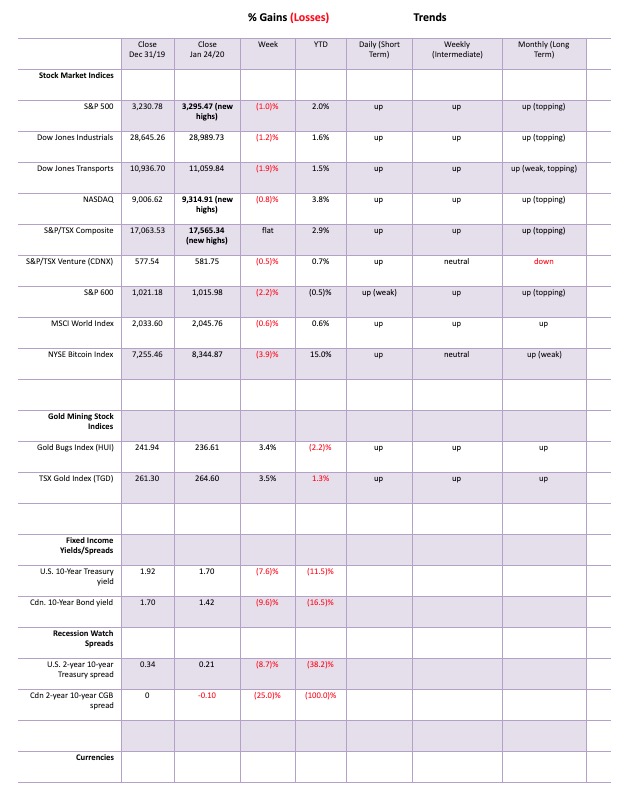
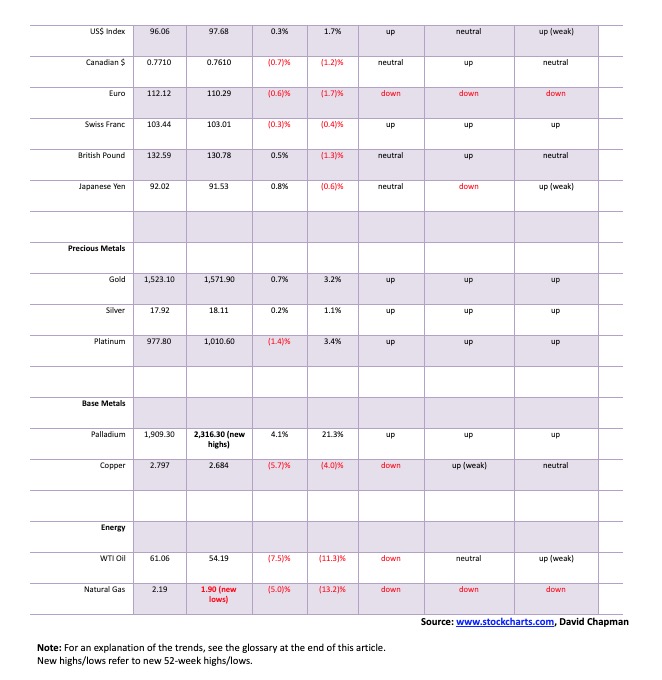
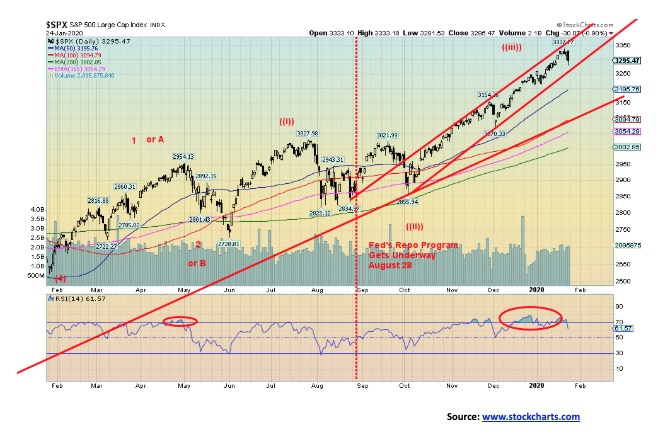
Is the top in? It is a question that has now been raised given the reaction to the coronavirus crisis that broke this past week. Its impact on the travel and leisure industry and retail along with the Far East markets also roiled North American markets. The S&P 500 classically made yet another all-time high this past week and closed lower, thus putting in a reversal week. It was not, however, a key reversal week as the S&P 500 did not take out the previous week’s low and close under that level. Still the S&P 500 lost 1.0% on the week. The Dow Jones Industrials (DJI) was down 1.2% and did not make a new all-time this past week, a divergence with the S&P 500. The NASDAQ also made a new all-time high and closed lower down 0.8%. The Dow Jones Transportations (DJT) were particularly impacted by the coronavirus, losing 1.9%. The S&P 600 small cap was down 2.2%. We note that the Dow Jones Utilities (DJU) also made a new all-time high and closed up 2.6% on the week. The NASDAQ 100 and the S&P 100 (OEX) also made new all-time highs. The S&P 400 (mid caps) did not, losing 1.5% on the week. The Wilshire 5000 hit 34,000, making a slight new all-time high but closed down 1.1%. Neither the NYSE or the AMEX made new all-time highs and the AMEX fell 3.5%.
Markets were mixed elsewhere. In Canada the TSX Composite was flat on the week while the TSX Venture Exchange (CDNX) lost 0.5%. The MSCI World Index fell 0.6%. In the EU, the London FTSE fell 1.3%, the Paris CAC 40 was off 1.3% after making new all-time highs, and the German DAX rose 0.4% making new all-time highs. In Asia, China’s Shanghai Index (SSEC) was down 3.7% and is closed all next week because of the Chinese Lunar New Year, while the Tokyo Nikkei Dow (TKN) fell 0.5%. The Hong Kong Hang Seng lost 3.8% while the Singapore Straits dropped 1.3%. Coronavirus does have an impact. But, as we note, if the problem were to dissipate the markets would bounce back and probably make new highs again.
Despite the negative week, the S&P 500 hasn’t given us a firm sell signal—yet. There were sell signals; however, they may only be signifying a temporary top. A break under 3,200 would be confirming the top. A break under 3,160 and especially under 3,100 would indicate that the decline could be steeper. A breakdown under 3,000 could see us enter a bear market. However, it would take a decline to under 2,670 to have the full definition of a bear market as the S&P 500 would be down 20% at that point.

Here is a long-term chart (20 years) of the S&P 100 (OEX)/S&P 600 (SML) ratio. The OEX 100 is an index of stocks from the S&P 500 that are the largest stocks by market capitalization and covers a broad range of industries. The S&P 600 is an index of small cap stocks with a market capitalization between $450 million and $2 billion. From roughly 2000 to the 2008 financial crisis the market favoured small cap stocks over large cap stocks. Over the next several years the ratio bumped along, forming a rounded bottoming pattern. The ratio now appears to have broken out and is telling us that large cap stocks should be favoured over small cap stocks. What was surprising is that the period 2000 to 2009 was huge corrective period. Usually, under those circumstances, the large caps would be favoured. The period 2009 to present was a huge bull market, and usually in a bull market small caps are favoured—but not the case. Now large caps are being favoured. Hard trying to interpret this, but the suggestion seems to be that we could be going through a corrective period as we go forward.
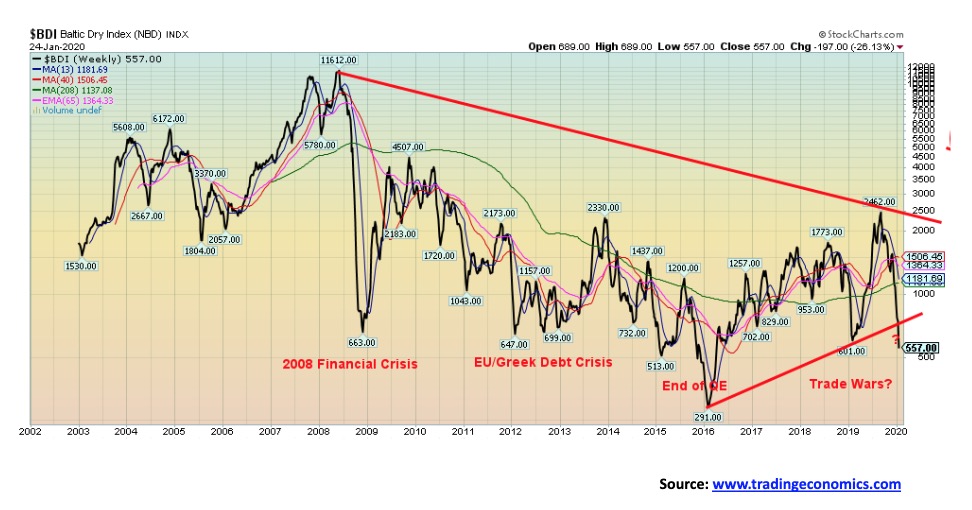
The Baltic Dry Index (BDI) has now broken down under a 3-year up-trend line. It also took out the low of February 2019, a level seen at the height of the trade wars between the U.S. and China. This suggests a potential test of the 2016 low. The Baltic Dry Index is a proxy for dry bulk shipping stocks and as a general shipping bellwether. A falling BDI suggests reduced world trade. Note how it topped way back in 2007. A reminder as well that last week we showed a chart of the Cass Freight Index. It had shown its worst drop for freight activity since the Great Recession of 2007–2009.
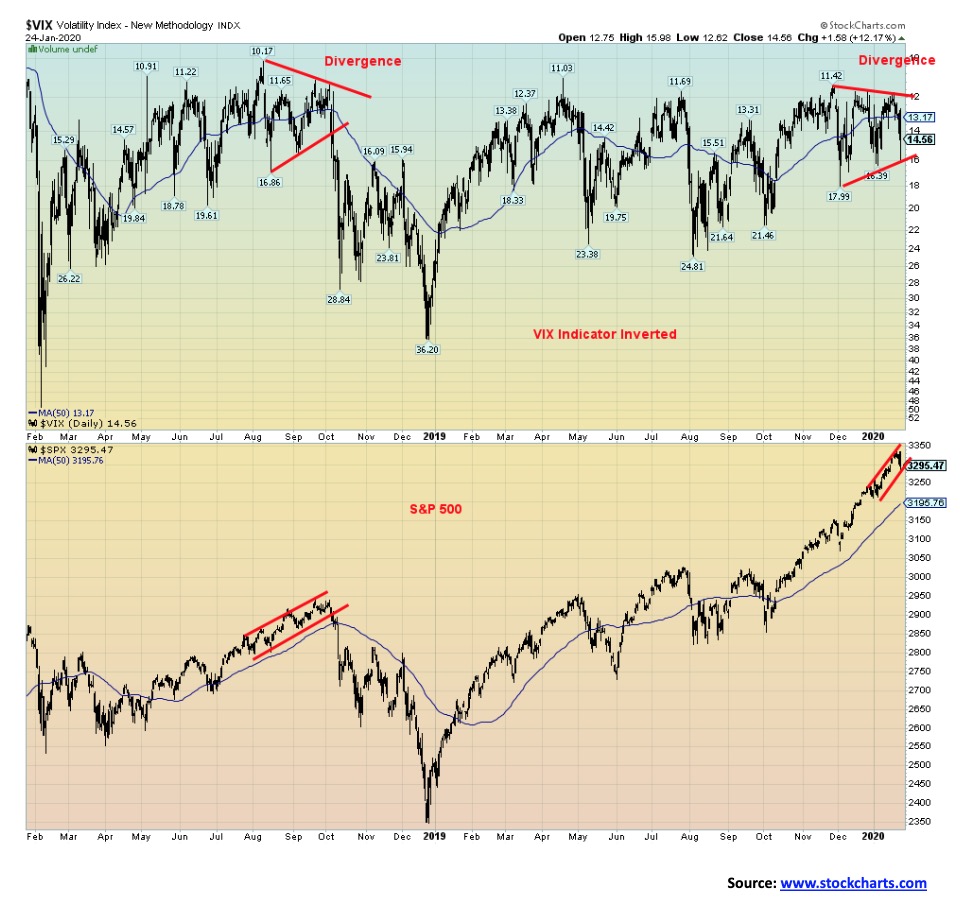
Could the volatility index (VIX) setup be the same as in 2018? In August 2018, the VIX indicator topped. Over the next two months the VIX indicator made lower highs. Once again, the VIX indicator topped in November 2019 and again over the next couple of months the VIX made lower highs. But in both cases the S&P 500 continued onward and upward, making new highs. What followed was the roughly 20% collapse from October 2018 to December in the first case. Could we soon be seeing similar action? The non-confirmation in both cases is very similar.
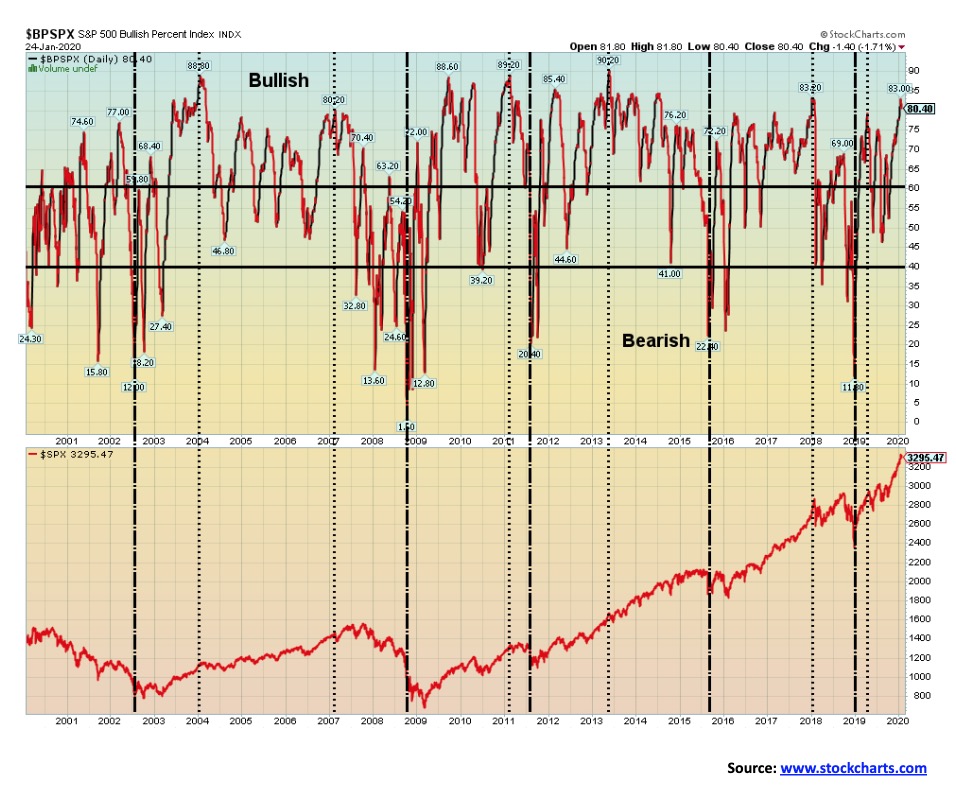
Every time the S&P 500 Bullish Percent Index (BPSPX) climbed over 80 it proved to be a top. The recent top saw the BPSPX hit a high of 83. Curiously this time the high was a lower high. Previous drops only proved to be temporary declines. But, looking back, we note that the biggest drops occurred when the BPSPX made a lower high following a series of highs.
As to other breadth and sentiment indicators, we note that the NYSE advance-decline has turned down this past week. But that was to be expected, given the decline in the market. However, no divergences have been seen, which in some respects keeps the market bullish. We also note that the McLellan Ratio Adjusted Summation Index (RASI) remains bullish, but the ARMS Index has quickly turned fearful. So, mixed indicators.
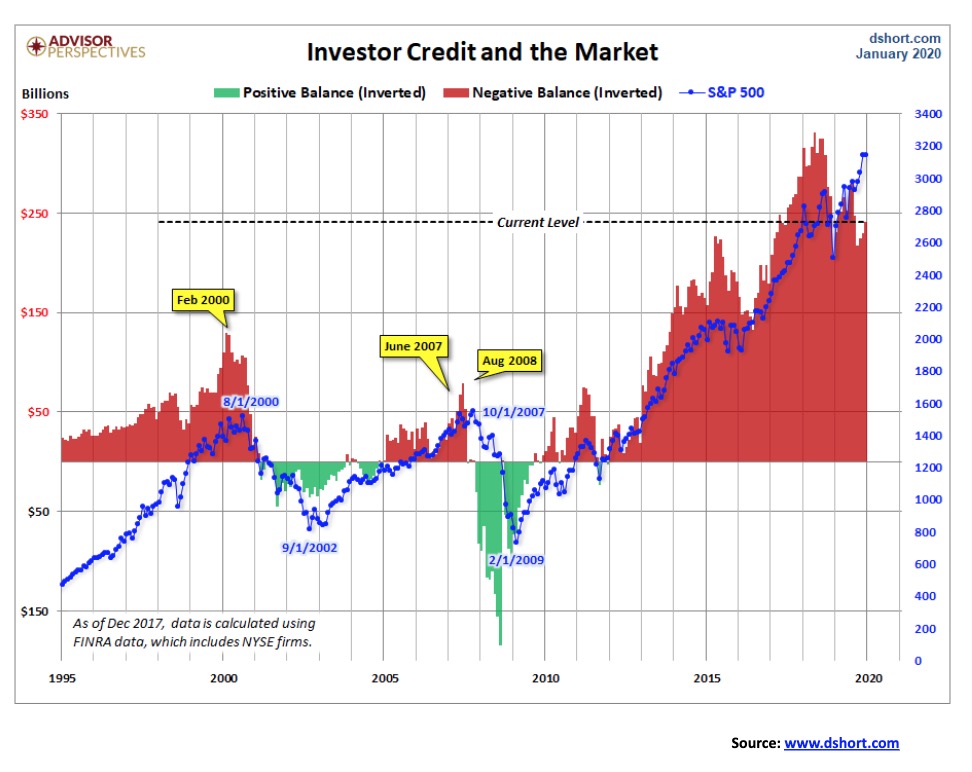
FINRA has released the new data for margin debt that goes through December 2019. In December margin debt is up 2.8% month-over-month. The chart above shows margin debt inverted or in this case credit balances inverted. The chart also notes key turning points. Margin debt is down from its highs but still remains at near record levels. Despite coming down the stock market kept going up. That’s a bit of an oddity as usually the two peak relatively close to each other. In 2000 the differential was six months. In 2007 the differential was two months. So far, this one peaked in December 2017. However, that coincided with a NYSE ending publication of margin debt. Data is now provided by FINRA so there may be some differences in methodology. Irrespective based on past history margin debt is exceedingly high.
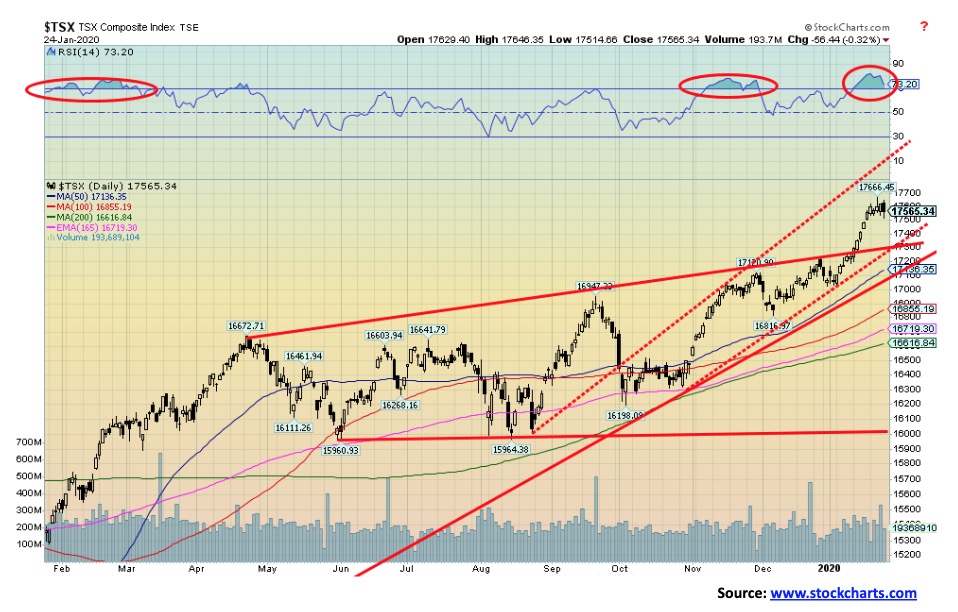
The TSX Composite made another new all-time high this past week, but ended up the week flat. The index also closed barely above where it opened on the week. Given the flat week, that was a better performance than the U.S. indices. Good results from golds and materials helped. The leader on the week was Golds (TGD), up 3.4%. The next best performer was Utilities (TUT), up 2.4%. Five of the TSX’s sub-indices were down on the week and one was flat. Leading the way to the downside was Health Care (THC), losing 5.5%. THC gave back most of the previous week’s gains. We do, however, view the health care sector positively going into 2020. The other losers were Energy (TEN), down 4.6%; Metals & Mining (TGM), down 1.0%; Industrials (TIN), off 0.7%; and Consumer Discretionary (TCD), down 0.4%. Financials (TFS) were flat on the week.
Five sub-indices saw new all-time highs. But not all held their highs. The winners making new all-time highs were Income Trusts (TCM), up 0.7%; Real Estate (TRE), up 0.6%; and Information Technology (TTK), up 1.6%. Industrials (TIN) and Financials (TFS) made all-time highs, but in the case of TIN closed lower on the week while TFS closed flat. Other winners included Telecommunications (TTS), up 0.8%; Consumer Staples (TCS), up 0.2%; and Materials (TMT), up 1.1%.
The TSX has support down to 17,500 but breaks down under 17,100. A major breakdown and bear market gets under 16,600. Given overbought indicators, high sentiment, and the background news, caution is certainly warranted.
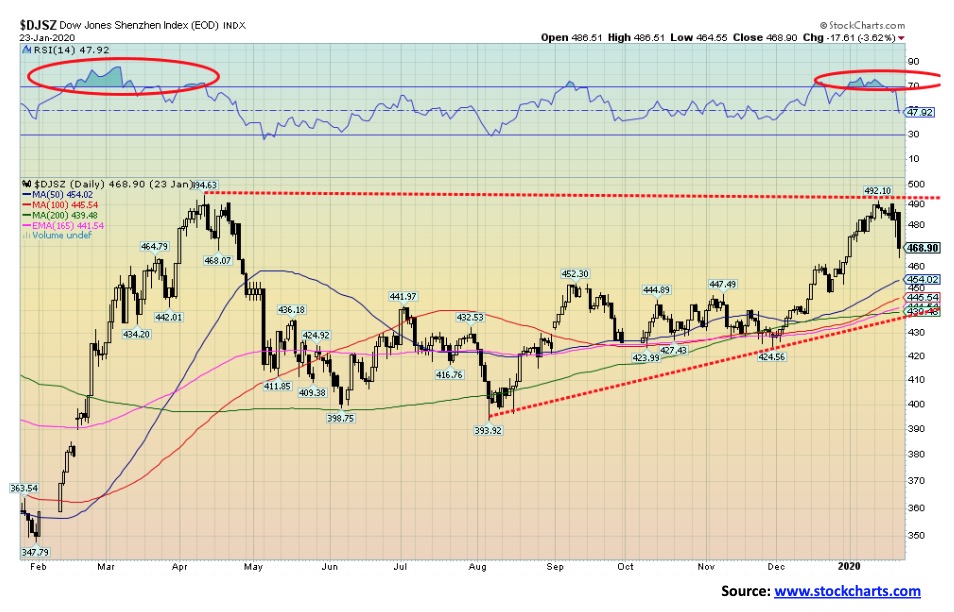
Above is the Dow Jones Shenzhen Index (DJS). We are using as a proxy for the China’s stock markets. The Index took a 3.6% hit on Thursday. Markets were closed Friday because of the Chinese Lunar New Year and will remain closed next week. That may be a good thing. On the week, the index was down 15.9%—ouch! Possibly it has made a double top. The major breakdown zone is seen at 435. A breakdown under that level could target as low as 335 taking us down to the lows seen October/December 2018. That’s a 29% decline from current levels. Something we will be keeping an eye on.
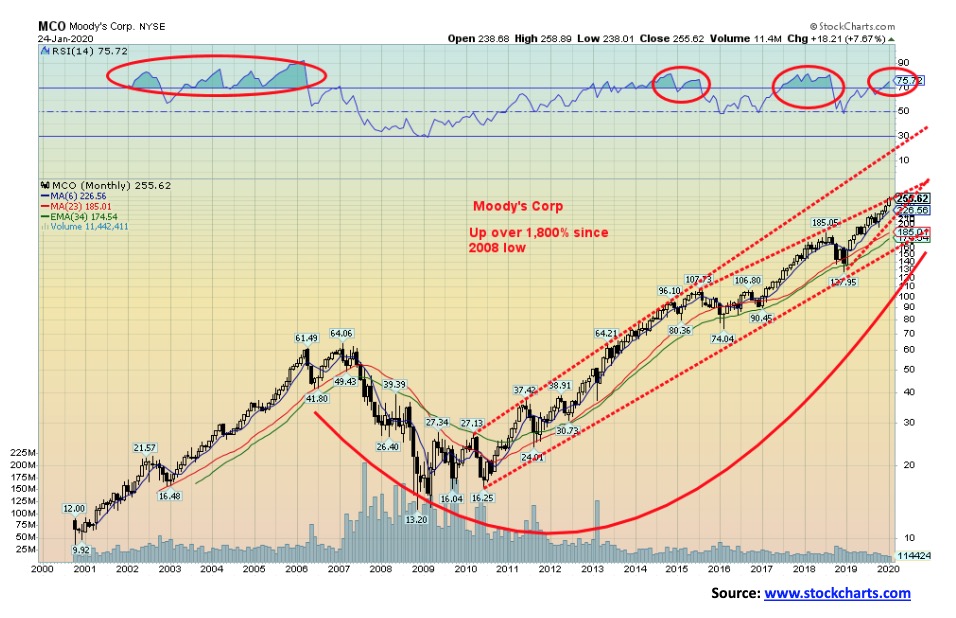
It’s a bird! It’s a plane! No, it’s Moody’s Corp (MCO)! What? This isn’t Google (GOOG), Netflix (NFLX), Apple (APPL), Amazon (AMZN) or even Facebook (FB). No one ever mentioned Moody’s in the same breath as the FAANGs. Moody’s is a credit rating agency. It does analysis on markets and economics. So, something appears wildly out of line if it looks like a FAANG stock. By comparison the S&P 500 is only up about 400% in the same time period. Moody’s trades at a tech like 37 P/E and has a market cap of $48 billion. It is amazing what years of QE and debt orgy can do even for a boring old business services company. But then its earnings have been consistently good. And it does pay $2/share dividend. But is that a giant ascending wedge pattern forming? And the RSI is once again over 70. Nonetheless it just keeps going up, up and up and up………
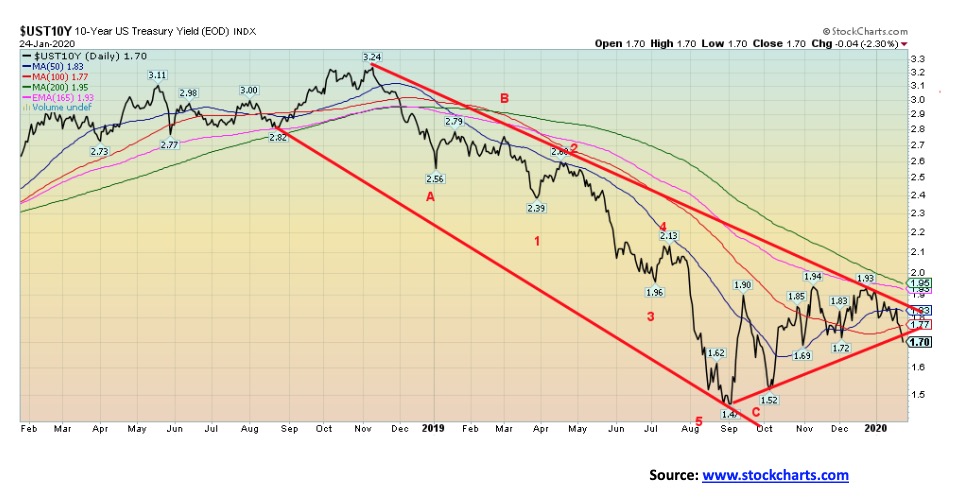
The U.S. 10-year treasury note appears to be breaking down for a potential test of the September 2019 lows. Since December, the 10-year has fallen from 1.93% to the current 1.70%. Bonds were influenced by the coronavirus as investors fled the stock market for the safety of U.S. treasuries. As a result, not surprisingly, the US$ went up. If the Fed was worried about rising interest rates that prompted its repo program, then we wonder—what will falling interest rates spark them to do? End the repo program? We doubt it. The Fed has become a defacto lender of first resort to the market, even though it is supposed to be a lender of last resort. We still don’t know why this program is being carried out. We can only speculate. The program could be addressing these problems: a) liquidity problems exist in the banking sector or a major bank is in trouble, particularly in the EU or Japan; b) banks have run low on reserves and the Fed is filling the breach; c) an effort is being made to put a damper on rising interest rates, as these would have a negative impact on the economy and cost the U.S government a lot more on $23 trillion of debt; d) this is a strategy to monetize the U.S. debt. It is noteworthy that the repo program is coming at a time when the stock market is at record levels and unemployment is at 50-year lows.
This past week’s drop in yield for the bond market appears to be almost solely coronavirus related. Depending on how the crisis plays out, we could see further drops in yield in the weeks ahead.
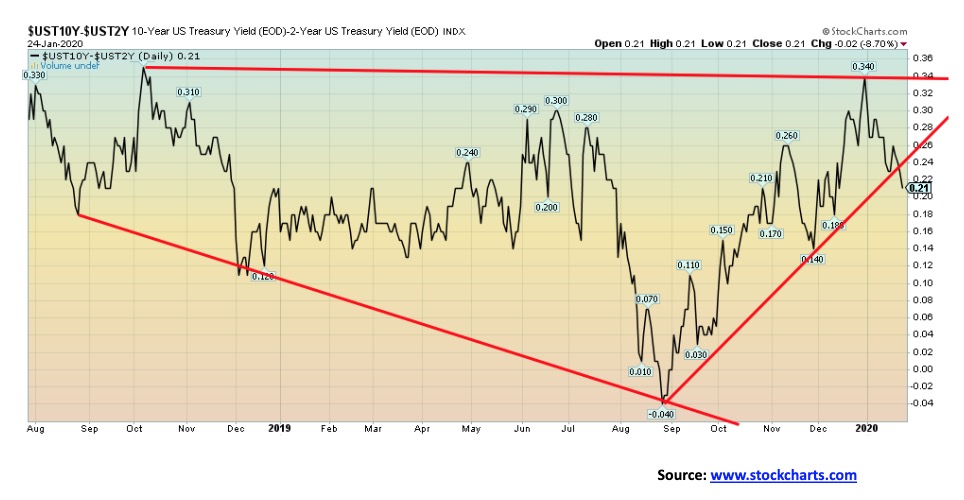
Our closely followed 2-year U.S. treasury note, 10-year U.S. treasury note spread (2–10 spread) slipped to 21bp this past week from 23 bp. It also broke an uptrend line from the August lows. As well, the 3-month U.S. treasury bill, 10-year U.S. treasury note spread (3M–10 spread) also fell to 16 bp from 28 bp. Could we be heading for a double dip of negative spreads? We’ll watch closely over the next few weeks. It could be another sign of a coming recession.
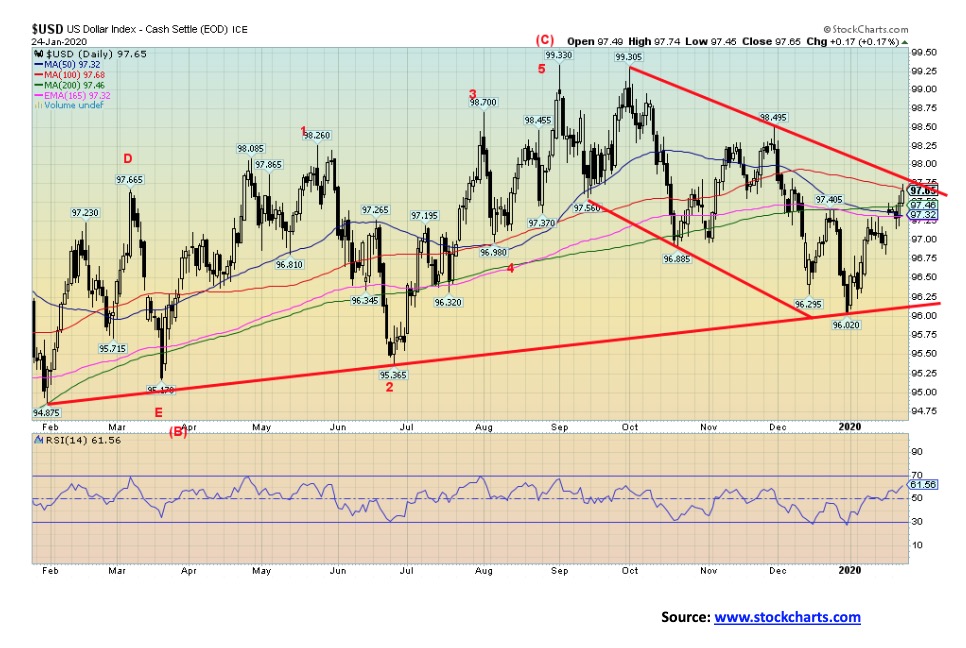
In a time of crisis, the U.S. dollar often becomes the go-to currency for safety. This past week, the US$ Index rose 0.3%. The euro fell 0.6%, the Swiss franc was off 0.3%, but the pound sterling rose 0.5% and the Japanese yen was up 0.8%. The Canadian dollar fell 0.7%. The US$ Index has reached to the top of a down channel. If the index can break through 98, then it is possible for the US$ Index to test up to previous highs at 98.50 and up to 99. The US$ Index may have formed a small head and shoulders bottom with the low at 96.02. The pattern has potential up to 98.40. Under 97.25 the US$ Index could start to decline once again. The breakdown point is under 96. If the down channel is correct, then the US$ Index should be limited from here.
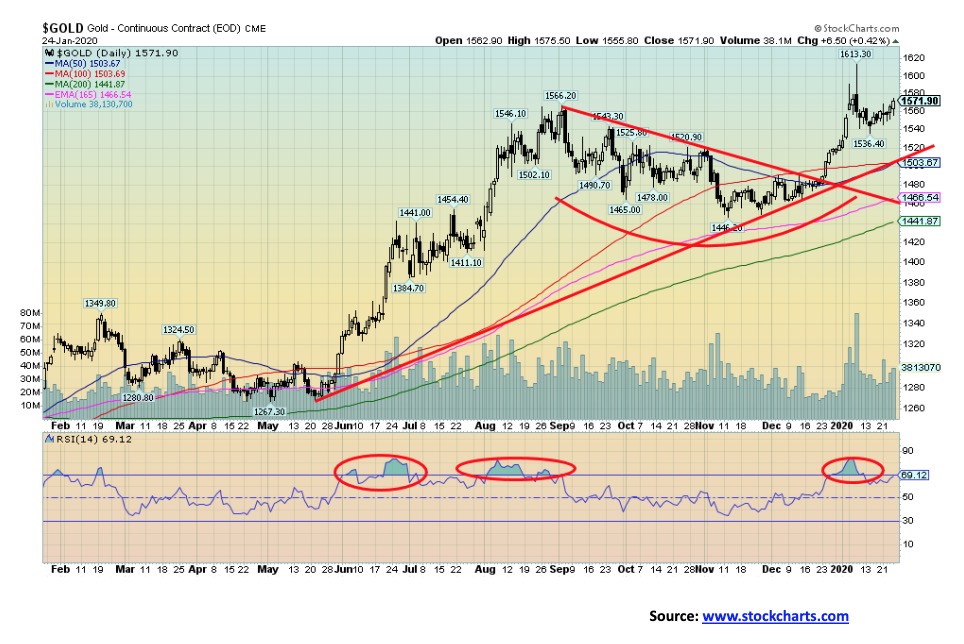
Gold as a safe haven benefitted from the breaking coronavirus crisis this past week. Gold gained 0.7% while silver was up 0.2%. Platinum lost, however, 1.4% while palladium continued its record ways, spiking up 4.1%. We continue to be very cautious about palladium at these levels, given extreme overbought indicators, the spike nature of the rise, and extreme speculation. Copper, however, was a victim of the coronavirus, falling a sharp 5.7% on the week on expectations of an economic slowdown and reduced demand for building. We have noted that gold needs to clear $1,610 to consider new highs above $1,613. That continues to stand. We have also noted that a close over $1,570 by month-end would be positive and keep the bull alive and well. Otherwise, we could see further corrective action. Any break back under $1,536 the recent low would signal lower prices with $1,500 the next key level of support. While we read numerous bullish forecasts for gold, we caution that we also read bearish forecasts for gold. Bears have cited that a break under $1,500 would target down to $1,460 next and even down $1,430 which was at one point a major breakout point. Gold is coming down from overbought conditions; however, we note the RSI is rising again and could soon be over 70.
We had some issue this week in obtaining a chart of the recent CFTC Commitment of Traders report (COT). We can report that the commercial COT for gold slipped to 27% this past week from 28%. However, it was accomplished with a drop of roughly 9,000 contracts for long open interest and a drop of short open interest of around 7,000 contracts. The large speculators COT (hedge funds, managed futures, etc.) was steady at 87%, although this is still rather high. Overall, the commercial COT remains negative for gold going forward. However, we have seen in the past the COT overwhelmed by a rising gold market.
Overall, we remain positive towards gold going forward. We have unfulfilled targets up to $1,725, based on the huge bottom pattern that formed between 2013 and 2019. The major breakout point occurred at $1,370 and again at $1,430. That is why a test of those levels would not be unusual. However, we would be cautious if we broke under $1,500.
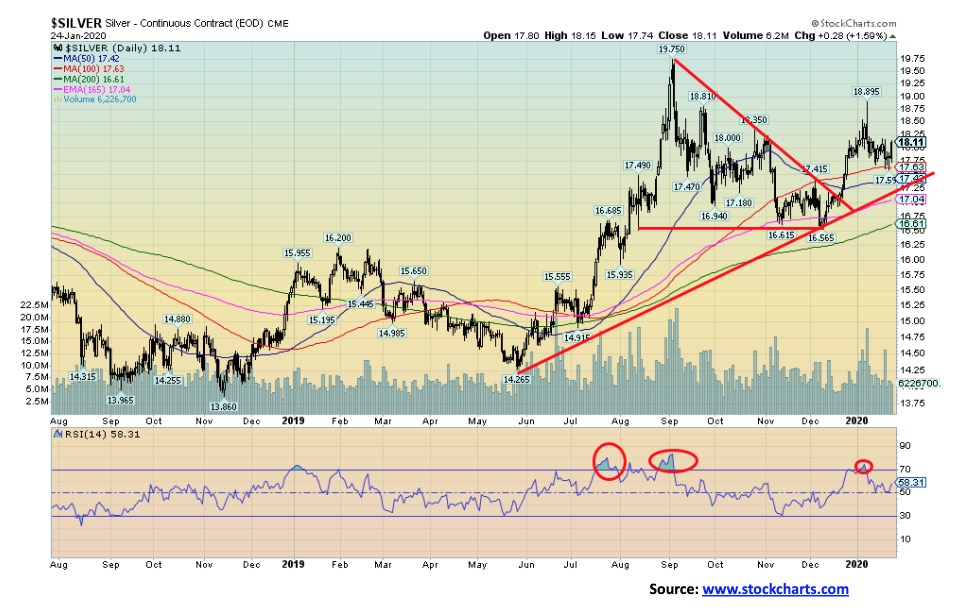
Silver had a volatile week, hitting as low as $17.59 before rebounding and closing up 0.2% at $18.11. Silver continues to underperform. We need to see silver regain first $18.35 and then move above the recent high at $18.90 to convince us that new highs could be seen above $19.75. While gold made new highs in the recent run-up, silver did not, which is a negative divergence. We like to see the two making new highs together. Silver found support at the 100-day MA and further support lies below down to $17. Silver is in trouble if we break back under $16.50. Silver never got as overbought as gold and this pullback has dragged the RSI back to a more neutral 58. We remain positive about silver, and our target of $20.50 based off the triangle that formed in August through December 2019 remains in place. However, we note our first breakdown would be under $17.50 and a more fatal breakdown would be under $16.50.
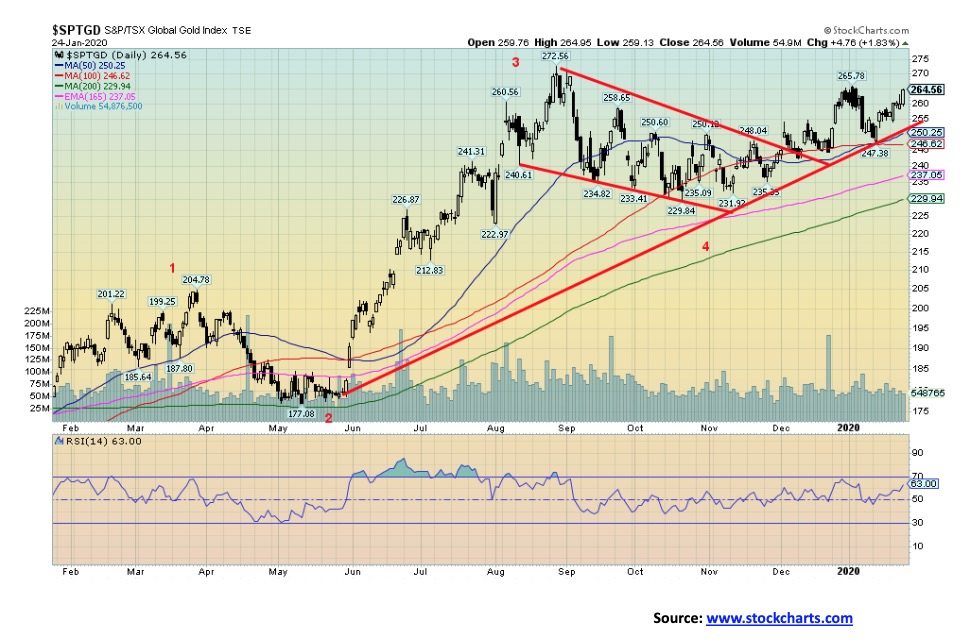
The gold stocks enjoyed a good week on the heels of the coronavirus as the TSX Gold Index (TGD) gained 3.5% and the Gold Bugs Index (HUI) was up 3.4%. The TGD is suggesting to us that we should see new highs, possibly this coming week. The HUI is about 10 points off its recent high. The difference is in the makeup of the two indices as, while there are many listed on both indices, each also has different ones. The strong performance of the gold stocks this past week is a positive development as they appear to be leading gold and silver. The TGD found support at the 50/100-day MAs. Further good support is visible down to 230, but below 225 a more serious decline could get underway. The gold stocks were strong performers in 2019. It is hoped that they can continue their strong run into 2020. The recent correction looked positive and the TGD broke out with potential targets up to 288, an additional 9% from current levels.
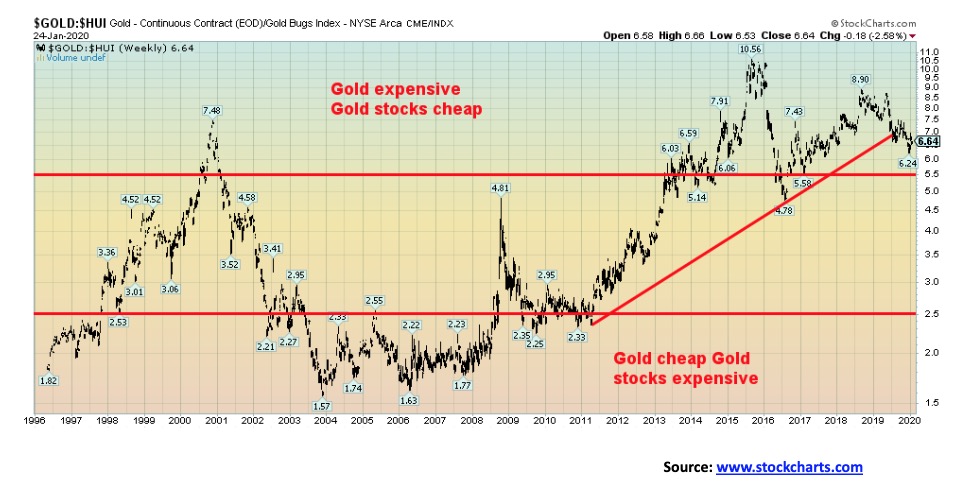
We find it amazing that gold stocks have remained so inexpensive for such a long period. Since 2014, the Gold/HUI ratio has traded in a range strongly suggesting gold is expensive compared to the gold stocks as represented by the HUI. Grant you, from 2002 to 2008 it was the opposite as gold stocks were relatively expensive vis-à-vis gold. So maybe it is rebalancing. The ratio has not spent a lot of time in more neutral territory. The ratio has improved, down from its high of 10.56 to current levels at 6.64, but we remain well above the lows. Gold stocks remain cheap vis-à-vis gold.
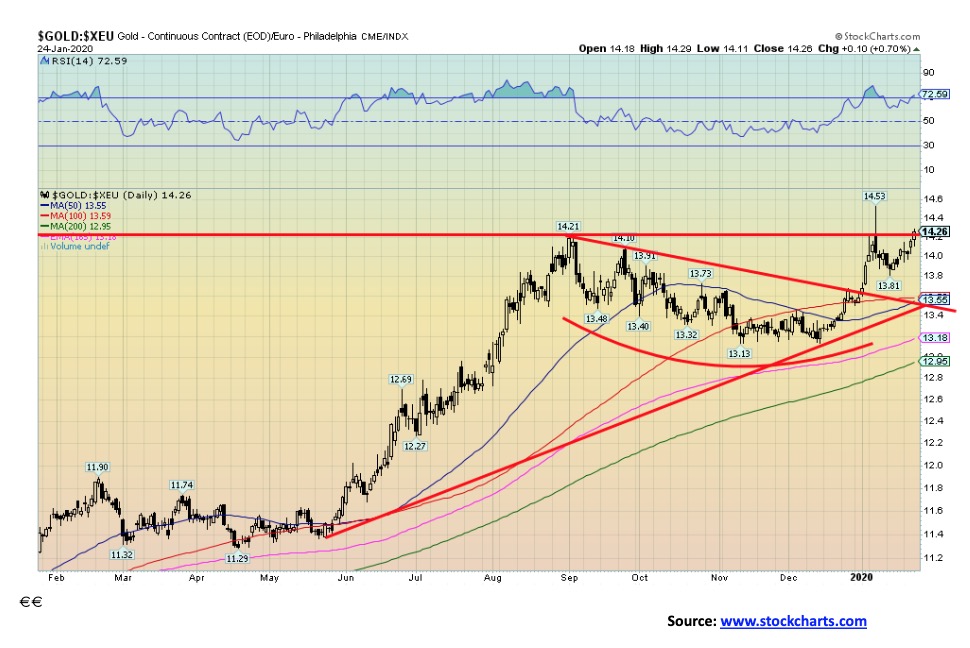
We continue our look at gold in other currencies. This week it is gold in euros. Gold in euros made a new all-time high on the recent spike when it hit €1,453. It is now rising once again, closing at €1,426 this past week. The spike to €1,453 was an all-time record high. Like gold in U.S. dollars it remains to be seen if we can make new highs again. We have noted that, given that gold has made all-time highs in a number of currencies including the euro, Canadian dollars, and others, the odds favour gold to eventually make new all-time highs in U.S. dollars.
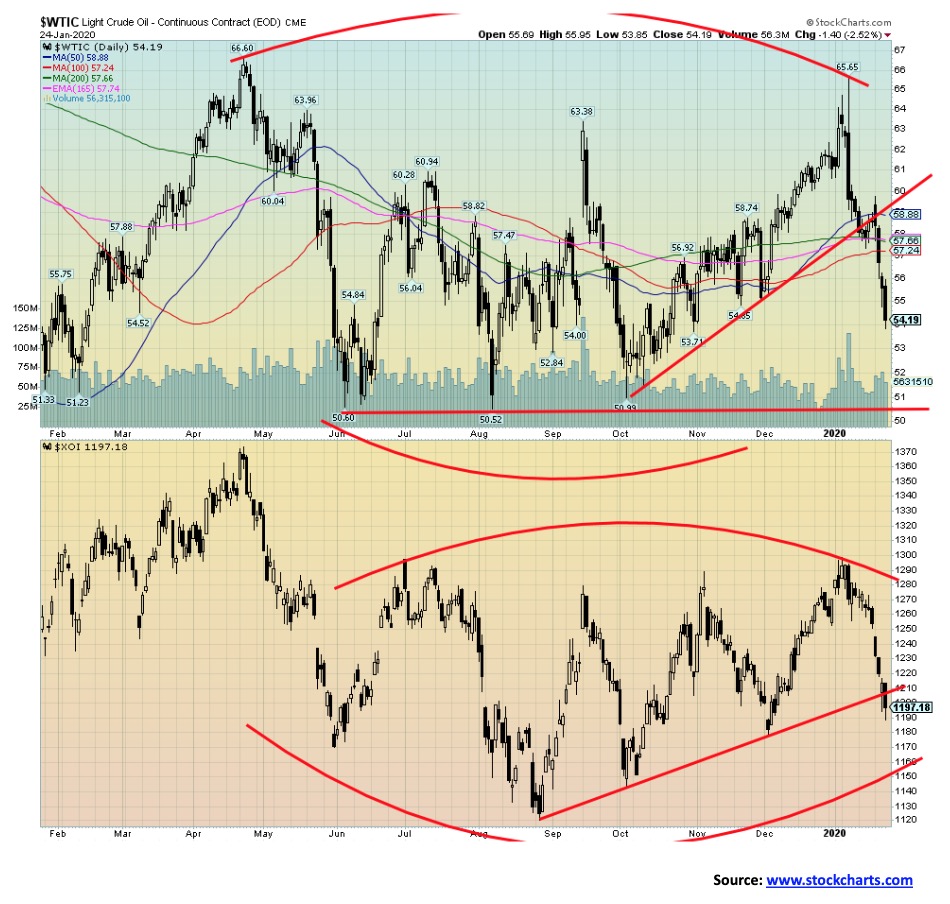
The coronavirus hit oil hard. WTI oil fell a sharp 7.5% this past week. Brent crude was down 4.3%. Natural gas (NG) joined the decline, falling to fresh 52-week lows and closing at $1.90. Fear is driving the market on expectations that the coronavirus will cause an economic slowdown and thus less demand for oil. It could be a knee-jerk reaction. Offsetting this slightly is a sharp curtailment of Libyan oil. If the coronavirus panic continues, oil prices could have further to fall. Major support is near $50. As to NG, well, it broke support but it is also down at levels that had seen previous lows and it is quite oversold at current levels. NG production could fall as well because of the low prices. Saudi Arabia has indicated that all options are open for a production cut. However, the OPEC meeting isn’t until March 2019. Another positive sign for oil prices going forward is the high number of bankruptcies that have hit the North American market, particularly in Canada. With more debt maturing in 2020 it could be a challenge for many to raise capital in this negative environment. While the coronavirus is negatively impacting oil prices and energy stocks in the short term, the longer-term picture could become clearer. We note that the TSX Energy Index (TEN) fell 4.6% this past week while the ARCA Oil & Gas Index (XOI) was down 4.5%. The XOI appears to have broken support and could be headed lower towards 1,150. All this is happening in a period when oil and the energy stocks usually enjoy a seasonal rebound. However, it has not been unusual in the past to see a rise followed by a correction into February before another rise gets under way.
—
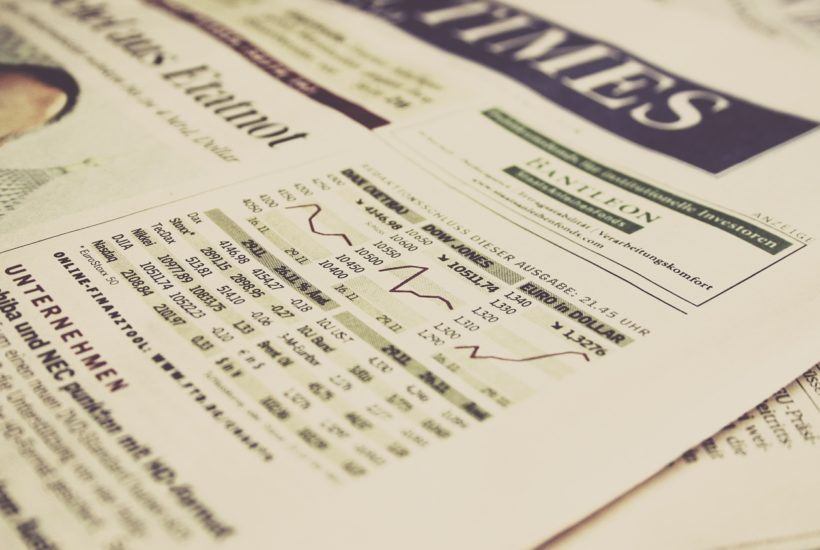
(Featured image by Markus Spiske from Pixabay)
DISCLAIMER: This article was written by a third party contributor and does not reflect the opinion of Born2Invest, its management, staff or its associates. Please review our disclaimer for more information.
This article may include forward-looking statements. These forward-looking statements generally are identified by the words “believe,” “project,” “estimate,” “become,” “plan,” “will,” and similar expressions. These forward-looking statements involve known and unknown risks as well as uncertainties, including those discussed in the following cautionary statements and elsewhere in this article and on this site. Although the Company may believe that its expectations are based on reasonable assumptions, the actual results that the Company may achieve may differ materially from any forward-looking statements, which reflect the opinions of the management of the Company only as of the date hereof. Additionally, please make sure to read these important disclosures.


E-commerce: Sustainability Becomes a Key Purchasing Criterion in Large Emerging Countries
The report found that 31% of consumers evaluate sustainable packaging options when shopping online, while 30% consider sustainable shipping options...


Agadir Signs a Partnership to Boost the Horticultural Sector
A tripartite memorandum of understanding was sealed between Karim Achengli, president of the Souss-Massa Regional Council, Farid Lekjâa, director of...


MSD Gets Green Light from the European Commission for Keytruda, the World’s best-Selling Drug
MSD closed 2023 with a turnover of 55.5 billion euros, 1% more than in 2022, when it obtained sales of...


Konvex Created the First Universal API that Integrates Different ERPs in Latin America
The Konvex API offers numerous benefits so that companies and startups can take advantage of their time and effort in...


The French Real Estate Crowdfunding is Going through First Crisis
Crowdfunding platforms face an influx of repayment extension requests, delaying project completion. Investors like Guillaume report delays in seven out...
 |
|
 |  |
 |
|
-

 Cannabis1 week ago
Cannabis Legalization Reduces the Likelihood of Youth Using It
-

 Cannabis1 day ago
Cannabis Reform in Belgium: What Changes Does the Latest Report Propose
-

 Crowdfunding1 week ago
Consolidation in Sight in the Italian and European Crowdfunding Sector
-

 Crypto2 weeks ago
Bitcoin Markets are Entering a Phase of Euphoria, According to Glassnode