Featured
What Is the Impact of Inflation on Stock Markets (S&P 500) and Gold
What are the economic costs of the blockades in Canada? We examine. Are they going to be substantial? Or merely a hiccup. For the stock markets it was fear of a Russian invasion and sharply rising inflation. Fear of a Russian invasion had already sent oil prices soaring and now is sending the stock markets down. We also have the highest inflation in forty years.

It is impossible to ignore the current standoffs taking place in Ottawa, Ontario, Coutts, Alberta, and the Ambassador Bridge in Windsor, Ontario, and apparently spreading elsewhere. Our concern here is not related to the politics of the situation but the economics.
Canada and the U.S., according to the most recent numbers we can find, trade about $615 billion of goods and services annually. That’s roughly $1.7 billion a day. Major exports include oil, cars, vehicle parts, and refined petroleum products. Major imports include machinery, mineral oils, plastics, and electronics. The cost alone of the Ambassador Bridge blockade could by simplistic calculations cost over $3.5 billion given it has been shut down for a week. That cost so far is about equivalent to Canada’s most expensive natural disaster the Fort MacMurray fires. The negative financial impact of the blockade will linger long after it ends.
The Ambassador Bridge crossing in Windsor, Ontario, and Detroit, Michigan accounts for $300–$500 million a day in trade or roughly $110 billion to $180 billion annually. The Ambassador Bridge represents more than 25% of all daily trade between Canada and the U.S. Major products include truck and auto parts, agricultural products including perishable fruits and vegetables and meats, steel, and other raw materials. Thousands of people cross the bridge every day to get to work both in Canada and the U.S.
There is the Blue Water Bridge about an hour or two north at Sarnia/Port Huron, but it too has been at times blocked as a blockade was set up on Highway 402 leading to the bridge. Regardless of the blockade on Highway 402, wait times have been in some instances up to 9–10 hours to try and cross although on average more like 4-5 hours. The costs to truckers to use the alternative route is in the 100s of dollars daily.
The impact is already hitting major businesses where Ford Motor Company has cut production at their Oakville plant by 50%. Stellantis, a multinational automotive corporation, has laid off 5,000 workers at its Windsor plant. Toyota has announced it will cease production at its three Ontario plants (Cambridge 2 and Woodstock) this week. Joining the production slowdowns are two General Motors (GM) plants (Oshawa and St. Catherines) and the Honda plant in Alliston.
All of these closings are due to the inability to receive just-in-time auto parts. Canada employs some 124,000 in the automobile industry, primarily in Ontario. As to perishables, the huge Ontario Food Terminal in the west end of Toronto receives upwards of 40% of its produce via the Ambassador Bridge. Perishables extends to meat as well where there have already been reports of meat distributors forced to throw out thousands of dollars’ worth of meat because it took far too long to arrive due to the blocked borders. Shortages and empty shelves could soon follow.
The Coutts, Alberta crossing is not as big and accounts for roughly $44 million per day or about $16 billion annually. Major products include steel imports such as pumps and valves for the oil and gas industry. The crossing is also a major conduit for agricultural products including live cattle. Cattle headed for slaughter are currently getting a reprieve it would appear. Other products include meat and corn.
There are apparently other attempt to shut down border crossings in Manitoba, and in Ontario, Fort Erie/Buffalo and Cornwall. There has been attempts to shut down more cities including Winnipeg, Quebec City and Halifax.
Security costs alone for Ottawa are costing the city $800,000 to $1,000,000 daily and could soar higher if more assistance is required. These estimates may be low.
None of this includes the costs to businesses in Ottawa that have been forced to close, or, hundreds, possibly more who have been laid off as a result of the blockade. Like the B.C. floods, this is having a major impact on supply chains that could lead to shortages, supply disruptions, and inflation. Many plants depend on just in time supply and now that supply is not coming. Perishable goods are amongst the many blocked at the border and that could quickly lead to empty shelves in grocery stores. The impact of the shutdowns, even if resolved tomorrow, could linger for weeks. The inflationary impact is unknown but the expectation is that inflation, already rising, will rise even further. Given that thousands are being laid off, Canada’s February job numbers might be negative again as they were in January.
The current blockades are being compared to the blockades carried out by First Nations in 2020 with regard to the Coastal Link Pipeline. Besides the blockade on Wet’suwet’en territory which was unceded indigenous territory and tied up in numerous land claims between the Canadian government and First Nations, rail blockades were set up where major rail lines such as Canadian National Railway (CNR) passed through First Nations territory. Initially it was reported that the blockades were impacting $425 million of goods being stranded each day by the shutdown. Ultimately, the tally of costs showed that it reduced Canada’s GDP by 0.2% in Q1 2020 and that overall GDP would fall only $275 million. This gives some hope that the current blockades will not be as expensive as they appear to be on the surface.
The costs alone of the COVID pandemic have far exceeded that number. The ultimate costs of the current blockade are unknown but it is expected they could be substantial, far exceeding the costs of the First Nations blockades. On the other hand, until the actual numbers are tallied it could just be a “hiccup”. This could have a potential negative impact on Canada’s Q1 GDP and further raise inflation. We have not yet seen any estimates of this impact. It could even tip Canada into a recession.
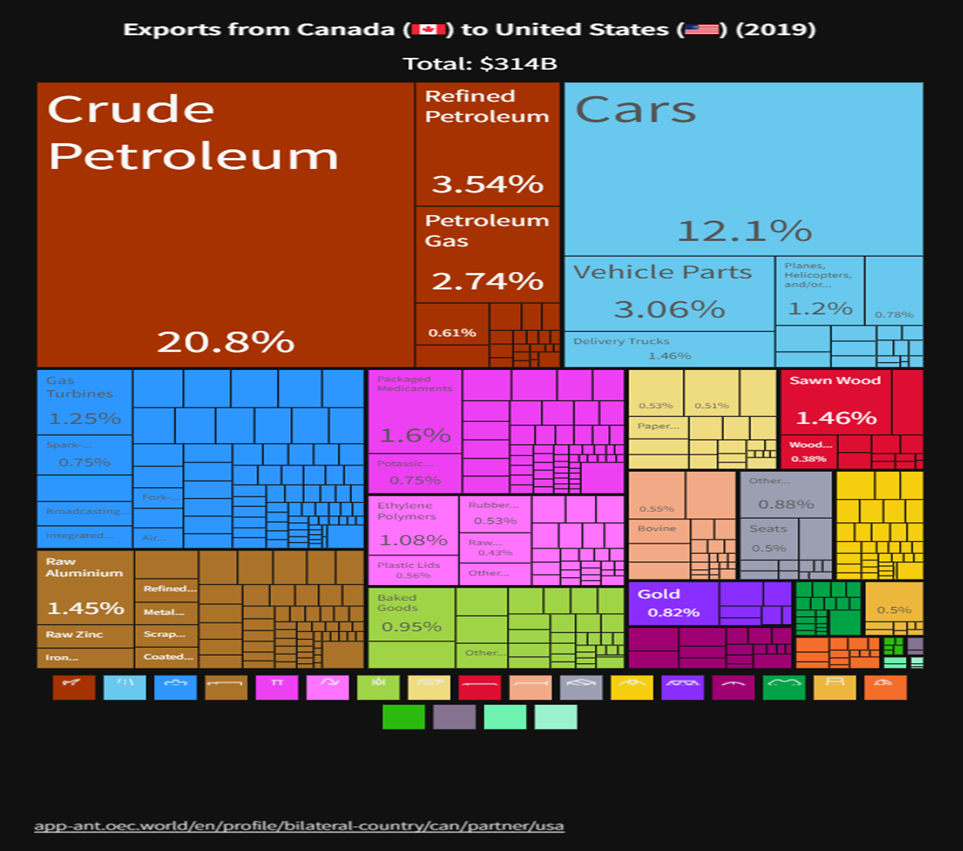
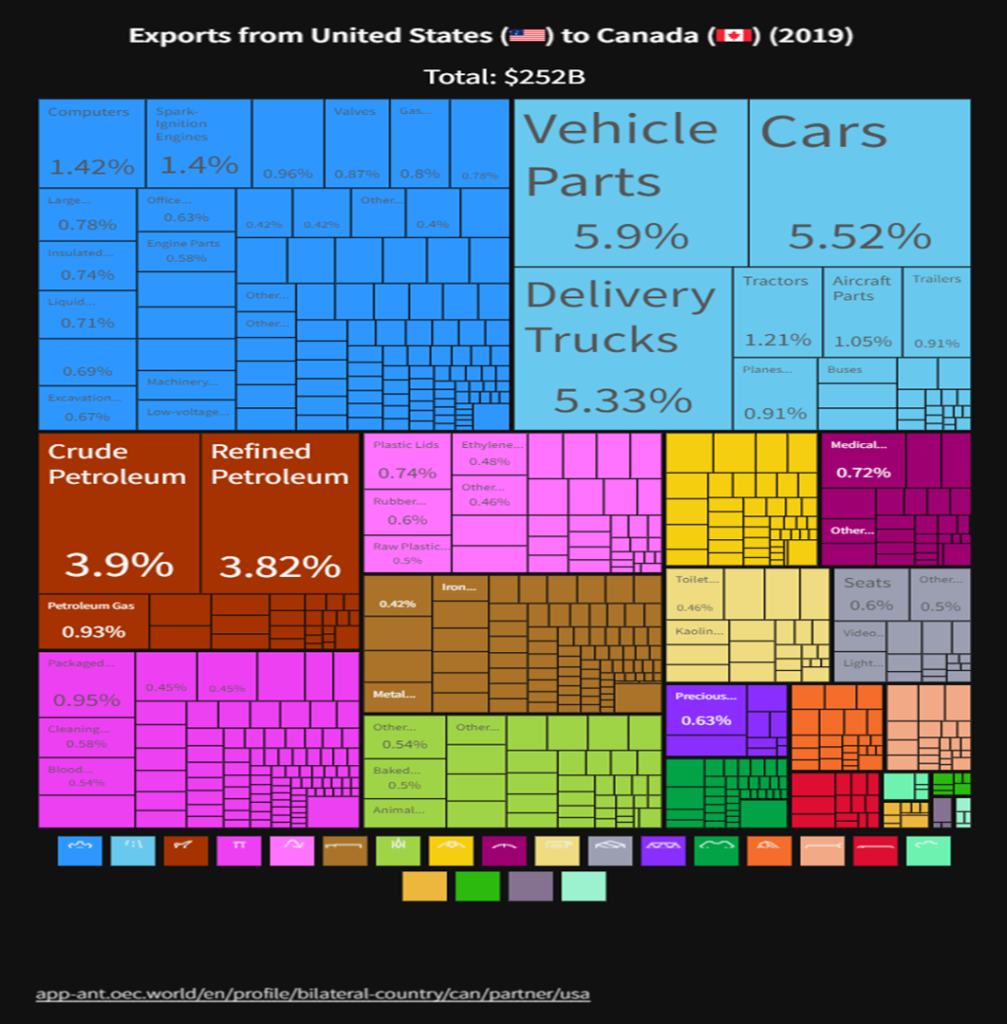
Below are a couple of charts from 2019 showing Canada’s exports to the U.S. and the U.S.’s exports to Canada. As noted, over 25% of Canada/U.S. trade goes through the border crossings across the St. Clair River at Windsor/Detroit and Sarnia/Port Huron.
Main exports from Canada to U.S.: petroleum, cars, refined petroleum, vehicle parts, petroleum gas.
Main exports from U.S. to Canada: vehicle parts, cars, crude petroleum, refined petroleum.
Left out of the equation above are Canada’s imports from Mexico. Last data (2020) we have is that Canada imported some $22.3 billion worth of goods from Mexico. Much of that would be shipped by truck through the U.S. and into Canada through the Ambassador Bridge. Leading the way are vehicles ($6.2 billion), but vegetables and fruits are also a major item, totaling $1.7 billion in 2020. Canada also exported some $4.6 billion worth of goods to Mexico in 2020. Both numbers were down from 2019 due to the pandemic. Main exports to Mexico include vehicles, oil seeds, and machinery, including nuclear reactors.
Many of the items are just in time parts. Foods are perishable. Closing these border crossings for any length of time would, as already seen, negatively impact auto plants. Empty shelves at grocery stores could quickly be seen. Prices could rise, adding to already accelerating inflation. We review the latest U.S. inflation numbers under Chart of the Week.
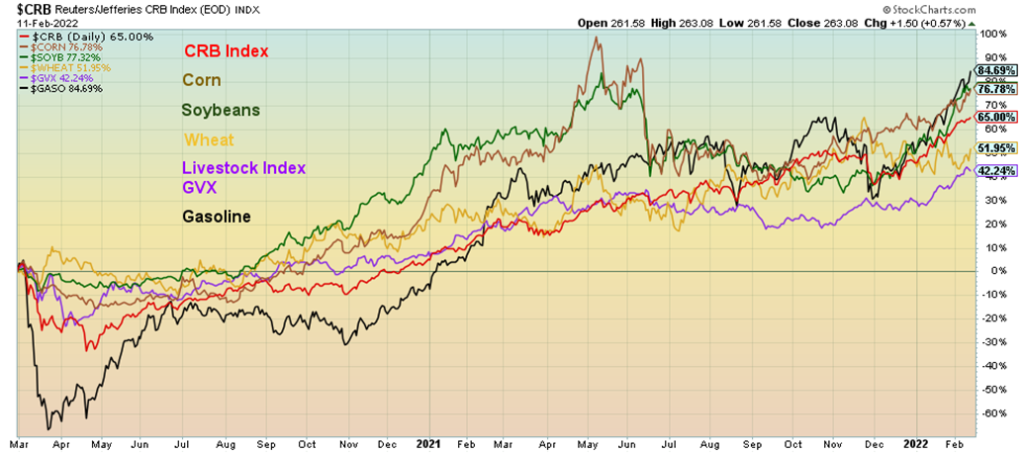
As to the products themselves, we note the huge price gains seen in commodity products since March 2020.
The CRB Index is up 65.0%, corn up 76.8%, soybeans up 77.3%, wheat up 52.0%, GVX Livestock Index up 42.4%, and gasoline up 84.7%. Sharply rising gas prices negatively impact shipping costs.
Regardless of the reasons behind the blockades and whether one agrees with them or not, it is a demonstration of a loss of confidence in the government. Canada’s reputation as a safe business partner may be at stake. The other side of the coin is that failure to act and end the blockades in a timely fashion could trigger further losses of confidence in the government from the opposite side. We have noted before that loss of confidence in the government could trigger a sharp rise in gold prices as the loss of confidence in the government could translate into a loss of confidence in the currency.
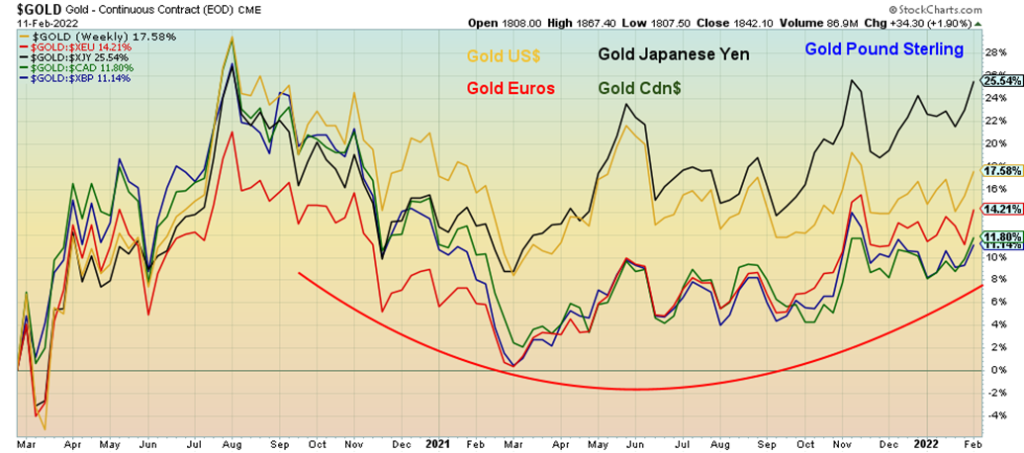
As this chart shows, gold priced in various currencies is still trying to find its footing coming out of the pandemic lows of March 2020. However, the turn up is positive and we could soon see new highs. Leading the way is gold in Japanese yen up 25.5%. Gold in euros is up 14.2%, gold in US$ up 17.6%, gold in Cdn$ up 11.8% and gold in pound sterling up 11.1%. We have often noted that gold’s March 2021 low as potentially being our 31-month cycle low. The next low could come in anywhere from October 2023 to April 2024 and would most likely coincide with the 7.83-year cycle low and the 23.5-year cycle low that are also due. The question is, where will the peak of the current 31-month cycle fall? And at what level? We continue to look for potential up to $2,200/$2,400. However, to get there, gold still has considerable resistance points to break through (noted under our gold commentary).
Protests are a constant occurrence in a democracy. However, the current protest/blockade has the potential to cause some very significant economic damage as supply disruptions grow and layoffs escalate. It could also cause prices to spiral (inflation) significantly. Meanwhile the economy is wobbling. A recession could be looming.
Chart of the Week
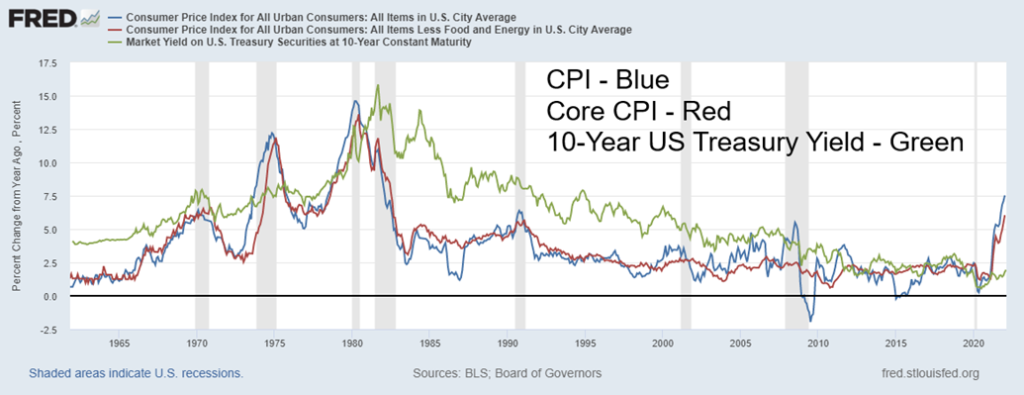
U.S. CPI rose 0.6% in January which was above the expected 0.5%. Year-over-year (y-o-y) CPI was up 7.5% which was well above the forecast of 7.1%. Core CPI also rose 0.6% in January and was up 6% y-o-y which was just above the expected 5.7%. The unexpected jump sent chills through the markets as the U.S. dollar rose and the stock market, led by the Dow Jones Industrials (DJI), fell over 500 points. The expectation now was that the Fed may begin to tighten more aggressively at the March FOMC. A half-point increase is expected by many. The market is also expecting that there will be six rate hikes in 2022, up from five earlier.
It was the highest level recorded since 1982. The U.S. 10-year treasury note jumped to a high of 2.05%, but that still left the gap between the 10-year and CPI at 5.45%. The sharp rise in the CPI hastens thoughts that the U.S. may fall into a recession sooner rather than later. Every time inflation rose above 5% since 1950, a recession followed not long after. That has happened on eight occasions. There were also four occasions where a recession occurred but inflation had not gone above 5%. The most recent was the 2020 pandemic recession.
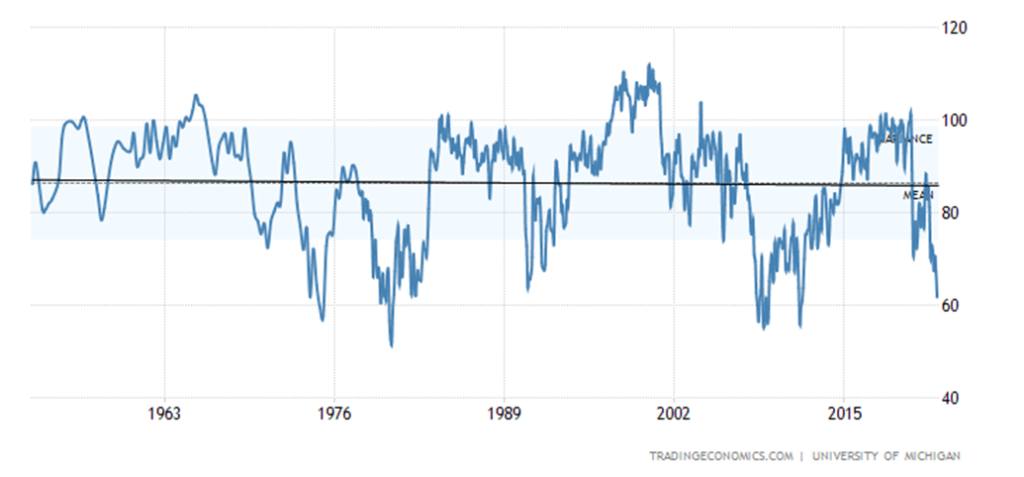
If there is anything on the horizon to cause the Fed to hesitate about how much to raise rates it is a stock market that is wobbling near or in correction territory and an economy that is showing signs of slowing. The most recent Michigan Consumer Sentiment Index may cause pause. The Michigan Index’s preliminary February reading fell to 61.7, well below January’s 67.2 and the expected 67.5. It is the lowest reading for the Michigan Index since 2011. The record low was 51.7 in May 1980. In November 2008 during the 2008 financial crisis the Michigan Index fell to 55.3. Every time the Michigan Index fell below 70, a recession was either already underway or about to start.
Inflation above 5% and the Michigan Consumer Sentiment Index below 70 are both signaling that a recession could be coming or may actually be underway. Rising inflation coupled with a weakening economy spells stagflation.
U.S. Michigan Consumer Sentiment Index
In The Scoop’s February 7, 2022 edition, we noted how real GDP (nominal GDP adjusted for inflation) was rising more slowly than nominal GDP. Normally, real GDP is rising at a faster rate than GDP. But since 2012 the opposite has occurred. Real GDP is growing at a slower pace than GDP. Since 2009, nominal GDP is up 66.8% but real GDP is up only 30.6%. The gap is currently in favor of nominal GDP by $4.2 trillion. In Q2 2009, the gap was $780 billion in favor of real GDP.
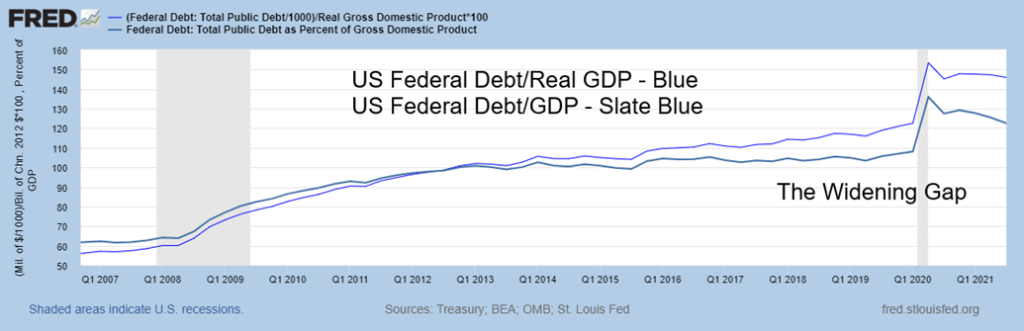
Sharply rising inflation also makes the debt cheaper. Below is a chart showing the U.S. Federal Debt to GDP and the U.S. Federal Debt to Real GDP. As we saw with nominal GDP and real GDP, the two have switched places since 2012. Before that, the Debt/GDP ratio was consistently higher than the Debt/Real GDP ratio. However, what is no surprise is that despite the federal debt rising currently over $30 trillion the Debt/GDP ratio and the Debt/Real GDP ratio have been falling. At its peak in Q2 2020, the Debt/GDP ratio was 135.9%. Today it stands at 124.7%. Debt/Real GDP at its peak also in Q2 2020 stood at 153.4%. Today it has fallen to 151.6%. For comparison in Q2 2008, the Debt/GDP ratio was 63.9% and the Debt/Real GDP was 60.1%
It is no surprise that the gap between Debt/GDP and Debt/Real GDP is widening as that is a function of the widening gap between nominal GDP and real GDP. Rising inflation lowers GDP but it also lowers the debt. However, rising inflation makes it more difficult to earn a return. If the inflation rate is 7.5%, the stock market would have to rise 10% just so investors could earn a real return. With interest rates as low as they are, investors are earning a negative return. If the stock market fails to keep up with inflation it also means they will have negative returns even if they are up. With the economy showing signs of slowing and inflation rising, that could translate into stagflation. During periods of stagflation as we saw in the 1970s, stocks perform poorly but commodities and gold soar. Value stocks would outperform growth stocks.
US Federal Debt/GDP, US Federal Debt/Real GDP
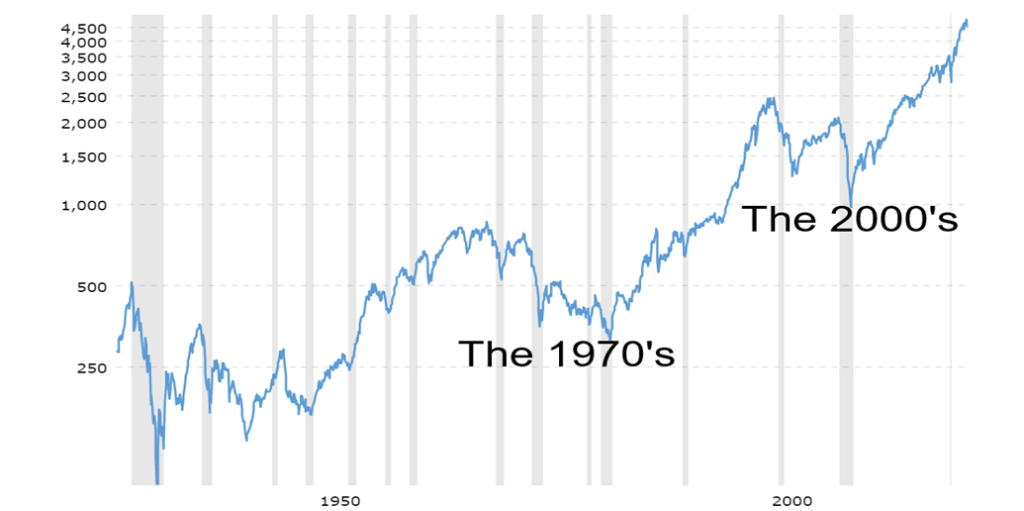
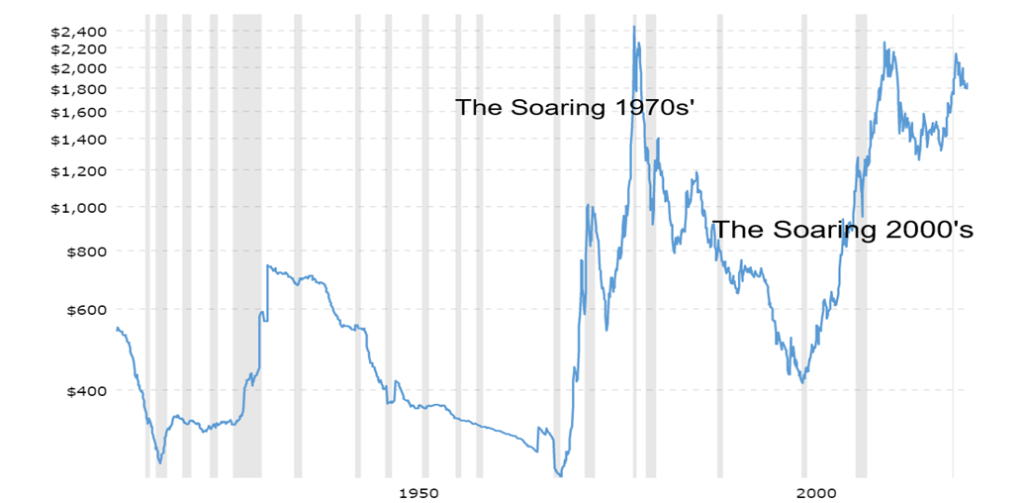
The two charts below show the performance of the stock market inflation-adjusted and the performance of gold inflation-adjusted. Note how on an inflation-adjusted basis the S&P 500 fell relentlessly from 1968 to 1982. The decline was 64% on an inflation-adjusted basis vs. 39% on a nominal basis. On an inflation-adjusted basis, the stock market bottomed in 1982 but on a nominal basis, the low was seen in 1974. The second chart shows gold on an inflation-adjusted basis. On an inflation-adjusted basis, gold rose 803% from October 1970 to February 1980. Similarly, gold rose 385% from February 2001 to July 2011 on an inflation-adjusted basis. However, on a nominal basis, gold rose 1,716% from September 1970 to February 1980 and 600% from March 2001 to August 2011. Note these gains are based on a monthly basis. Despite gold once again making new all-time highs in August 2020 on a nominal basis, gold has never achieved the high seen in February 1980 on an inflation-adjusted basis.
Rising inflation has its good and bad points. Rising inflation coupled with a slowing economy (stagflation) is not good for consumers and the stock market. But for gold and commodities, it is potentially golden.
S&P 500 1928–2022 Inflation-Adjusted
Gold 1915–2022 Inflation-Adjusted
MARKETS AND TRENDS
| % Gains (Losses) Trends | ||||||||
| Close Dec 31/21 | Close Feb 11/22 | Week | YTD | Daily (Short Term) | Weekly (Intermediate) | Monthly (Long Term) | ||
| Stock Market Indices | ||||||||
| S&P 500 | 4,766.18 | 4,418.64 | (1.8)% | (7.3)% | down | neutral | up | |
| Dow Jones Industrials | 36,333.30 | 34,738.06 | (1.0)% | (4.4)% | down | neutral | up | |
| Dow Jones Transports | 16,478.26 | 15,000.22 | (1.4)% | (9.0)% | down | neutral | up | |
| NASDAQ | 15,644.97 | 13,791.15 | (2.2)% | (11.9)% | down | down | up | |
| S&P/TSX Composite | 21,222.84 | 21,548.84 | 1.3% | 1.5% | up | up | up | |
| S&P/TSX Venture (CDNX) | 939.18 | 868.77 | 1.7% | (7.5)% | down (weak) | down | up | |
| S&P 600 | 1,401.71 | 1,301.19 | 1.4% | (7.2)% | down | down | up | |
| MSCI World Index | 2,354.17 | 2,327.55 | 1.7% | (1.1)% | neutral | down (weak) | up | |
| NYSE Bitcoin Index | 47,907.71 | 43,752.80 | 10.6% | (8.7)% | neutral | neutral | up | |
| Gold Mining Stock Indices | ||||||||
| Gold Bugs Index (HUI) | 258.87 | 265.40 | 7.8% | 2.5% | up | neutral | neutral | |
| TSX Gold Index (TGD) | 292.16 | 300.10 | 6.3% | 2.7% | up | neutral | neutral | |
| Fixed Income Yields/Spreads | ||||||||
| U.S. 10-Year Treasury Bond yield | 1.52% | 1.92% (new highs) | flat | 26.3% | ||||
| Cdn. 10-Year Bond CGB yield | 1.43% | 1.85% (new highs) | (0.5)% | 29.4% | ||||
| Recession Watch Spreads | ||||||||
| U.S. 2-year 10-year Treasury spread | 0.79% | 0.42% | (31.2)% | (46.8)% | ||||
| Cdn 2-year 10-year CGB spread | 0.48% | 0.33% | (34.0)% | (31.3)% | ||||
| Currencies | ||||||||
| US$ Index | 95.59 | 96.07 | 0.6% | 0.1% | neutral | up | up (weak) | |
| Canadian $ | .7905 | 0.7848 | 0.1% | (0.7)% | neutral | down | up | |
| Euro | 113.74 | 113.44 | (0.9)% | (0.3)% | up (weak) | down | down (weak) | |
| Swiss Franc | 109.77 | 108.16 | 0.1% | (1.5)% | down | down | up (weak) | |
| British Pound | 135.45 | 135.46 | 0.2% | 0.1% | up (weak) | down | up | |
| Japanese Yen | 86.85 | 86.71 | (0.1)% | (0.2)% | down | down | down | |
| Precious Metals | ||||||||
| Gold | 1,828.60 | 1,842.10 | 1.9% | 0.7% | up | up | up | |
| Silver | 23.35 | 23.37 | 4.0% | 0.1% | up (weak) | down | up (weak) | |
| Platinum | 966.20 | 1,018.70 | (0.5)% | 5.4% | up | neutral | up (weak) | |
| Base Metals | ||||||||
| Palladium | 1,912.10 | 2,193.60 | (4.2)% | 14.7% | up | neutral | up (weak) | |
| Copper | 4.46 | 4.49 | 4.1% | 0.5% | up | up | up | |
| Energy | ||||||||
| WTI Oil | 75.21 | 93.10 (new highs) | 0.9% | 23.8% | up | up | up | |
| Natural Gas | 3.73 | 3.94 | (13.8)% | 5.6% | down (weak) | neutral | up | |
New highs/lows refer to new 52-week highs/lows and, in some cases, all-time highs.
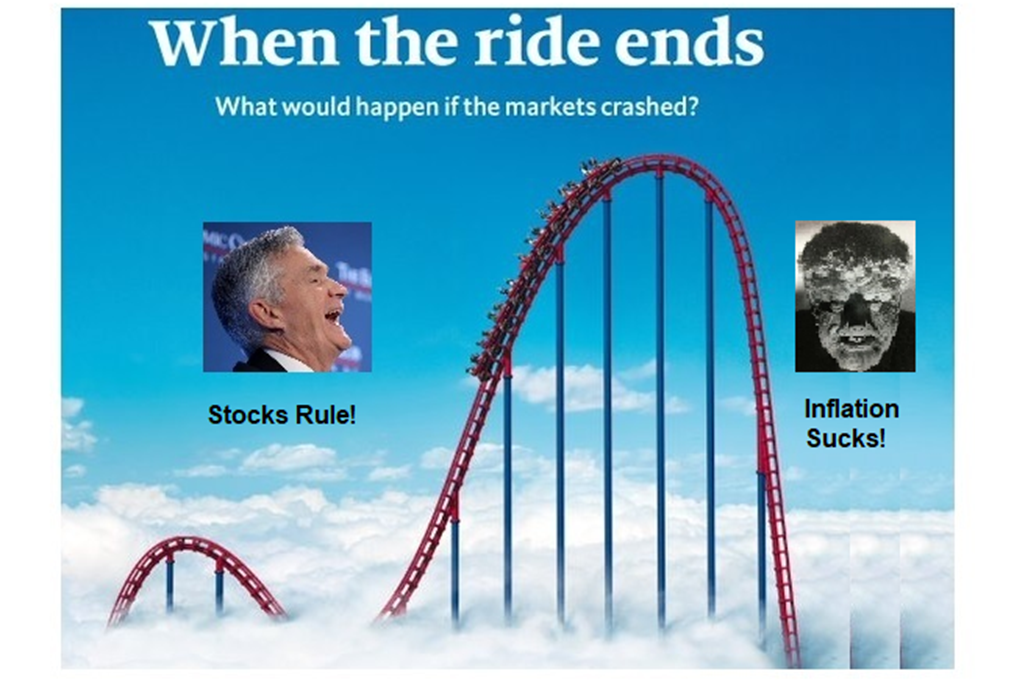
Russia is going to invade!!! Yes, that is the fear. And fear is what helped push stock markets down on Friday. It was basically red ink all around for the U.S. indices this past week. Given the inflation numbers that came out, fear of interest rate hikes also helped push the market lower. The punch bowl is going, going, gone. Think of the ride for the stock market from the depths of the March 2020 low as a long ride up a roller coaster. What happens when you reach the top? Oops!
The S&P 500 fell 1.8% this past week, the Dow Jones Industrials (DJI) down 1.0%, the Dow Jones Transportations (DJT) off 1.4%, and the NASDAQ took the biggest hit, down 2.2%. But those declines belie the fact that earlier in the week the indices were still attempting to rise. Friday did them in. The small cap S&P 600 actually gained 1.4%. So, what kind of message was that? That small caps are the place to be? The S&P 500 Equal Weight Index fell only 0.3%. Berkshire Hathaway the ultimate value stock rose 1.1%. Value stocks are outperforming the growth stocks that led the markets up.
In Canada, the TSX Composite also rose, up 1.3% as material stocks led the way. The small cap TSX Venture Exchange (CDNX) was up 1.7%. In the EU, the London FTSE gained 1.7%, the Paris CAC 40 was up 0.9%, and the German DAX gained 2.2%. In Asia, China’s Shanghai Index (SSEC) was up 3.0% and the Tokyo Nikkei Dow (TKN) gained 0.9%. Maybe they didn’t get the message of Russia invading Ukraine soon enough. We’ll see how they open on Monday.
When the Ride Ends – Cover of The Economist February 12, 2022
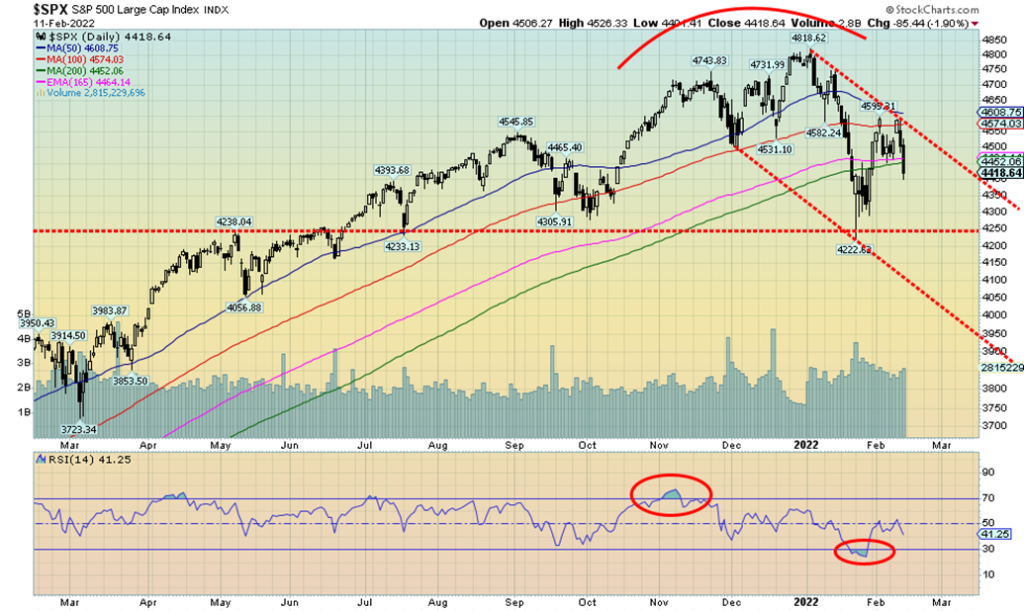
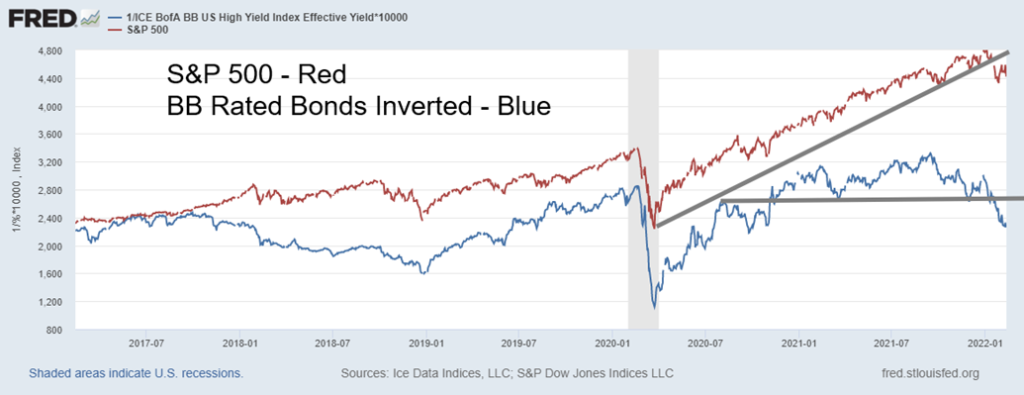
The S&P 500 appears to be in a descending bear channel. Resistance is up to 4,575 and the 100-day MA. Current support is seen at 4,400 but under that level the S&P 500 should fall further. The bottom of the channel is currently down at 4,000/4,100, but interim support can be seen at 4,250/4,300. The upward correction stalled just under 4,600. The upward correction now appears to be over. The high-yield BB-rated bonds have broken down from a topping pattern, indicating that this market is in trouble. The S&P 500 appears to be in the process of following. Big trouble for the bulls.
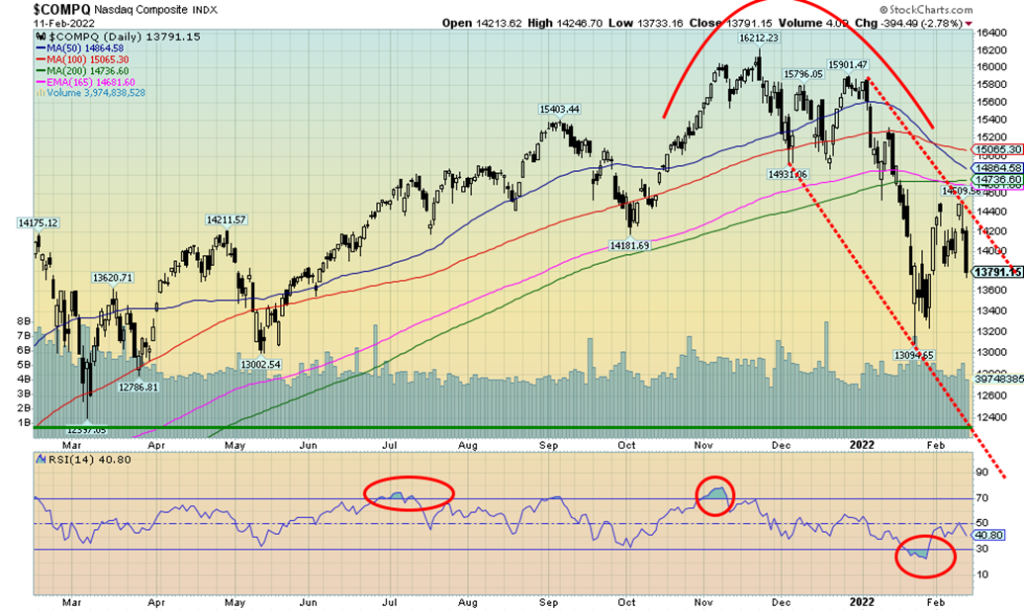
The tech-heavy NASDAQ fell 2.2% this past week which included the 2.8% decline on Friday on fears of a Russian invasion of Ukraine. It was noteworthy that the FAANG stocks took a big hit this past week. Meta (Facebook) fell 7.4%, Apple was down 2.3%, Amazon off 2.7%, Netflix -4.7%, Google -6.3%, Microsoft -3.6%, Tesla -6.9%, Twitter -3.0%, and Nvidia -1.5%. The Chinese FAANGs rebounded slightly with Baidu up 1.4% and Alibaba flat. There is nothing in the chart of the NASDAQ to suggest that we have yet made a low. Our expectations are that we should make new lows below 13,000. Significant support can be seen down to 12,400. The NASDAQ is down 15% from its all-time highs and under the 200-day MA in correction territory. Below 13,000 the NASDAQ enters a bear market. The recent low was seen just under 13,100. The NASDAQ advance/decline line is leading the way down, having broken down under a support level. The percentage of NASDAQ stocks trading above their 50-day MA is at 24.9% while the ones trading above their 200-day MA is at 20.3%. Both are in bearish territory. The NASDAQ Bullish Percent Index (BPNDX) is still kind of neutral but falling at 53.00%. At the recent lows the BPNDX fell to 19%. The NASDAQ is a way from turning bullish once again. It would take a move back over 15,100 and especially over 15,200 to help confirm that a low was in. RSI at 40 is not bearish enough, suggesting we have room to move lower. Friday’s shakedown may have put a nail in the NASDAQ. A move back under 13,425 would suggest that new lows are probable.
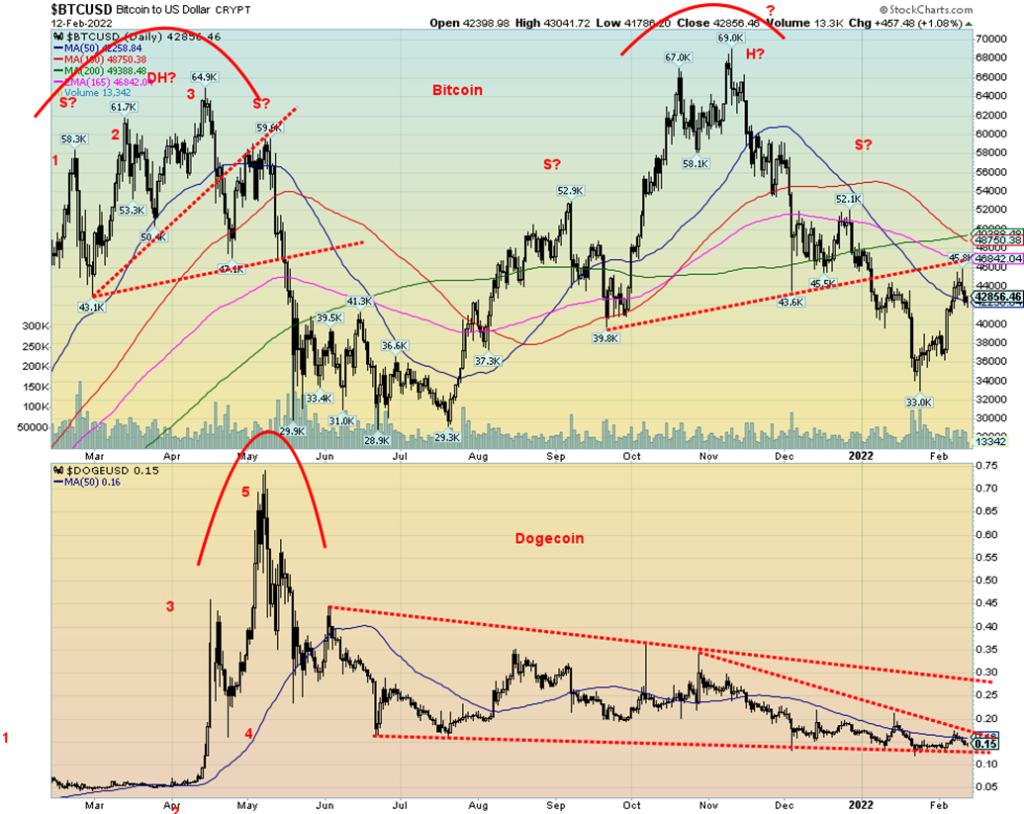
We are a little unsure as to what Bitcoin might do next. Bitcoin appears to have rallied back to what we note as the possible neckline of a head and shoulders pattern. The H&S pattern projects down to about $16,000. Bitcoin needs to first regain above $50,000 then above the possible shoulder high of $52,100 to suggest a move to higher prices. This past week’s rebound (Bitcoin gained 10.6%) could be partially attributable to news that the Trucker Convoys in Canada were using cryptocurrencies to finance themselves. A move back under $40,000 could spell the end of this rally and a move back under $36,000 would end it for sure. Dogecoin still looks like it is in a descending triangle and, if it breaks down, Dogecoin is going back to where it started, under 1 cent.
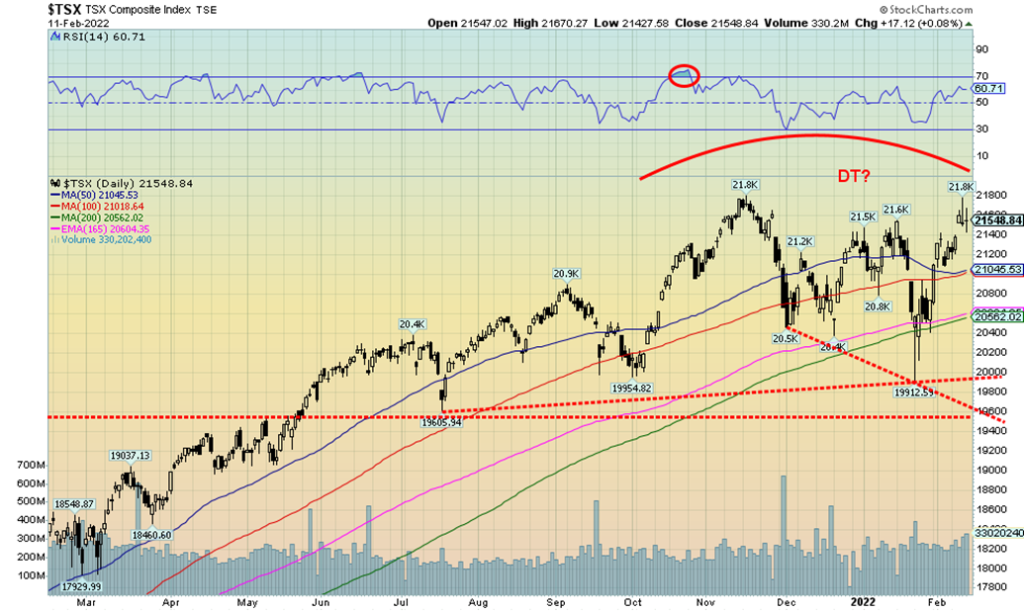
The TSX Composite continues to show why we believe, going forward, the Canadian stocks representative of the TSX will outperform the U.S. in 2022. This past week, while stock markets in the U.S. fell, the TSX Composite actually gained 1.3%. The small cap TSX Venture Exchange (CDNX) rose 1.7%. Only three of the 14 subindices fell on the week, led by Consumer Discretionary (TCD), down 2.4%. The other two losers were Information Technology (TKK) -1.7% and Real Estate (TRE) -0.2%. The stars were Health Care (THC) +8.7%, Metals & Mining (TGM) +6.6%, Golds (TGD) +6.3%, and Materials (TMT) +6.4%. In other words, commodity-based stocks led the way. Financials (TFS) +1.3% hit fresh 52-week highs as did Telecommunications (TTS) +0.3%. While the TSX Composite did not, the large cap TSX 60 also hit fresh 52-week highs. The high this past week for the TSX was just shy of the high in November 2021. Are we putting in a double top? The pattern is an awkward one, but any breakdown under 20,000 would be negative. Support is seen at 21,000 and 20,500. Resistance is now clear at 21,800. On the year the energy stocks have been the big winners. Financials are also ahead. As to the rest, well…….
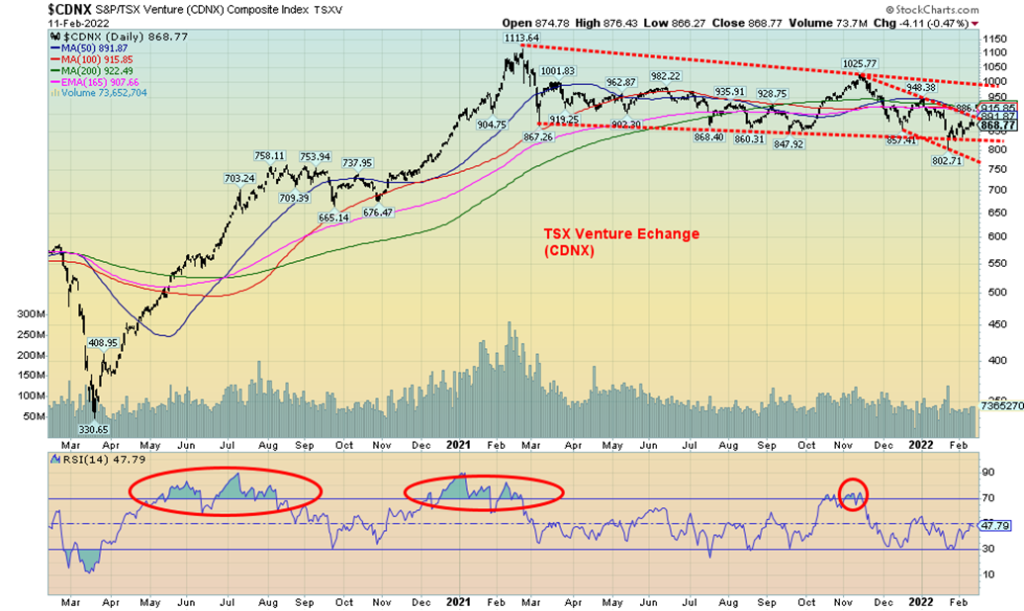
What to make of the TSX Venture Exchange (CDNX)? The chart above is a bit of a quandary. It could either be a long consolidation pattern or it could be a descending triangle. The CDNX is down 22% from its peak last February. At one point it was down 28%. The pattern is sloping downward, suggesting the descending triangle. Or is it a descending sideways pattern? Is there a difference? The CDNX is home to a multitude of junior resource companies in gold, metals, and oil & gas. The CDNX also has a lot of other junior companies in various sectors, ranging from health care to transportation. All we can do, however, is watch carefully. A breakdown occurs on 800 and a breakout over 1,000. Although that last breakout over 1,000 proved to be false and went nowhere. The moving averages are all converging, suggesting we could be in for a move. But which way? Ultimately, if we break down under 750, we’ll know for sure we are headed lower.
U.S. 10-year Treasury Bond/Canadian 10-year Government Bond (CGB)
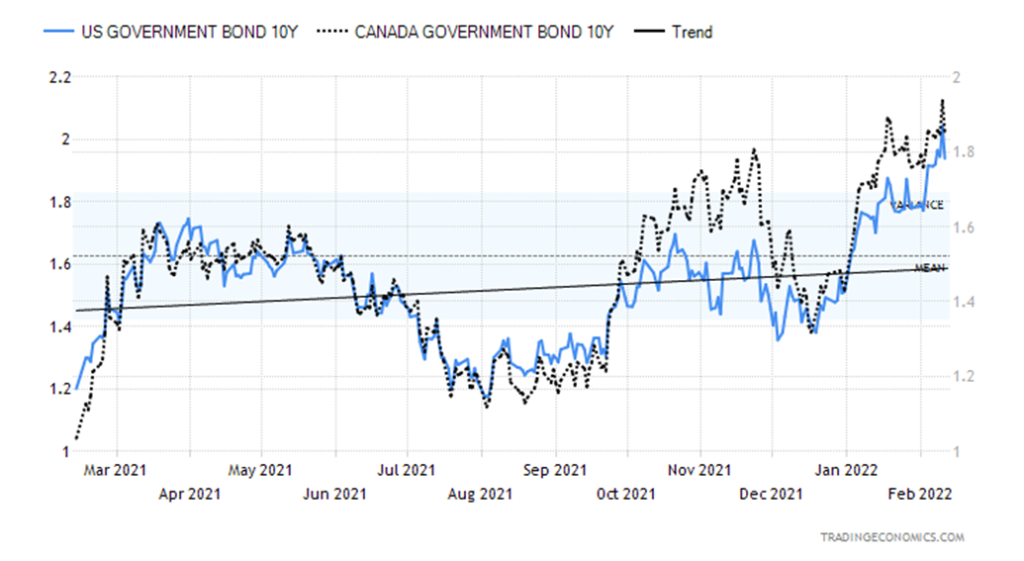
In times of global stress, where does one turn? Well, bonds, specifically U.S. treasuries are one. Gold is another. Fears of higher interest rates spiked the U.S. 10-year treasury note to a new high this past week at 2.05%. Fear of a Russian invasion of Ukraine sparked a rush to safety and the 10-year fell back to close at 1.92% unchanged on the week. The Canadian 10-year Government of Canada bond (CGB) also hit a new high at 1.96% before closing down at 1.85% down 0.5% on the week. Despite rising inflation and fears of interest rate hikes, the closely watched 2–10 spread fell to 0.42% this past week, down from 0.61% the previous week. We note that further below. In Canada, the 2–10 spread fell to 0.33% from 0.50%. Flattening yield curves are often a precursor to a recession. Despite fears of rising interest rates there is also fear of a recession as the Michigan Consumer Sentiment Index (preliminary) slipped to 61.7, well below the consensus forecast of 67.5. It’s the lowest level seen since 2011. A move under 70 has often been associated with a possible coming recession. The U.S. trade balance continues to be bad, recording in December a deficit of $80.7 billion. The trade gap hit a deficit of $859 billion in 2021. A steep trade deficit is a significant drag on GDP. The deficit for December was just shy of the record $80.8 billion recorded in September 2021.
This coming week we get the NY Empire Index (manufacturing) and the Producer Price Index (PPI). The PPI is expected up 0.4% in January and 8.5% y-o-y. Retail sales for January are out on Wednesday and the market is looking for a gain of 1.5%. Industrial production for January is also out Wednesday. Housing starts come on Thursday and home sales on Friday. Watch for any slowdown. If the hype over Russia/Ukraine continues, look for bond yields to soften further this coming week. The breakdown point isn’t until under 1.75%.
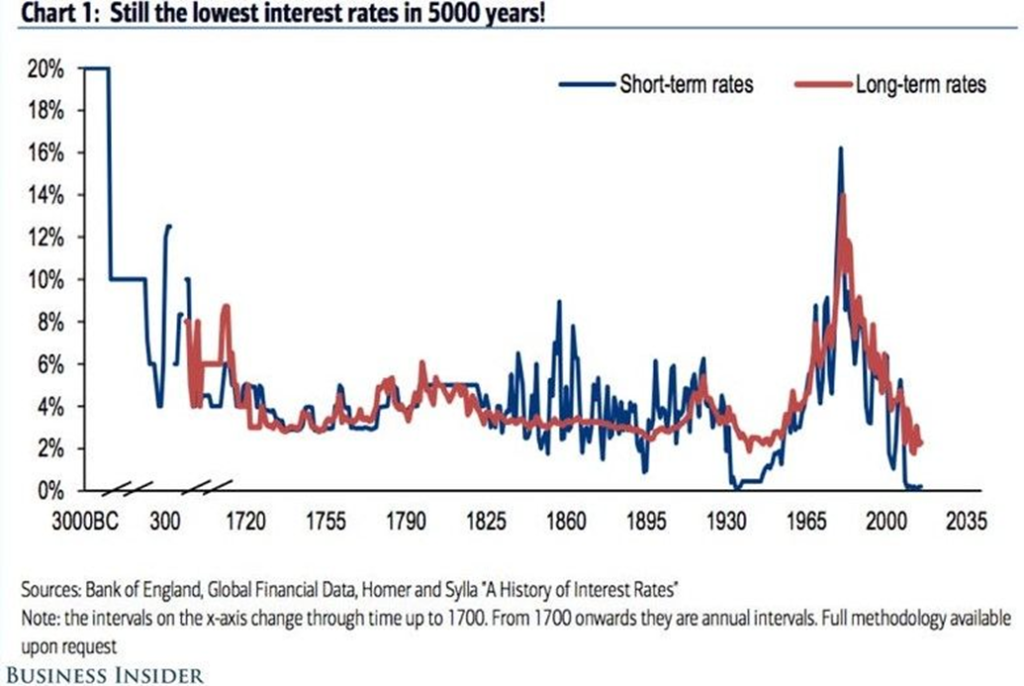
Interest rates have never been so low, nor have they been so persistently low. It is historic. Interest rates are at 5000-year lows. Given the persistently low interest rates, including negative rates in the eurozone and Japan, any return to normalcy could have a profound impact on the global economy. The above chart came courtesy and permission of the Global Investment Newsletter (www.globalinvestmentnewsletter.com). With global debt levels around $300 trillion, any rise in interest rates could spark problems. Global debt has more than doubled since the 2008 financial crisis. It is estimated that upwards of 70% of U.S. corporate debt is rated BBB or lower. Many BBB-rated corporates could suddenly find themselves downgraded to junk bonds if rising interest rates sparked problems. Corporations and countries could be cut off from credit markets. Record amounts of debt were issued during the 2020 pandemic crisis. According to Federal Reserve data there is at least $11 trillion of vulnerable corporate debt. Total corporate debt, including both financial and non-financial corporate debt, totals some $32 trillion in the U.S. The massive debt binge helped fuel the recovery. They are now out of bullets to help the recovery continue and as the economy weakens and interest rates rise, we could be faced with a deluge of defaults.
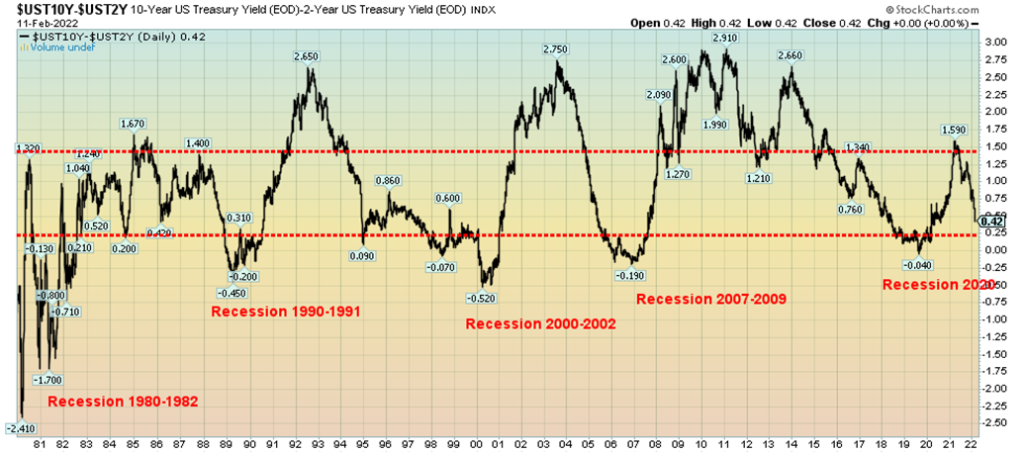
The 10-year U.S. treasury note and the 2-year U.S. treasury note spread (aka the 2–10 spread) are falling rapidly. A negative spread has preceded every recession over the past forty years. The spread has now fallen some 73% or 117 bp in the past year. Yes, it is still a way from going negative but at the current pace we could be turning negative within a few short weeks. No, a recession does not follow immediately as there is usually several weeks’ lag. Another spread that we follow, the 10-year vs. the 3-month U.S. treasury bill, has not yet fallen much. Currently, at 156 bp, it is down only marginally from its high of 171 bp. That spread has a long way to go. In some respects that is a mixed signal, but it is worth noting as we go forward.
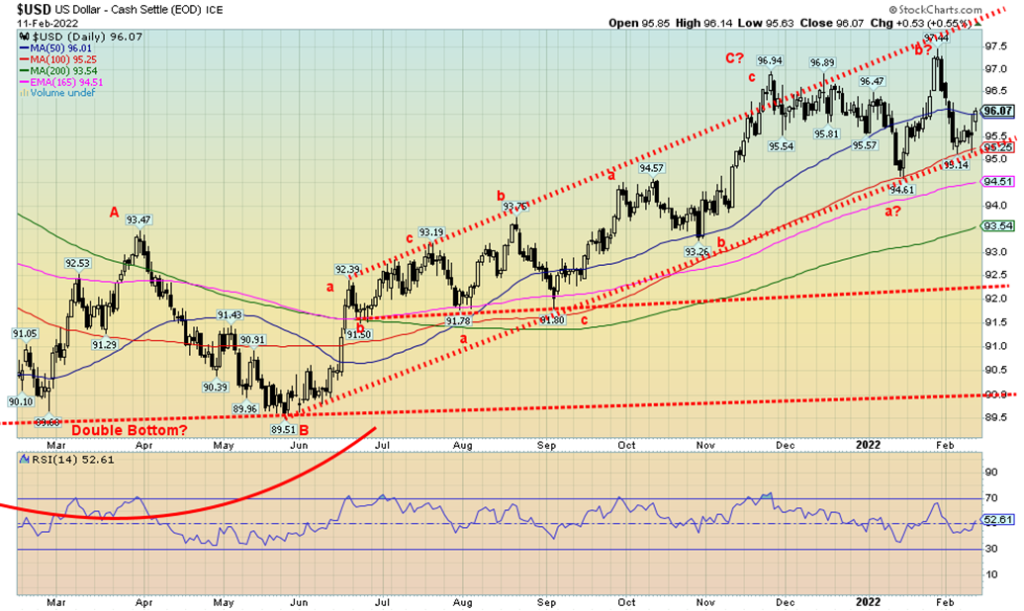
Fear of a Russian invasion of Ukraine drove the US$ Index higher on Friday as funds flow out of euros into US$ to buy primarily gold and bonds. The US$ Index was up 0.6% on Friday which covered the gain for the week. The euro fell 0.9%, the Swiss franc was a small safe haven gaining 0.1%, the pound sterling also gained up about 0.2%, while the Japanese yen fell 0.1%. The Canadian dollar, troubled by the ongoing border blockades, gained 0.1%, helped by the further rise of oil prices. The US$ Index tested down to support this week near 95.25 but failed to break down. Another move under 95.25 could set up a move down to 94.50. Further support is down 93.50. The US$ Index still appears to be in a corrective mode because of the series of what we see as abc-type patterns. That still suggests to us that the next move for the U.S. dollar is down, not up. That’s odd because if the Russian threat is real, then the euro should not perform well. Although technically Russia is not threatening the EU or the eurozone, just Ukraine. Ukraine is not a member of either the euro zone or the EU. Friday’s jump put the US$ Index at resistance. A move above 96.50 would suggest that we do have higher to go and could then retest the recent high at 97.44.
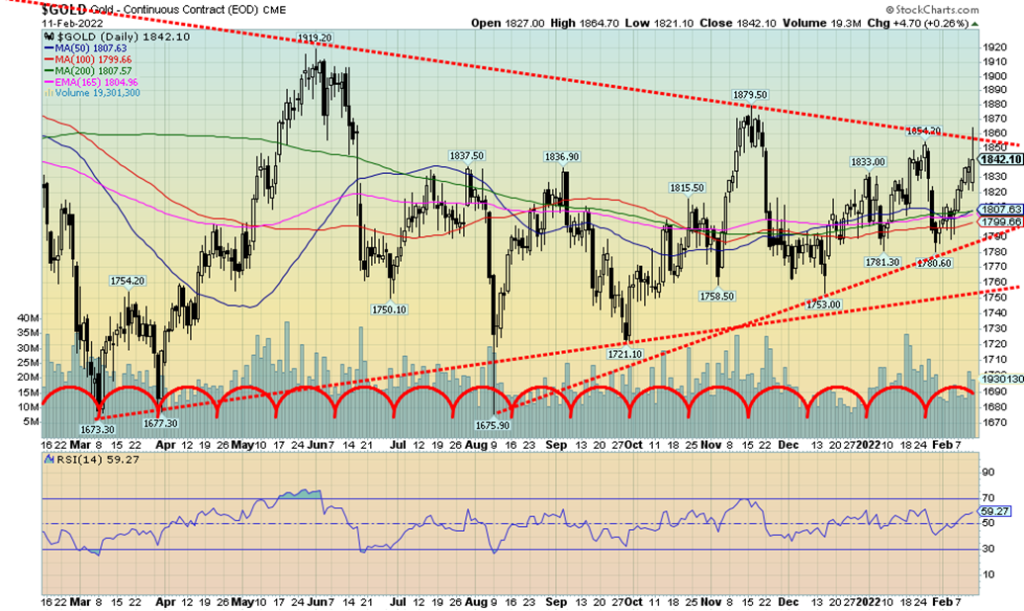
Gold enjoyed a good up day on Friday as fears of a Russian invasion of Ukraine dominated the news. On the week gold gained 1.9%, silver was up 4%, but platinum lost 0.5%. Of the near precious metals, palladium fell 4.2% but copper gained 0.4%. The gold stocks enjoyed a strong up week with the TSX Gold Index (TGD) up 6.3% and the Gold Bugs Index (HUI) up 7.8%. Gold hit a high Friday of $1,864.70 but failed to close over our $1,850/$1,860 key resistance level. Cash prices closed Friday at $1,860.20 after futures closed, suggesting that gold could open higher in the futures on Monday. Will we break out or will we fail? We note that every attempt of a breakout since the highs of August 2020 has ended in a failure.
The spike on Friday to $1,864.70 is worrisome as it could suggest that all gold did was spike into a top. The failure to close over key resistance on the futures is also worrisome. If gold is just hesitating before a bigger move, then it will now become important for gold to hold support at $1,790/$1,800/$1,810. A break of $1,790 would end this rally and suggest a decline to $1,760. Below that level the entire rally is in doubt. The December high was at $1,879.50 so it is now key that gold break to the upside and clear that hurdle as well. If that occurs, then the December low of $1,753 and especially the double bottom lows near $1,675 in March and August become meaningful. If we are truly making a large symmetrical triangle, then regaining above $1,880 becomes now quite important. A firm breakout above that level could project gold up to around $2,100. A breakdown under $1,790 confirmed under $1,760 might suggest a decline instead to $1,550.
Friday was a classic fear day, all because of the fear of a Russian invasion of Ukraine. Gold jumped, oil prices jumped, and the U.S. dollar jumped, but the stock market “tanked” while bond yields fell. Gold is seen as a safe haven along with bonds and the U.S. dollar. We also noted a growing lack of confidence in governments which in turn could lead to further currency depreciation and a move into hard currency such as gold. Note as well that the cryptos have also been rising this past week. Markets are also fearful of interest rate hikes in March. The question for all of us is, is the fear of war hype or is it real? Markets may not necessarily discern the difference until it becomes obvious which one it is.
So now the question is, are we headed for another failure because of the failure of the futures to break out above our $1,850/$1860 resistance and challenge that $1,880 December high? We’ll certainly see this coming week as fear begins to grip the world.
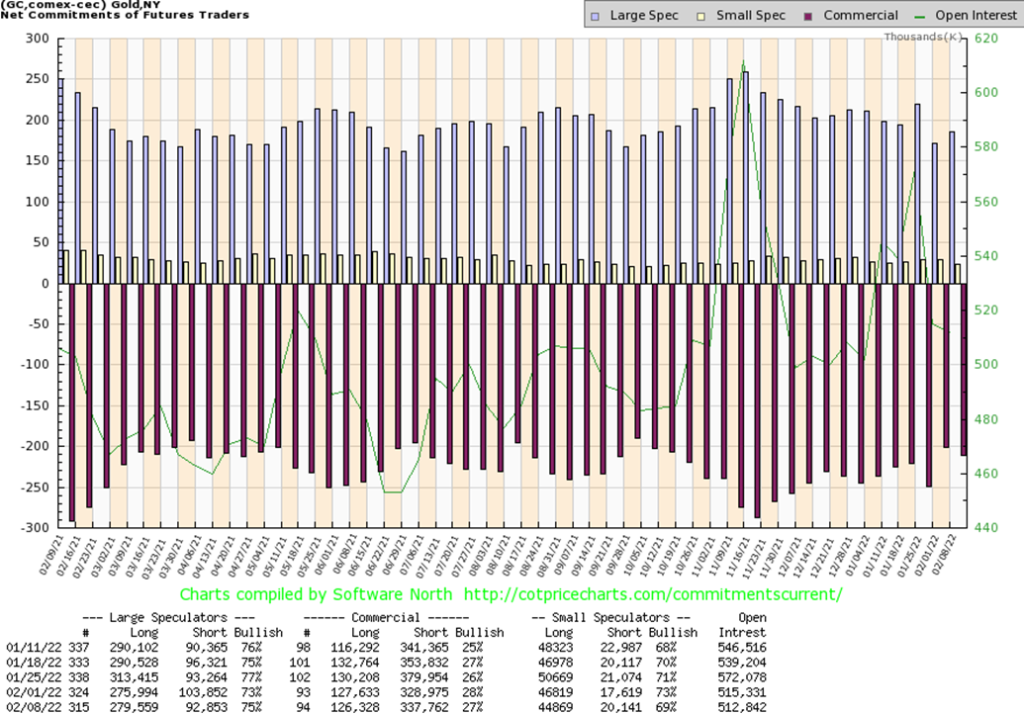
The gold commercial COT (bullion companies, bullion banks) slipped to 27% this past week from 28%. Short open interest rose by almost 9,000 contracts while long open interest shed over 1,000 contracts. All of this contributed to an up week for gold. Overall open interest fell about 3,000 contracts. The large speculators COT (hedge funds, managed futures etc.) rose to 75% from 73% as they added about 4,000 longs while shedding some 11,000 shorts. While the commercial COT remains somewhat positive, we are still shy of the levels seen last September/October before an earlier move to the upside by gold. We are ambivalent about this report as it is not fully convincing that we are headed higher.
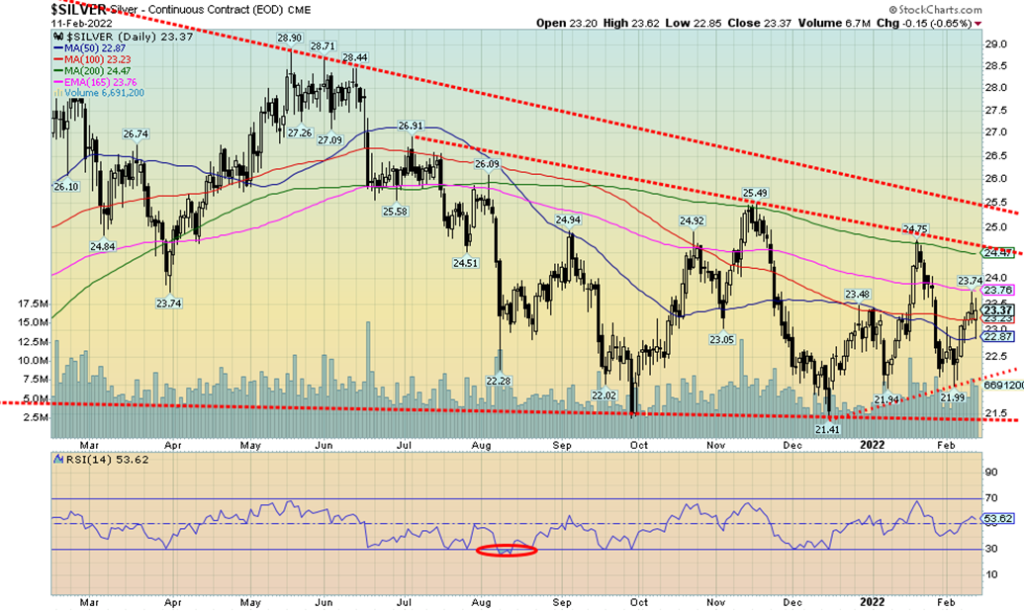
If gold is threatening to break out over important resistance points, silver remains well short of its breakout points. Silver did gain 4% this past week but remains well short of even the January 2022 high of $24.75. Gold was making new highs but silver was well short of its recent highs. A divergence? Silver should be leading. Yes, silver outperformed gold this past week but it lags gold on the charts and that remains a concern. The silver COT as we note next remains bullish. The trouble is, with silver lagging and well short of that recent high, it leaves us in a quandary as to whether we will break higher or fail. Silver needs to break above $24.75 to convince us that we are going higher. Any breakdown back under $22.85 now (Friday’s low) would suggest to us that we are now back to retesting support near $22.00. Under $22 the rally is officially over and we could then retest the December low of $21.41.
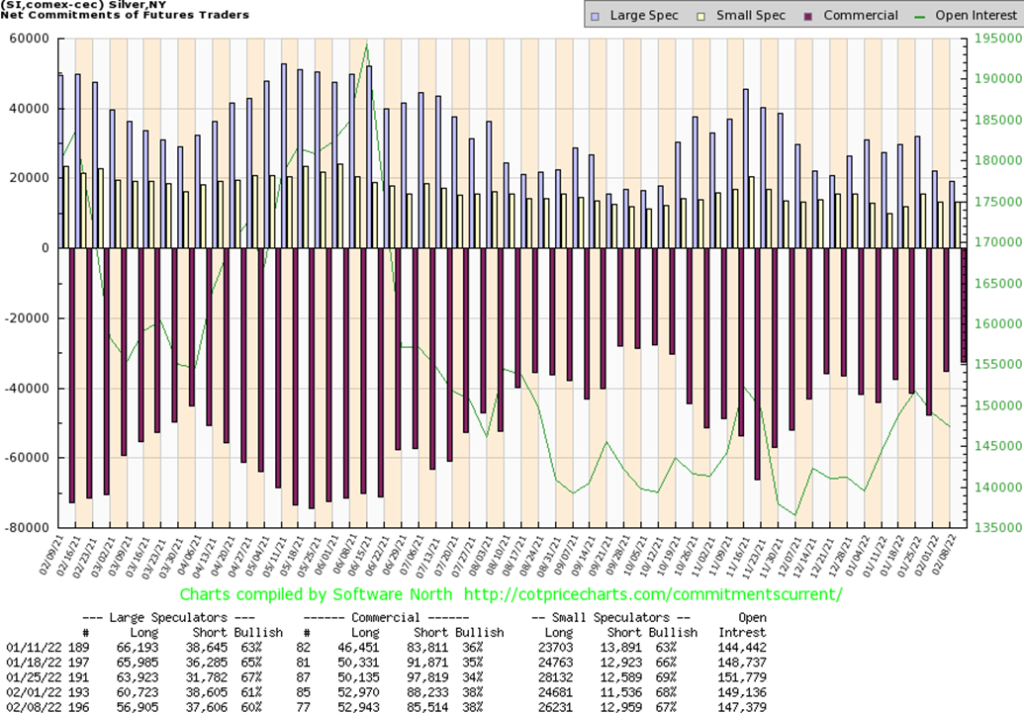
The silver commercial COT was steady at 38% this past week. Long open interest was largely unchanged while short open interest actually fell about 3,000 contracts. Overall open interest was down about 2,000 contracts on an up week. The large speculators COT slipped slightly to 60% as they shed about 4,000 long contracts and 1,000 short contracts. The silver COT remains bullish at some of the best levels since last September/October just before an earlier up move.
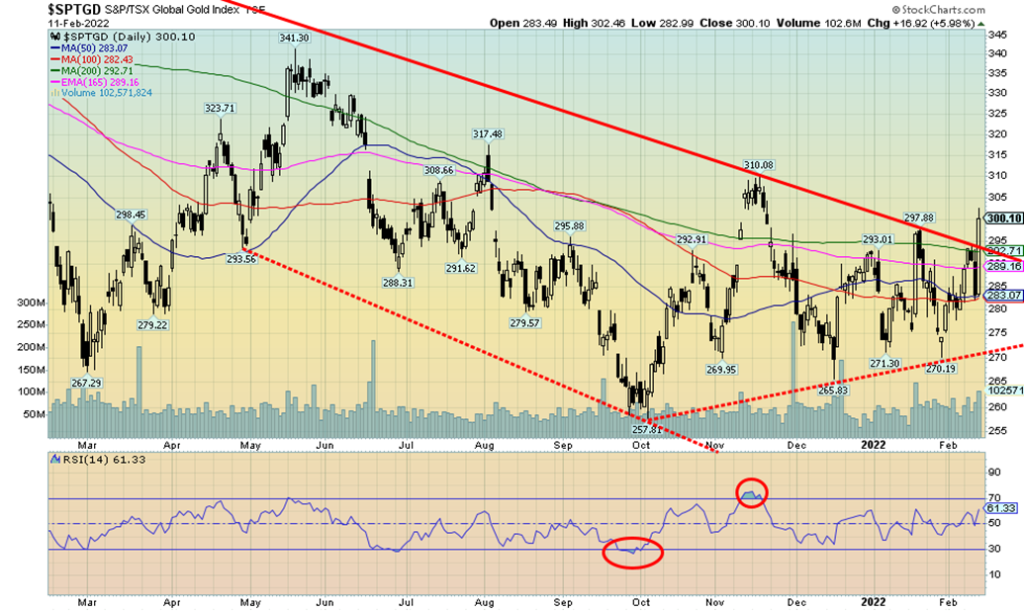
While gold’s attempt to break out over $1,860 has so far been stymied, the gold stocks did suggest a breakout with the big up day on Friday. On the week the TSX Gold Index (TGD) rose 6.3% while the Gold Bugs Index (HUI) was up 7.8%. The TGD cleared 295 resistance on the daily charts on Friday, closing at 300.10. Friday was a very impressive day with the TGD up 6.0%. However, that is just one day. Key now is that the TGD holds above 295 and closes above that level for at least another couple of days. A breakdown under Friday’s low of 283 could signal that the rally is over. A breakdown under 270 would seal the deal and suggest further losses. The breakout of what appears as a symmetrical triangle has potential for the TGD to rise to around 350 a further 17% from current levels. The post March 2020 crash highs were made at 417 in August 2020. With an RSI currently at 61 there is room to move higher. The Gold Miners Bullish Percent Index (BPGDM) was still at 30 on Friday, a level that would also suggest that the gold stocks have further to rise.
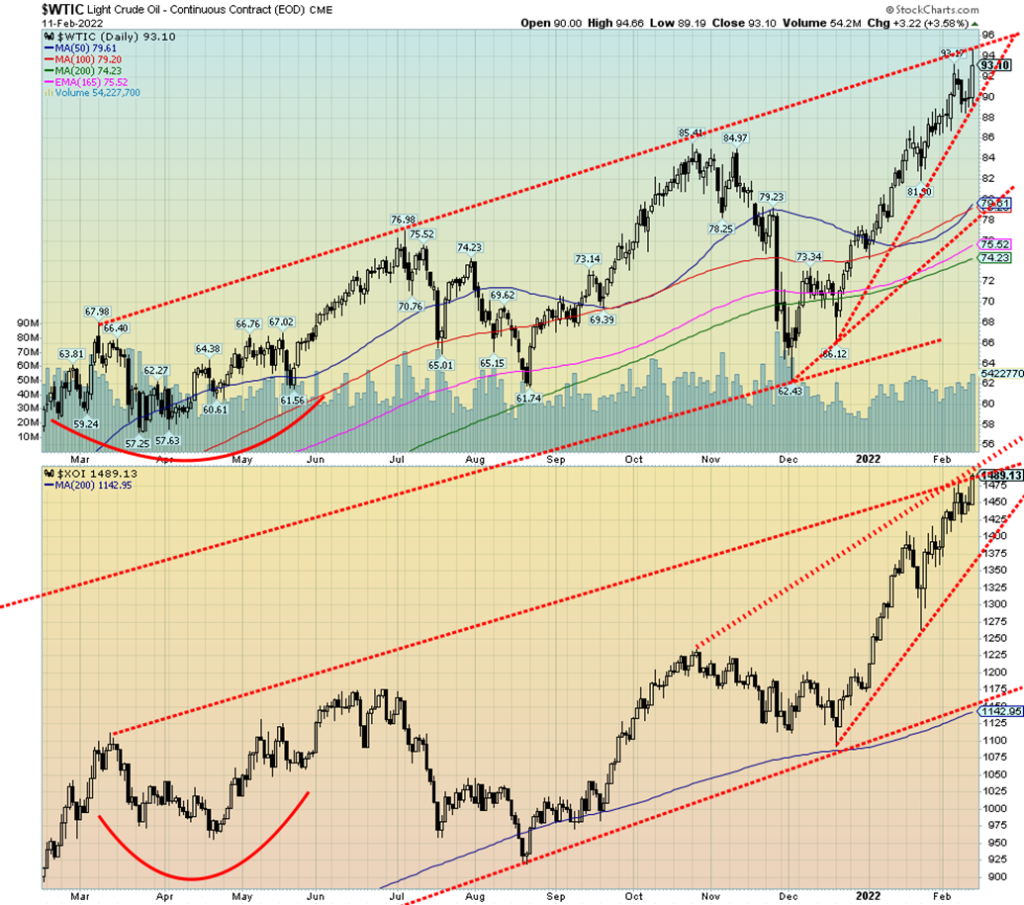
Breaking to the upside? Or faking out? WTI oil prices (and Brent Crude) both hit 52-week highs this past week on fears of an imminent invasion of Ukraine by Russia. Is it hype? Or is it real? If they don’t invade, will it be back down we go? WTI oil hit a high this past week of $94.66 before settling back to close at $93.10 up 0.9% on the week. Support we pegged at around $89 last week held. The chart of WTI oil appears to be an ascending wedge triangle. It is a bearish pattern. Except in this case oil prices are now too deep into the wedge, suggesting to us that this pattern may fail. We may actually go higher. In a wedge triangle the breakdown (of an ascending wedge) or breakout (of a descending wedge) usually occurs around the two-thirds mark, according to John Murphy’s Technical Analysis of the Futures Markets. We are well past the two-thirds
mark, suggesting to us that this pattern, instead of breaking down, could be headed even higher. Naturally, we won’t know for sure until we break over at least $96. We had noted earlier that we have potential target levels up to $108. Some forecasters are suggesting even higher to $150 (and if that happened new all-time highs). However, we also need to note the breakdown points. WTI oil could break down under $90. A breakdown under $88 would suggest further declines to better long-term support near $82 and $79.
Irrespective of what one might think about the ongoings in Russia/Ukraine, the world is on edge over a possible invasion. Is it for real? Or merely another feint? On one hand the cry is that Russia will invade and then on the other hand they admit they don’t know whether Russia is committed to invading. Some are noting this could happen by Wednesday. Others say it won’t happen until after the Olympics. No matter how one looks at this, the hype of a possible invasion will keep the world on edge and oil prices trending higher. Higher oil prices are very beneficial to Russia. Russia is the world’s third largest oil producer and holds the 8th largest reserves. As to natural gas (NG), Russia is the world’s second largest producer and holds the world’s largest NG reserves. Attempts to find sufficient energy reserves for the EU in the event of an invasion and a cut-off of Russia’s energy supply to the EU have fallen quite short of actual needs. The EU is heavily reliant on Russian NG and oil to fuel their economies with some EU countries reliant on Russia for 100% of their energy needs. Russia, because of high oil prices, has been able to replenish their international reserves. They now hold the world’s fourth highest international reserves, estimated at $630 billion. They have also shed their reserves of US$ bonds and replaced them with yuan and gold for the most part. The large holdings of reserves could allow Russia to withstand any further sanctions.
Despite the conflab in Europe, NG prices fell this past week, down 13.8%. The energy stocks, however, continued their rise with the ARCA Oil & Gas Index (XOI) up 2.7% to fresh 52-week highs and the TSX Energy Index (TEN) up 1.2%. It may be that the XOI is forming an ascending wedge triangle as well. However, it would appear that it could still have more room to rise within the triangle. The breakdown point is currently at 1,375, over 100 points from current levels. NG breaks down under $3.80. It is difficult to say here as to what NG prices might do going forward as they are currently at a support zone. They need to rise above $4.70 once again to suggest higher levels. And they need to break out over $5.60 to suggest a run at the highs of October 2021 at $6.47.
Copyright David Chapman, 2022
__
(Featured image by AbsolutVision via Pixabay)
DISCLAIMER: This article was written by a third-party contributor and does not reflect the opinion of Born2Invest, its management, staff, or its associates. Please review our disclaimer for more information.
This article may include forward-looking statements. These forward-looking statements generally are identified by the words “believe,” “project,” “estimate,” “become,” “plan,” “will,” and similar expressions. These forward-looking statements involve known and unknown risks as well as uncertainties, including those discussed in the following cautionary statements and elsewhere in this article and on this site. Although the Company may believe that its expectations are based on reasonable assumptions, the actual results that the Company may achieve may differ materially from any forward-looking statements, which reflect the opinions of the management of the Company only as of the date hereof. Additionally, please make sure to read these important disclosures.
David Chapman is not a registered advisory service and is not an exempt market dealer (EMD) nor a licensed financial advisor. He does not and cannot give individualised market advice. David Chapman has worked in the financial industry for over 40 years including large financial corporations, banks, and investment dealers. The information in this newsletter is intended only for informational and educational purposes. It should not be construed as an offer, a solicitation of an offer or sale of any security. Every effort is made to provide accurate and complete information. However, we cannot guarantee that there will be no errors. We make no claims, promises or guarantees about the accuracy, completeness, or adequacy of the contents of this commentary and expressly disclaim liability for errors and omissions in the contents of this commentary. David Chapman will always use his best efforts to ensure the accuracy and timeliness of all information. The reader assumes all risk when trading in securities and David Chapman advises consulting a licensed professional financial advisor or portfolio manager such as Enriched Investing Incorporated before proceeding with any trade or idea presented in this newsletter. David Chapman may own shares in companies mentioned in this newsletter. Before making an investment, prospective investors should review each security’s offering documents which summarize the objectives, fees, expenses and associated risks. David Chapman shares his ideas and opinions for informational and educational purposes only and expects the reader to perform due diligence before considering a position in any security. That includes consulting with your own licensed professional financial advisor such as Enriched Investing Incorporated. Performance is not guaranteed, values change frequently, and past performance may not be repeated.


Grifols Announces Positive Results from Fanhdi Phase IV Study
Grifols reports positive results from its Phase IV study of Fanhdi for von Willebrand disease (VWD) treatment, showing safety and...


Ecomill Authorized to Operate Under the New EU Crowdfunding Regulation
Ecomill joins authorized crowdfunding platforms under European Regulation. Dedicated to energy transition and sustainability, it enables capital raising for renewable...


Colorado Residents Can Purchase Cannabis License Plates
The cannabis license plate auction in Colorado is not only an opportunity to acquire a unique item, but above all...


Shiba Inu: $12 Million Funding Round for New Blockchain
In connection with TREAT, Shiba Inu mentions several times the goal of designing the project in accordance with legal regulations....


Soybeans and the Products Closed Lower Last Week
Reports of great export demand in Brazil provide some support. Reports indicate that China has been a very active buyer...
 |
|
 |  |
 |
|
-

 Crowdfunding2 weeks ago
Crowdfunding Campaign to Preserve the Tradition of the Navatas of the Gállego River
-

 Crypto7 days ago
Hong Kong Approves Bitcoin and Ethereum ETFs: A New Chapter for Cryptocurrencies
-

 Fintech2 weeks ago
Fintech Report 2023: Venture capital Funding for Fintech and Crypto Startups Collapses
-

 Impact Investing4 days ago
Green Arms Raised Almost 1 Million in its Crowdfunding Round on CrowdFundMe