Featured
Why this Past Week the Dow Jones Closed in Scoring Position
Since the Dow Jones’ last all-time high on January 4th, most days have closed with more 52Wk lows than highs. And over at the NASDAQ, its been brutal. On January 24th, the NASDAQ saw 1,750 new 52Wk lows on a day when 5,175 issues were trading; more than a third of the companies trading that day closed at a 52Wk low. Out of curiosity, I checked the NASDAQ Composite’s BEV value on January 24th; a BEV of -13.72%.
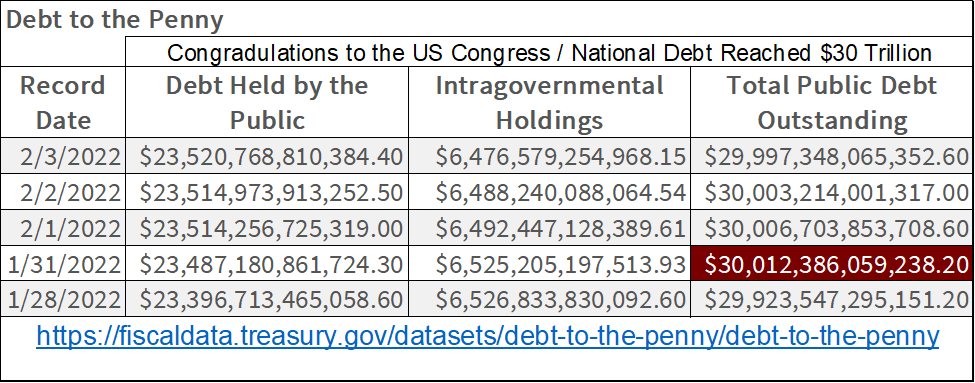
Before I begin my weekly market letter, I thought I’d give credit where credit is due. On Monday, January 31st of this week, for the first time the US National Debt broke above $30 trillion dollars. This achievement in malfeasance would not be possible without the fraud, waste, and financial abuse of the American taxpayers by all who drive “policy” in Washington DC, regardless of what their preferred-gender pronouns may be.
Well done guys.
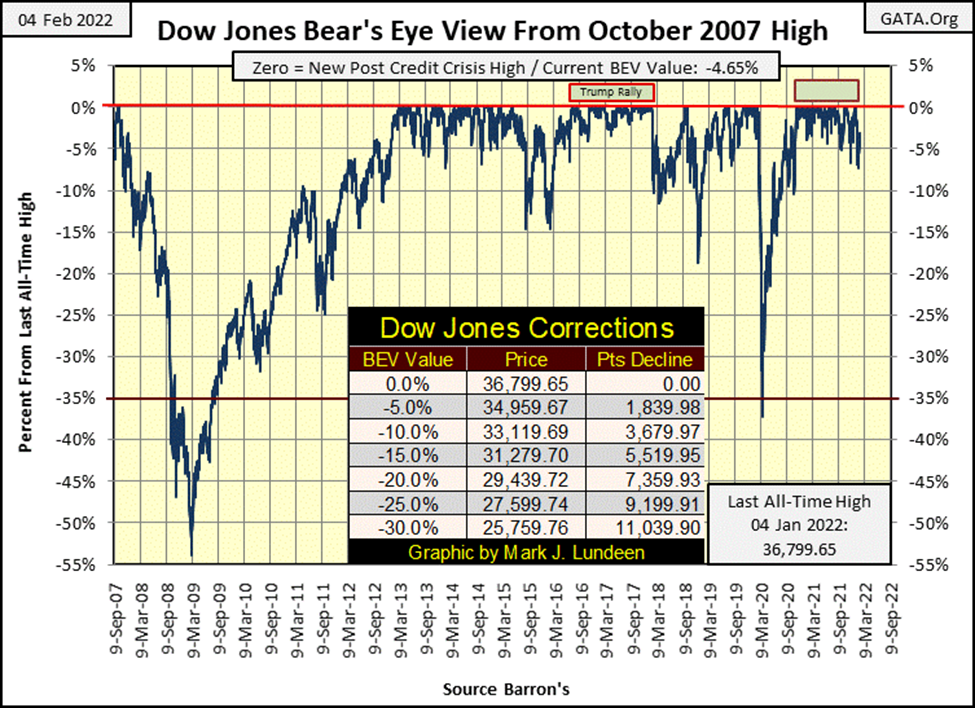
All this week the Dow Jones closed in scoring position; that is within 5% of its last all-time high from a month ago on January 4th. At its post-January 4th lows, the Dow Jones had deflated only to its BEV -7.17%, not even a 10% correction so far.
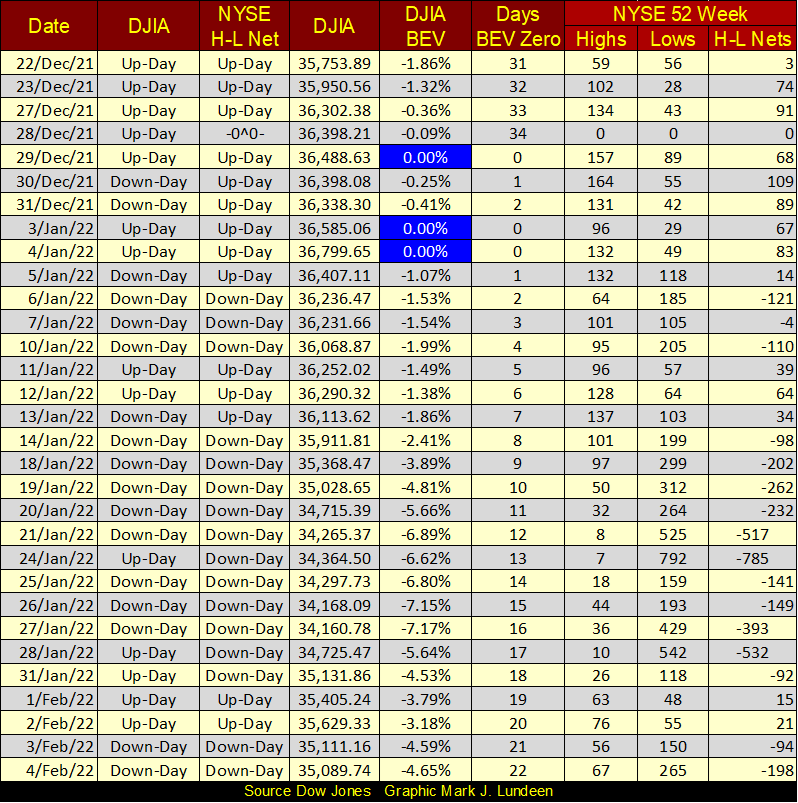
So, what is there to do at the close of this week? As always, we note the weekly close, a BEV of -4.65%, and the BEV lines above and below it. At the close of this week, that makes the Dow Jones’ BEV Zero (0% / new all-time high) and -5% lines our trip wires. I placed a table in the chart below to note the Dow Jones point values for these levels; 36,799 for the BEV 0% line and 34,959 for the BEV -5% line.
Next week, we wait to see which of these levels the Dow Jones crosses. That is if it does cross one, as it may not. I’ve been short-term bullish for the past eighteen months or so. I don’t see any reason to change my position on the market. So, I expect we’ll see more new all-time highs (BEV Zeros) below before Mr Bear once again begins clawing back the bulls’ capital gains in a historic bear market.
When will this historic bear market begin? Could be next month, or maybe not until next year. I really don’t know. But when I consider the total levels of debt the American economy is now carrying. Impossible sums of debt that someone has to service with interest and principle payments, like the above $30 trillion the Federal Government must now service. Then there are Uncle Sam’s unfunded liabilities, such as Social Security and Medicare, also the debt carried by corporations, consumers, and students.
I’m expecting whenever Mr Bear does come, he’ll clawback the Dow Jones, and most of everything else that is bought and sold below their BEV -55% lines, and keep going down into market history.
That is something I’m not looking forward to!
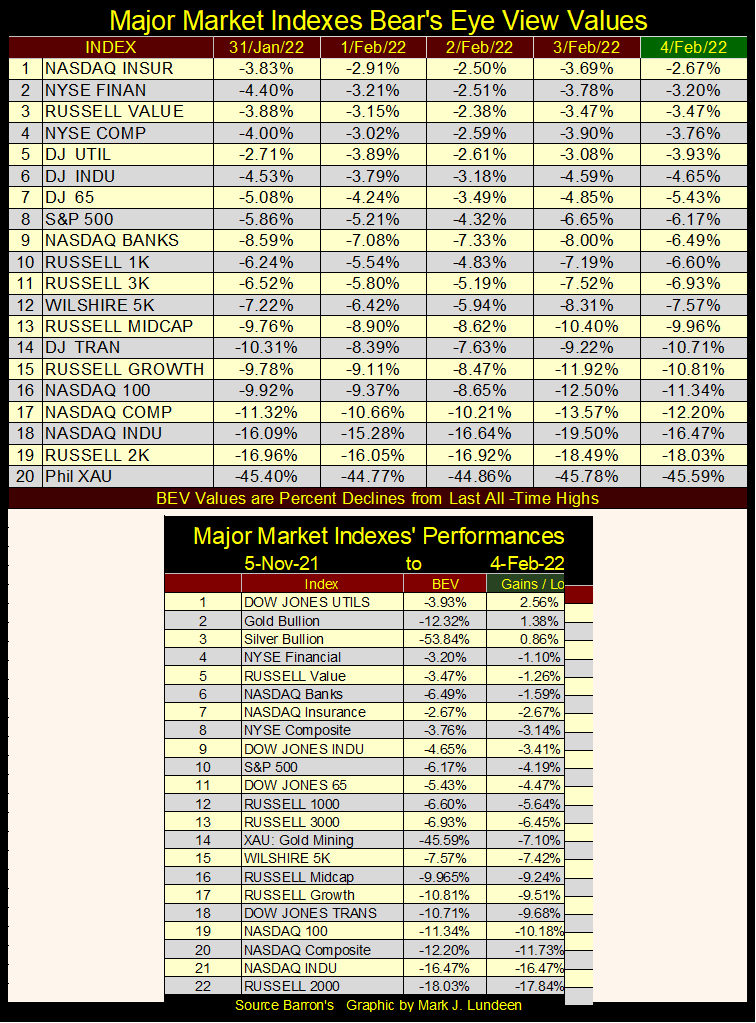
Two weeks ago we had three days in the table below with none of these major market indexes closing in scoring position. Everything had a BEV value of 5.0% or more. But this week the market turned around nicely. No BEV Zeros to be seen. However, some of these indexes closed within 5% of their last all-time highs. Being short-term bullish, I’m expecting next week or the week after we’ll once again see BEV Zeros below and an increase in these indexes closing within scoring position.
I’m recommending my readers to buy? Sorry to say, but I’m not anyone’s investment advisor. I think of myself as a market enthusiast, and as a market enthusiast, I don’t get paid enough to advise anyone. Meaning; you can pay a lot more to get worse views on the markets. I’m only sharing my market research with my readers. What they do with it is their concern.
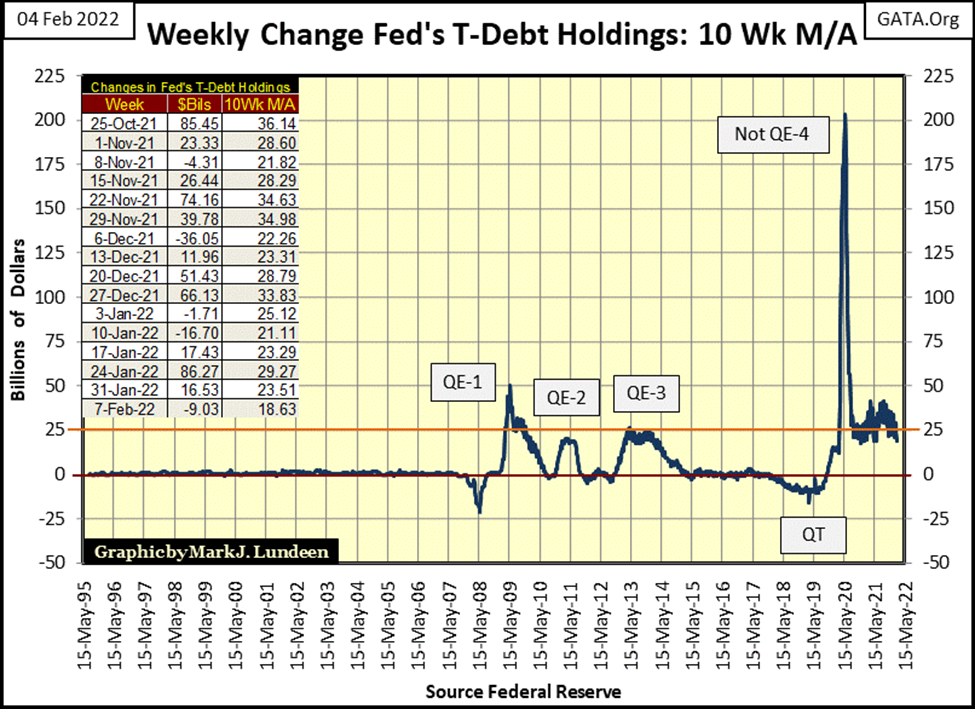
That said, my long-term bearish view on the market is that in the past forty years, the Dow Jones has seen its valuation inflated from around 700 in August 1982, to over 36,000 a month ago. And most of these gains are from the FOMC “injecting liquidity” into the financial system, as seen in the chart below.
Considering everything, looking at the big picture, my best guess is; the Dow Jones could at best advance another 10% before it tops. From the Dow Jones last all-time high of 36,977, another 10% would see it advance to 40,674. Then maybe the Dow Jones’ last all-time high of January 4th * IS * the last all-time high of this massive four-decade-long bull market.
As I’m the kind of guy who is NOT likely to jump out of a perfectly good airplane just because I have a parachute on; I’m out of this market. And I’m not coming back until the Dow Jones’ valuation has been deflated by at least 60%, that’s a Dow Jones close below 15,000, and maybe not even then.
Counter-party risk in today’s global financial system is astounding. Come the day when checks from major financial institutions keep getting “lost in the mail”, or actually begin bouncing for reasons of insufficient funds, we’ll know that Mr Bear has crossed his first of many milestones on his, and our journey to the bottom. What other milestones can we expect to cross? Central banks stand by helplessly as their client banking systems cease to function, and close their doors for business. Yeah; “inject” some “liquidity” into that you bastards!
What price will gold and silver have when that happens?
I’m no longer a big fan of Warren Buffet. Since the high-tech bear market of 2000 to 2002, it seems he has decided to serve the dark side of the force. Still, in the past he has made astute observations; such as “no one knows for sure which swimmers are wearing swim suits until the tide goes out.”
When Mr Bear is finished with his clean up of Wall Street, many major corporations that today are well known names, will declare bankruptcy because they failed to service the massive debts they’ve taken on during this bull market. Why risk money in a market like this?
Below is my table for the NYSE 52Wk Highs and Lows. Since the Dow Jones’ last all-time high on January 4th, most days have closed with more 52Wk lows than highs. And over at the NASDAQ, its been brutal. On January 24th, the NASDAQ saw 1,750 new 52Wk lows on a day when 5,175 issues were trading; more than a third of the companies trading that day closed at a 52Wk low.
Out of curiosity, I checked the NASDAQ Composite’s BEV value on January 24th; a BEV of -13.72%. With a third of its issues making 52Wk lows, my gut feelings is it should have been something below -30% from its last all-time high. I don’t understand this market, except I believe it to be a very dangerous market.
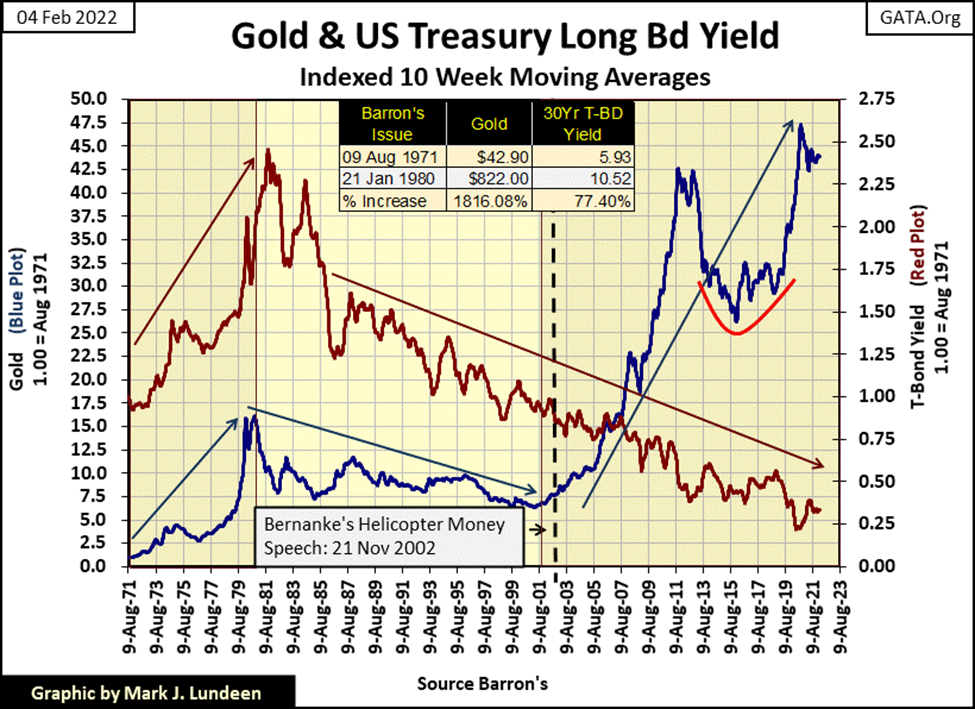
A recurring theme concerning gold and interest rates is rising rates and bond yields are bad for gold, as rising rates and yields makes debt more attractive than gold, an asset that offers its owners no income. This is a very logical argument, but it it true? It wasn’t from 1971 to 1980, during gold’s first post Bretton Woods bull market, as seen in the chart below, when rising bond yields (Red Plot) resulted in higher gold prices (Blue Plot).
In the chart below, we’re looking at the 10Wk M/A for the price of gold and the US-long bond’s yields’ indexed values, with 09 August 1971 = 1.00. From Barron’s 09 August 1971 to its 21 January 1980 issues, gold (Blue Plot) increased by a factor of 14.98, while the long bond’s yield increased by a factor of 1.79. The actual values for gold and the Treasury’s long bond yields are seen in the table below.
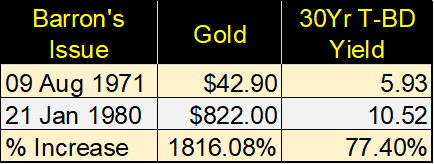
So, for the nine years spanning 1971 to 1980, the price of gold increased by $779.10 (1816.08%) during a time when T-bond’s long term yields increased to something above 10%. Why during these nine years did the price of gold increase by a factor of 14.98, as T-bd yields for the first time in history increase to over 10%?
First thing to understand is why did bond yields increase to double-digits decades ago?
It wasn’t just T-bonds offering double-digit yields during the late 1970s and early 1980s. Creditors everywhere were receiving double-digit rates. Money deposited in banks were yielding double-digits rates too. The cause of rising rates and yields was double-digit CPI inflation. In other words, dollars in the decade following the abandonment of the Bretton Wood’s $35 gold peg, soon began to be understood by all as a wasting asset.
Bonds earned the moneker of “certificates-of-confiscation.” Really, in the late 1970s and early 1980s “certificates-of-confiscation” was a term used when discussing the bond market in the financial media. As was “bond-market vigilantee” for those bond buyers who went on buyer strikes to force bond prices down to force bond yields higher. The vigilantees refused to continue losing purchasing power on their returns in the bond market.
It’s fair saying that from 1971 to 1980, the price of gold advanced even as bond yields increased to double-digits. As in its first decade, the post-Bretton Woods’ dollar was a disaster no wise investor wanted to hold on for long for fear of loss.
In a nutshell, the above explains why rising bond yields and interest rates from 1971 to 1980 didn’t depress the price of gold – because the FOMC’s “monetary policy” was so appalling, that worldwide it risked the dollar’s reserve currency status. During that decade, rising bond yields (deflation in the dollar’s purchasing power) made gold and other precious metals assets more attractive to investors and fiduciaries of other people’s money.
All that changed in January 1980, when from an all-time high in gold’s Bear’s Eye View chart below, gold crashed by 43% by March (second red circle). Gold, silver and other precious metal assets began a brutal, two-decade long bear market.
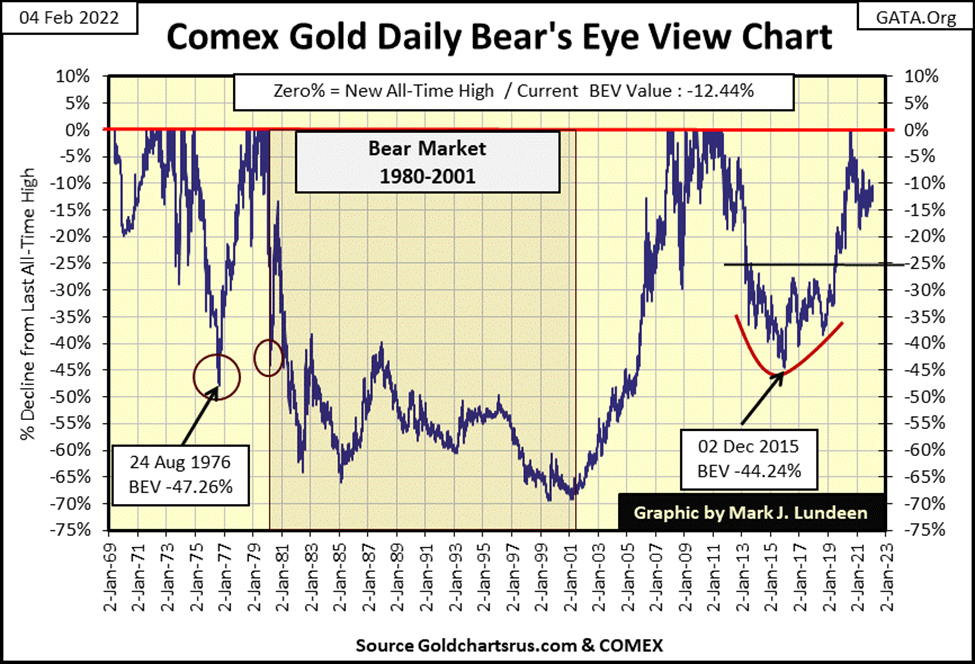
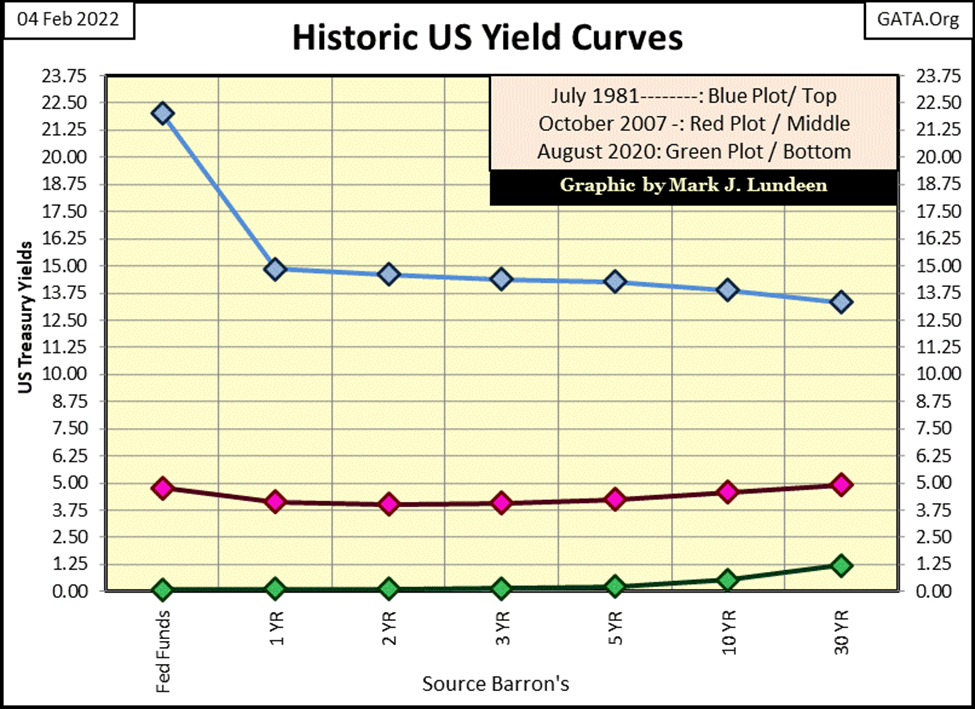
Though bond yields didn’t top until October 1981, the bull market in gold ended in January 1980, because then Fed Chairman Paul Volcker made it clear he was going to terminate the double-digit CPI inflation plaguing the dollar, as he increased the Fed Funds Rate far above the yield curve (below) and the rate of CPI inflation in July 1981.
In the early 1980s, Volcker could, and did invert the yield curve as seen below.
Such a drastic inversion of the yield curve today would be impossible because governments, corporations and individuals today carry massive debt loads. Even having the yield curve increase to where it was in October 2007 (Red Plot), before Dr. Bernanke’s QE#1, would today result in massive shock waves of counter-party failure, and very possibly a collapse in the US dollar and currencies worldwide.
In July 1981, the national debt was less than a trillion dollars; $961 billion to be exact. In October 2007 the national debt was $9.05 trillion dollars, less than a third of what it is today.
Any talk about increasing interest rates coming from the FOMC is just that – TALK. So, there is no means for the “policy makers” to put rising CPI inflation back into its box, as they did when Paul Volcker was Chairman of the Federal Reserve. We are going to see inflation as did the Roman Empire in the 4th century AD. What was that like? Wait a few years, and you’ll find out.
Maybe I shouldn’t have congratulated Congress for increasing the national debt to $30 trillion?
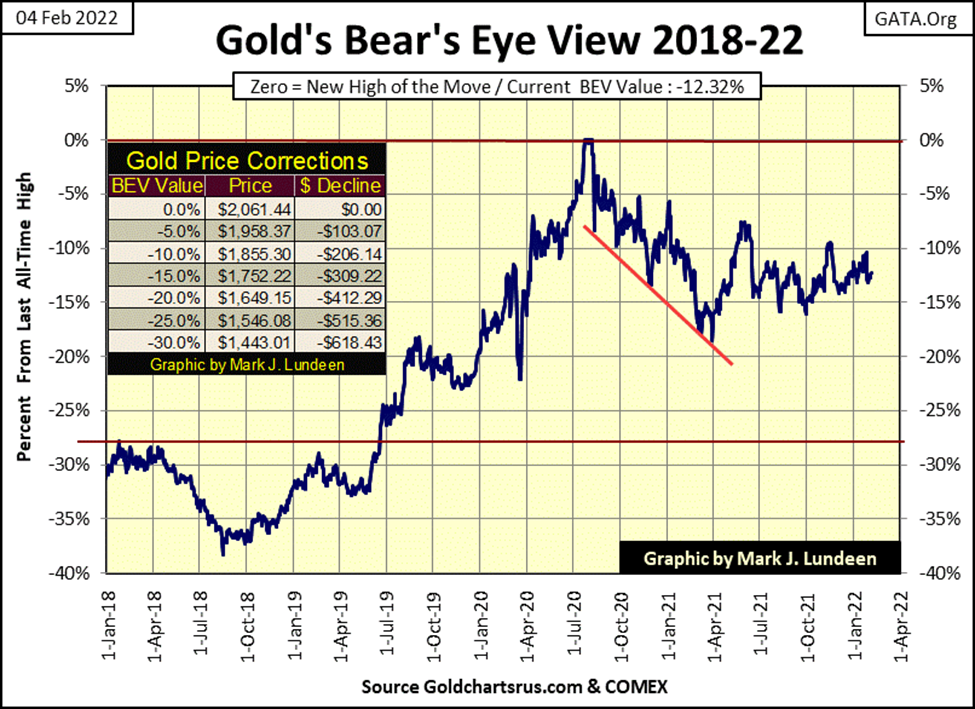
Next is gold’s BEV chart. Gold’s pennant formation continues to build. One day gold will breakout from this pennant, but will it do so by going up or down? I’m bullish on gold, so my vote is for it to break out to the upside.
I could be wrong; that would still not change my opinion that 21st century smart money is taking as big a position in gold and silver as they reasonably can. The precious-metal miners remain attractive investments too.
For retail investors, such as myself, we should avoid precious-metals derivatives such as futures contracts, or using leverage in purchasing actual precious metal.
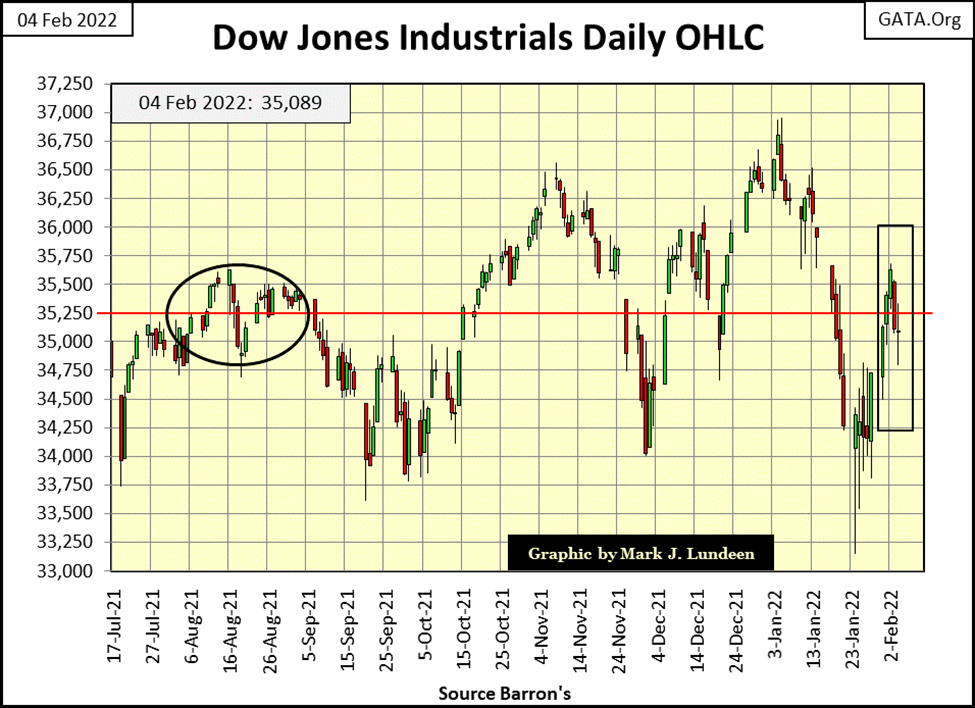
Here is the Dow Jones in daily bars. I usually place this chart at the beginning of a letter, but this week it really didn’t fit in my narrative above.
The first few weeks of 2022 weren’t kind to the Dow Jones. Then last week the idiot savants at the FOMC refused to allow the venerable Dow to close below 34,000. Take a look at Monday of last week in the chart below. Tell me something didn’t happen on the Dow Jones’ way to closing with a 32,000 handle.
But that was then, and this is now. And now it looks as if the Dow Jones is once again headed towards a new all-time high in the weeks to come. That isn’t a prediction on my part. I’m just looking at the chart below, and the Dow Jones appears to be heading up once again. To a short-term bull such as myself, it’s easy to see yet another new all-time high for the Dow.
I’m going to skip gold’s and the Dow Jones’ step sum charts for this week as they have become repetitive. So, I’m heading straight to their step sum tables below.
Both gold and the Dow Jones’ daily volatility’s 200-day M/A remains very low. Gold is struggling for lack of some daily excitement. It’s having difficulty getting within 10% of its last all-time high, a BEV value that is less than -10% in the table below. On the other hand, the Dow Jones thrives on low daily volatility. Look at the Dow above in daily bars. There isn’t a single Dow Jones 2% day in the chart above, and now it’s advancing again.
Seeing the Dow Jones bounce off its 15-count of -9 (below) is something I expected. But will this bounce take the Dow Jones into market history with another all-time high. I think it will.
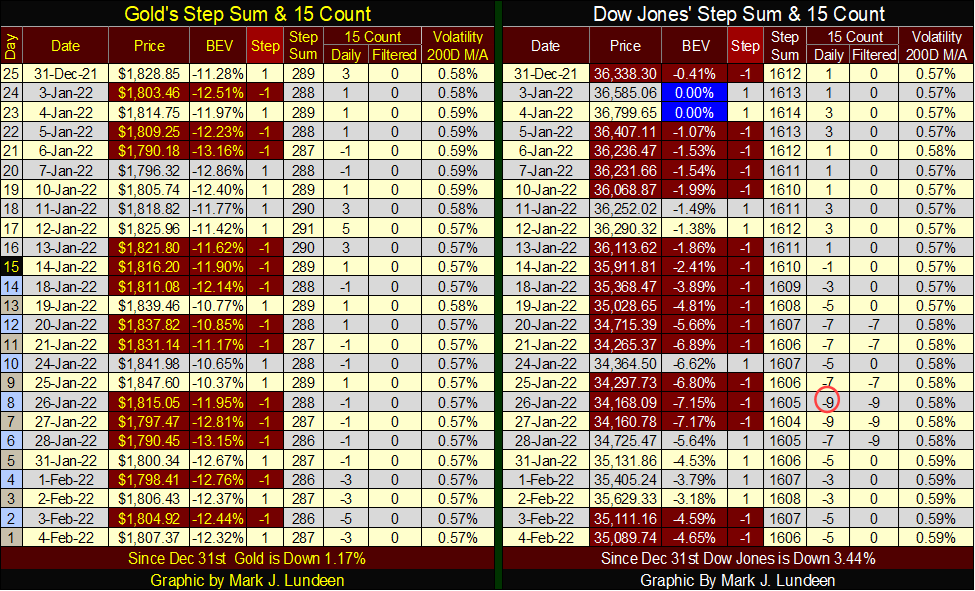
Gold in the step sum table above looks to be waiting for something to happen. It can’t go up, and it doesn’t want to go down, so since November 19th gold has oscillated between its BEV -10% and -15% lines, almost three months now. That’s a long time for a market to be running in place. It’s hard believing this will continue until the spring thaws come. But until then, we watch and wait.
NASA finally got its James Webb space telescope into orbit, and is now unfolding this massive instrument. So far, everything is going according to plan. This is a fascinating piece of kit, that has many times the power to observe distance objects in space than the Hubble space telescope, and is designed to observe in the inferred spectrum.
I’m looking forward to seeing its first photos, sometime in June of this year.
https://spaceplace.nasa.gov/james-webb-space-telescope/en/
__
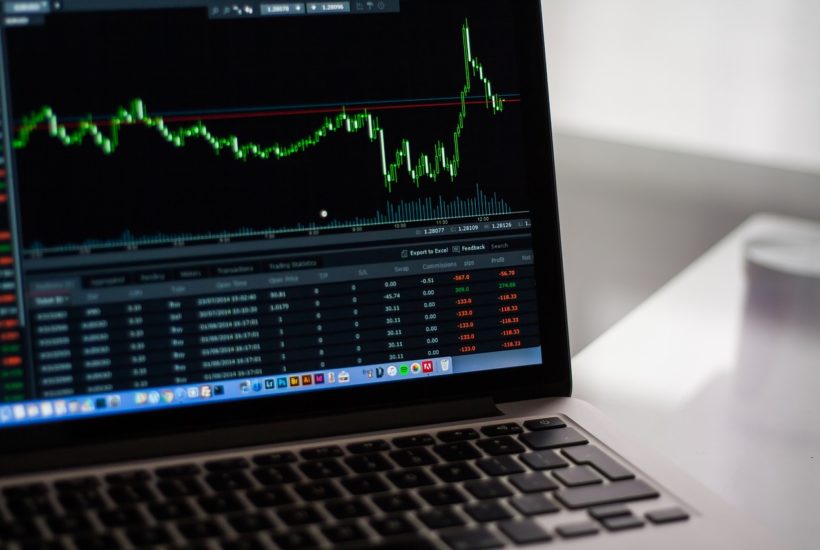
(Featured image by StockSnap via Pixabay)
DISCLAIMER: This article was written by a third-party contributor and does not reflect the opinion of Born2Invest, its management, staff, or its associates. Please review our disclaimer for more information.
This article may include forward-looking statements. These forward-looking statements generally are identified by the words “believe,” “project,” “estimate,” “become,” “plan,” “will,” and similar expressions. These forward-looking statements involve known and unknown risks as well as uncertainties, including those discussed in the following cautionary statements and elsewhere in this article and on this site. Although the Company may believe that its expectations are based on reasonable assumptions, the actual results that the Company may achieve may differ materially from any forward-looking statements, which reflect the opinions of the management of the Company only as of the date hereof. Additionally, please make sure to read these important disclosures.


PharmaMar Increases Profit by 64% in the First Quarter, Up To 2.3 Million
PharmaMar's profits rebound with a 64% increase to 2.3 million euros in Q1 2024 compared to the same period last...


Cannabis Reform in Belgium: What Changes Does the Latest Report Propose
Belgium faces challenges in drug policy, especially with cannabis. Recent Senate reports highlight flaws in the current system, urging reforms...


Druo Processes $50 Million in International Transactions
Druo, a Colombian fintech company, responds to the need for streamlined and cost-effective financial processes in the payments sector amid...


Grifols Announces Positive Results from Fanhdi Phase IV Study
Grifols reports positive results from its Phase IV study of Fanhdi for von Willebrand disease (VWD) treatment, showing safety and...


Ecomill Authorized to Operate Under the New EU Crowdfunding Regulation
Ecomill joins authorized crowdfunding platforms under European Regulation. Dedicated to energy transition and sustainability, it enables capital raising for renewable...
 |
|
 |  |
 |
|
-

 Business2 weeks ago
TopRanked.io Weekly Affiliate Digest: What’s Hot in Affiliate Marketing [CamSoda Affiliate Program]
-

 Impact Investing2 days ago
Loyal Is Working on a Drug to Extend the Life of Dogs
-

 Crowdfunding1 week ago
4fund.com, a Polish Crowdfunding Portal Which Has Raised 275 Million Enters the Italian Market
-

 Crypto2 weeks ago
Tensor (TNSR): Marketplace for Solana NFTs Launched its Own Coin