Featured
2021 begins with markets overvalued, but will it end that way?
Gold’s last all-time high was $2061 on August 6th and has spent the best part of the past six months correcting its breaching the $2000 level. Gold did something similar when it first breached the $1000 level in March 2008, and for the same reason. But in 2008 gold corrected for six months, declining by 30% in the process. So far in 2020-21, gold has yet to correct 15%.

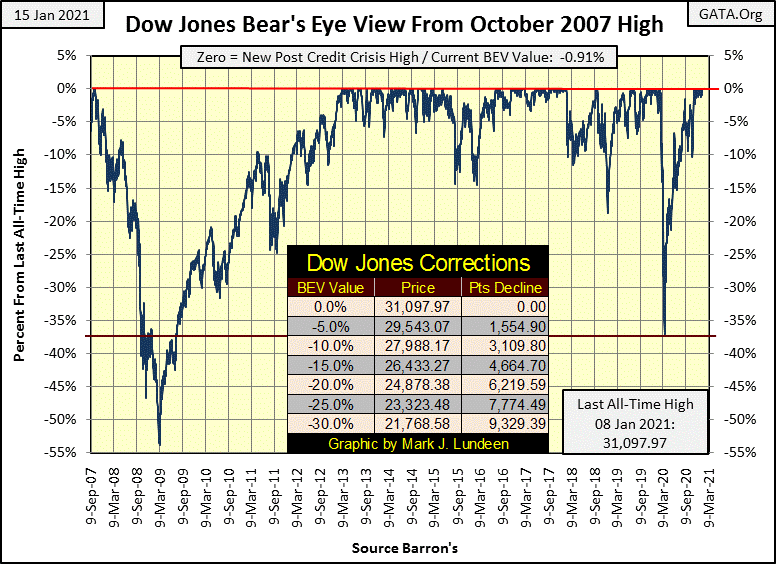
During my holiday break the Dow Jones continued advancing. Not as if it were on fire, but it did make six new BEV Zeros in the BEV chart below, and remained within 1% of one every day since December 18th.
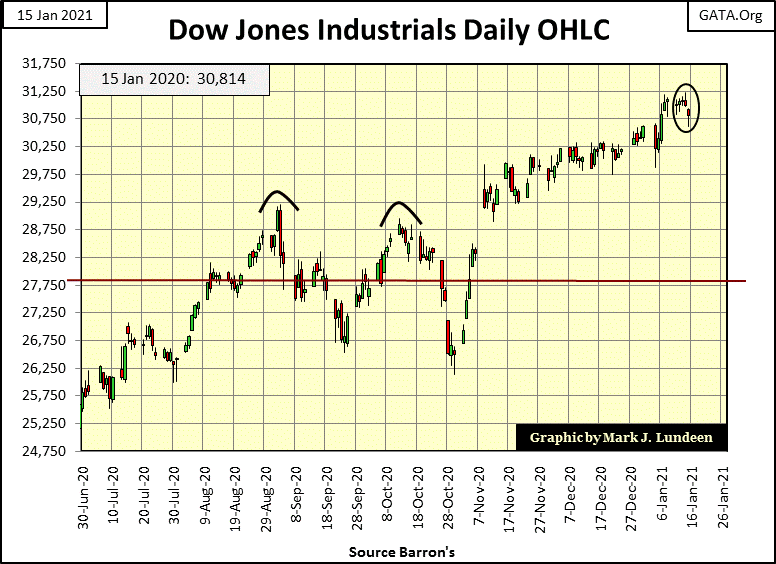
Here’s the Dow Jones in daily bars below. The Dow has advanced since the November 3rd Presidential election; that’s a little more than two months. This could go on for a while, but I’m thinking the next move will be down. So if you’re not in already, this isn’t the type of market to begin buying into.
With a little patience investors will find better bargains in the coming year.
But bargain buying in the stock market means someone is willing to buy when everyone else is selling, or even better; buying after everyone else has finished selling at a considerable loss. It’s the timeless market rule-of-thumb that one should sell into market strength (market tops) and buy into market weakness (market bottoms).
So what do I know? I know I don’t like this market. So much so that should the Dow Jones deflate by 50% by May, I’d still fear Mr Bear has much worse coming for the bulls. The problem I have with this market is the “policy makers” have absolutely refused to allow it to deflate to a natural bear-market bottom since Alan Greenspan became Fed Chairman in 1987. I say that based on dividend yields for the Dow Jones.
Bear-market bottoms used to see the Dow Jones yielding something over 6%. The Dow Jones hasn’t seen a dividend yield of 6% since 1981, and has been overvalued (yielding less than 3%) since 1987. At the March 2009 bottom, a 54% decline during the credit-crisis crash, the second deepest percentage decline the Dow Jones has seen since 1885, the Dow yielded only 4.74%.
Had Mr Bear been allowed to deflate the stock market as he once did, and taken the Dow Jones down until it yielded something over of 6%, the Dow Jones would have seen at a minimum a 64% market bottom. But Doctor Bernanke and his three QEs made sure that didn’t happen. The FOMC did same thing last March, which I’ll discus later.
The table below illustrates my problem with our current low dividend yields for the Dow Jones. The Dow closed the week at 30,814, paying out $604 and yielding 1.96%. Rounding the payout to $600 and the yield to 2.0%, fixes the Dow Jones at 30,000 in the table below. Taking the yield up to 6% deflates the Dow Jones to 10,000 for a 66% market decline. Should the dividend payout be cut by 50%, down to $300, that deflates the Dow Jones to 5,000 for an 83% market decline. During the depressing 1930s, the Dow Jones’ dividend payout was reduced by 77%, which would take our current payout down to $150.
Today, in an age when market valuations are managed by Ivy-League economists dictating “monetary policy” at the FOMC, looking at historic benchmarks for the Dow Jones’ dividend is an archaic method of valuating the stock market. But these idiot savant’s little tricks for inflating market valuations are only going to work for so much longer. When they can no longer dictate market valuations, I expect Mr Bear will once again step in and we’ll see yields for the Dow Jones, mortgages and corporate bonds soar far above where they are today as market valuations deflate to levels few “market experts” can conceive of today.
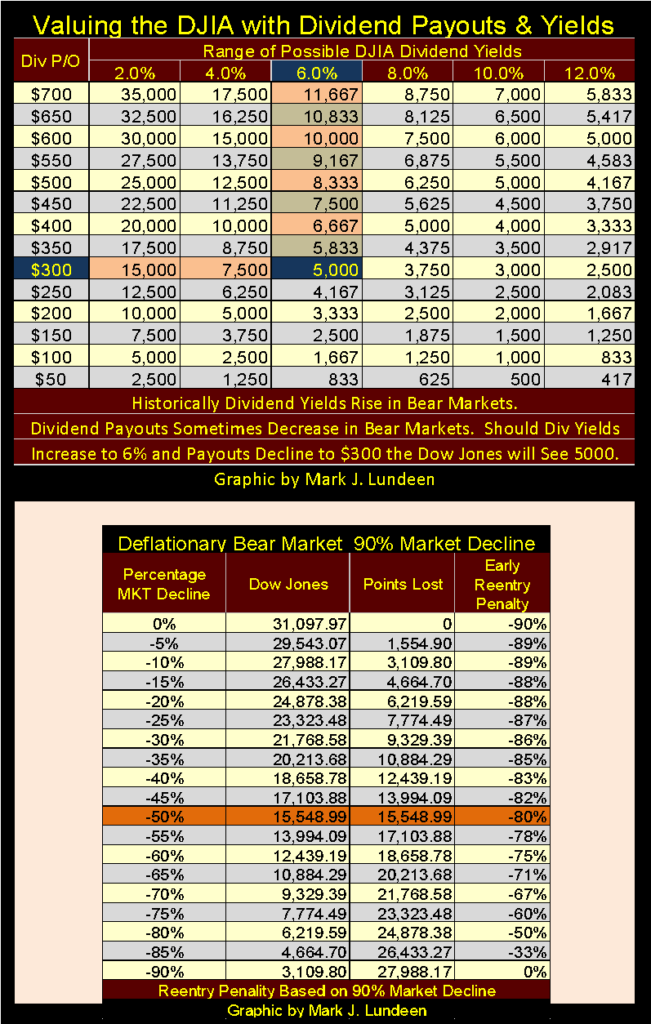
The table above should give reason to resist coming back into the market when the stock market is finally allowed to deflate to where the Dow Jones is yielding something over 6%. The Great Depression Crash deflated the Dow Jones by 89%; let call that 90% and place the Dow Jones last all-time high (31,097.97 or 0%) into the table. Seeing a 50% decline may appear to be a good buying opportunity, but doing so and holding on until the bottom of a 90% market decline would see one’s investment decline by whopping 80%.
Are things really that bad?
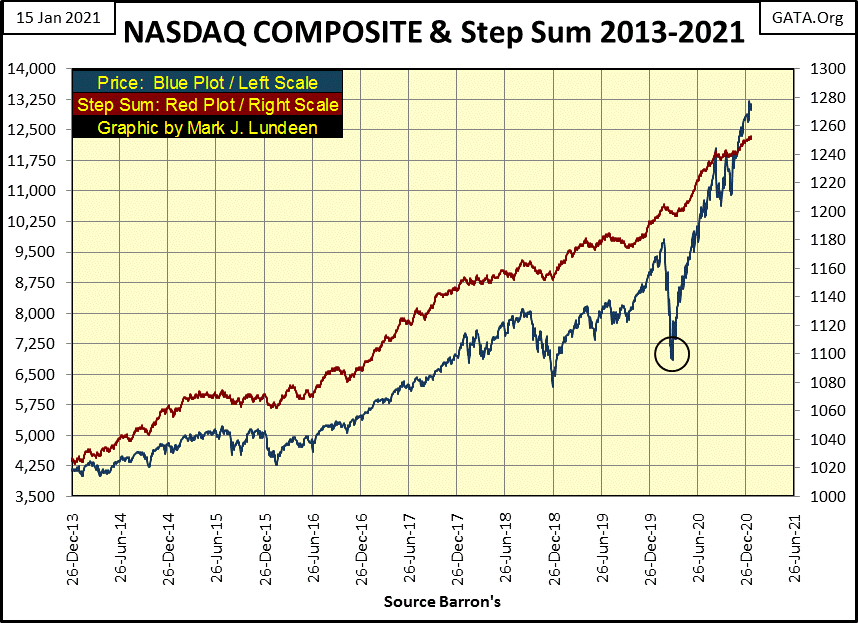
Look at the NASDAQ Composite Index below; since March 23rd (black circle) the NASDAQ has advanced by 90% at the close of this week, and the Russell 2K closed the week up 112% in the past ten months. These gains are the result of the FOMC “injecting” massive levels of “liquidity” into the financial system. In other words, these gains are purely inflationary market events with no real connection to the underlying economy.
How much longer can this go on? Maybe longer than I can imagine, but continuing advances such as these into next summer would be difficult. In any event, ten months from now is November 2021. I don’t believe from this week’s close we’ll see the NASDAQ Composite up again by 90% in the next ten months or the Russell 2K up another 112% for a second time, but I suspect there are retail investors hoping this will be so.
It’s not just the NASDAQ Composite & Russell 2K seeing a ballooning of their valuation. Look below at the major market indexes I follow; sixteen of them closed the week in scoring position (within 5% of their last all-time high).
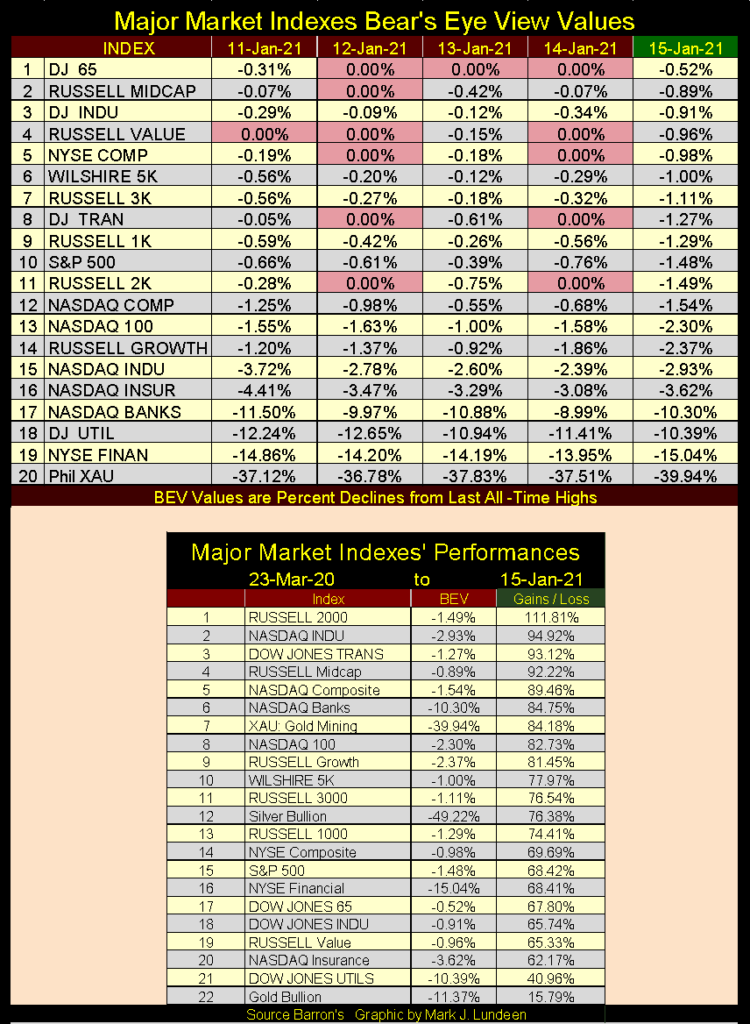
But the real tip off that this market is grossly overvalued is seeing these indices’ gains since their lows of March 23rd in the bottom table of the graphic above. Even the stodgy Dow Jones Utilities is up by over 40% in the past ten months.
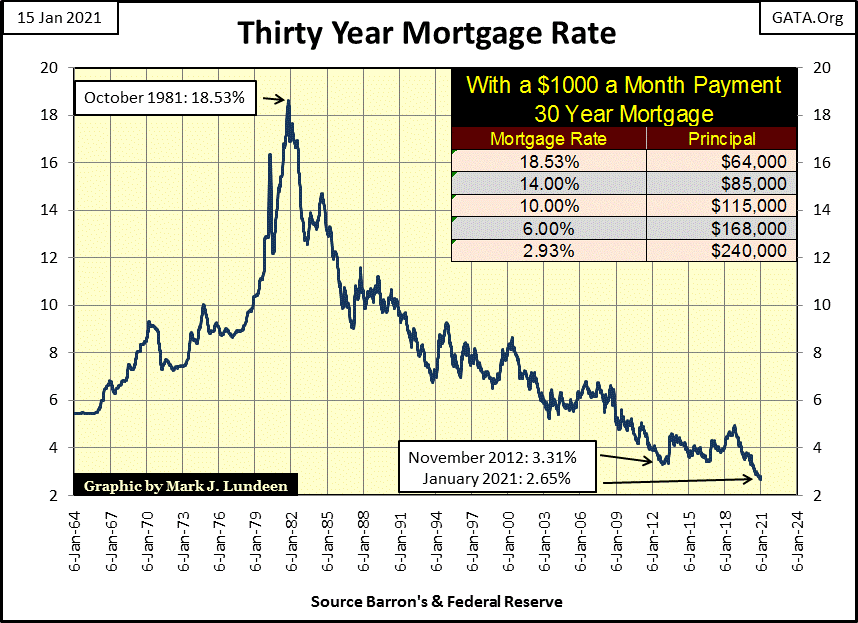
Another problem I have with this market is the historic low bond yields and interest rates. Last week mortgage rates, as reported by the St. Louis Fed, declined to 2.65% (chart below). That suggests there is immense demand for money in the mortgage market, demand that is very unlikely because of the CCP virus economic shutdown. Retail office and shopping space is a disaster as reported in the MSM financial media. How can single family housing be any better when a significant percentage of the economy has been forcibly shut down by local government? In our current economic circumstances, shouldn’t one assume raising mortgage rates as bankruptcies force sales in the real estate market?
Why the low mortgage rates and high valuations in housing?
Someone is buying mortgages, and that someone is the FOMC funding their purchases with monetary inflation.
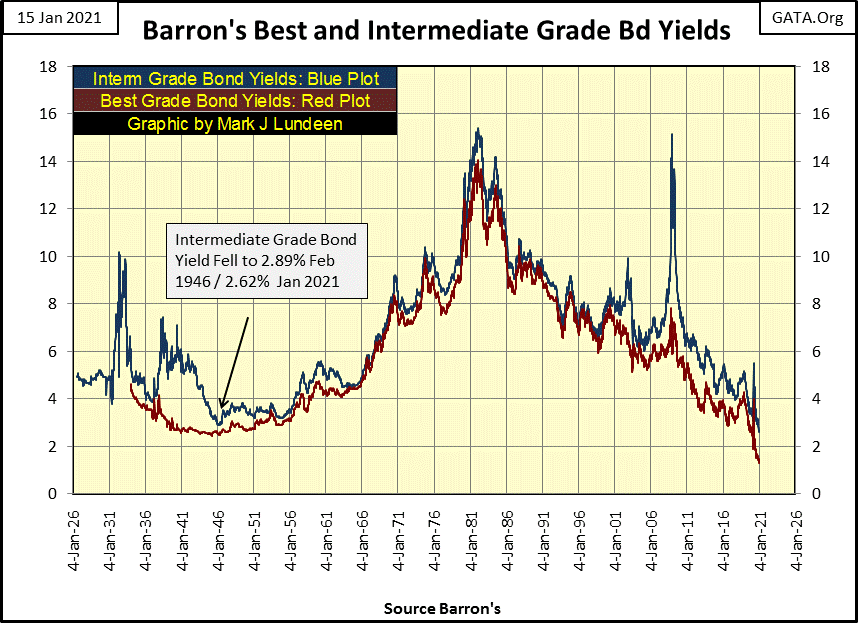
Historical low yields aren’t present in just the mortgage market. Corporate bond yields have become ridiculous as well since the FOMC announced they were going to begin purchasing corporate bonds last March during the financial panic.
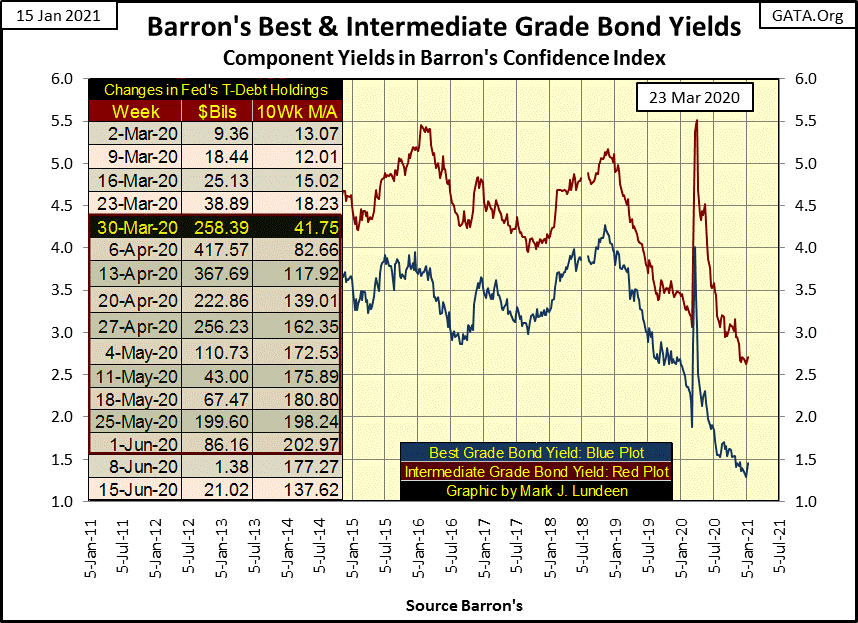
What? Last March there was a panic in the financial markets? Darn right there was! Look at the spike in corporate bond yields last March, as well as the FOMC’s reaction to them in the table in the chart below. In the three weeks from March 30th to April 13th 2020, the FOMC injected over a trillion dollars into the financial system to force those bond yields back down, and to reflate valuations in the stock and bond markets.
If so many stocks and stock indexes are up by triple digit percentages since last March, it isn’t because of the “great economy” but because of all the hot money being “injected” into the markets. This isn’t good and it’s not going to last.
So what are investors to do in January 2021? For what it’s worth my advice remains unchanged; begin shifting into precious metal assets.
Thank God 2020, one of the most miserable years in my life because of the CCP virus hoax is over. Yes the virus was real, and people did die from it. But people die all the time from this, that or the other thing.
I’m an old geezer who is fully aware that I’m much closer to my tomb than my Mother’s womb. My day is coming when I’ll have to give an account of my life with my Lord Jesus and I’ve accepted that. Having accepted his salvation, I’m actually looking forward to it. You might say I’m at peace with passing away. But like everyone else; I want to go to heaven but I’m NOT in a hurry to get there. In this world I still enjoy a glass of 90 proof Bourbon and a fine cigar to go with it.
So much for my pleasures of the flesh. The worst thing that came from the CCP virus was government’s over reaction to it; there was no reason to shut down the economy, but they did in many states and cities all around the world. Forced closure of small businesses while large corporate entities were allowed to continue conducting business as usual smacks of political intrigue, which of course it was and continues to be.
God willing, may 2021 be a better year for us all. Still 2020 had some good things coming my way. I’m sure those who followed me into Eskay Mining noticed ESKYF (Eskay Mining’s NASDAQ ticker symbol) 52wk price range for 2020 was $0.09 last April to $2.17 in the past month, closing the week at $1.74. The company still has a few core samples from last summer’s drilling program to be assayed. They’re at the lab and should arrive hopefully by March and possibly provide more excitement to Eskay’s share price.
Originally I was going to sell a good portion of my holding of Eskay Mining when it closed at something over $2.00, pay my taxes, and diversify into other more established mining companies with the proceeds. Keeping in mind you won’t go bankrupt taking profits, there is still something to be said about that.
However, I believe Mac Balkam (Eskay’s CEO) and his superb staff of geologists have located a significant ore body of Eskay Creek type of mineralization on their property that may continue far from its current known boundaries discovered by last summer’s drilling program. I believe its accurate saying Eskay Mining is no longer a high-risk speculation, but an investment vehicle offering higher returns in the precious metals mining sector.
As the company has already secured funding for its next summer’s drilling program, I’m thinking real hard to hold on to my shares of Eskay Mining until their 2021 drilling program is completed and assays reported. Of course I’ll be selling some shares to pay bills or sniff an occasional rose or two, and one day I’m going to diversify out of my now largest holding in my investment portfolio; Eskay Mining. But I’m thinking I may now wait a year before I do so.
And what’s the hurry to diversify out of Eskay Mining? Last week, Barron’s 11 January 2021 issue, the Barron’s Gold Mining Index (BGMI) closed the week above 1000 for the first time since January 2013 at 1,019.26. That’s up by 319% from the BGMI’s January 2015 bottom, with most of those gains from its March 2020 bottom. And after all of that the BGMI still remains 38% below its highs of April 2011. Unlike so many other stock groups, it’s difficult making a case the gold and silver miners are overvalued in today’s market.
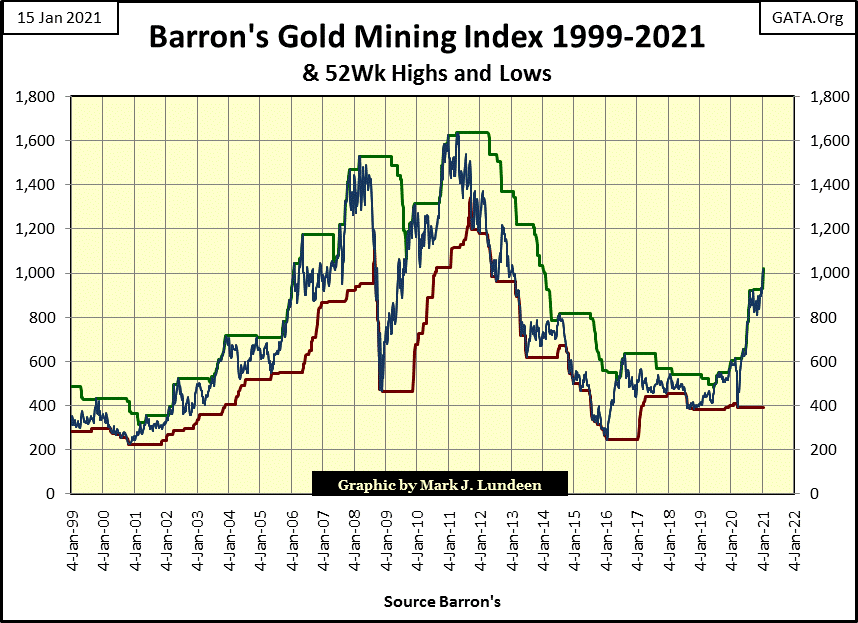
Okay, the BGMI isn’t overvalued. But that doesn’t mean that it will advance to new all-time highs anytime soon. So why be positive about the prospects for the gold and silver miners listed in the BGMI and XAU? For myself, I’m following the 10-wk moving average of “liquidity injected” into the financial system by the FOMC in the chart below.
Currently, this “liquidity” is flowing into the broad stock and bond markets, but will it stay there come another financial panic, the last seen last March?
In a single week in early April, the FOMC had to “inject” $417 billion into the economy to get market valuations turned around, driving its 10-wk moving average to over $200 billion in the chart below. And since October their weekly “injections of liquidly” into the financial system hasn’t declined far below the orange line fixed on the chart’s $25 billion (see table).
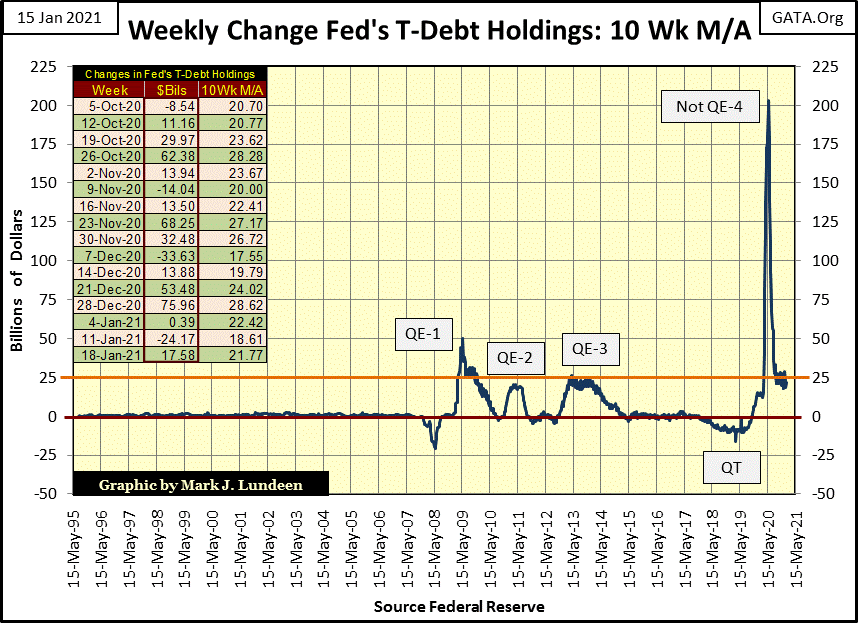
Comparing “monetary policy”; or how much “liquidity” the FOMC “injected” into the financial system before and after January 2008 in the chart above reveals a secret little spoken about by “market experts” and mainstream economists.
The damage done to the financial system by Alan Greenspan and Doctor Bernanke’s subprime-mortgage bubble resulted in a grievous self-inflicted wound in the global financial system, and remains the chief focus of today’s “policy makers” efforts. After twelve years of herculean effort, the damage done by structured finance in the single family mortgage market to the banking system has proven to be irreparable.
Seeking shelter from the coming deflationary market event in precious metals assets is a prudent thing to do
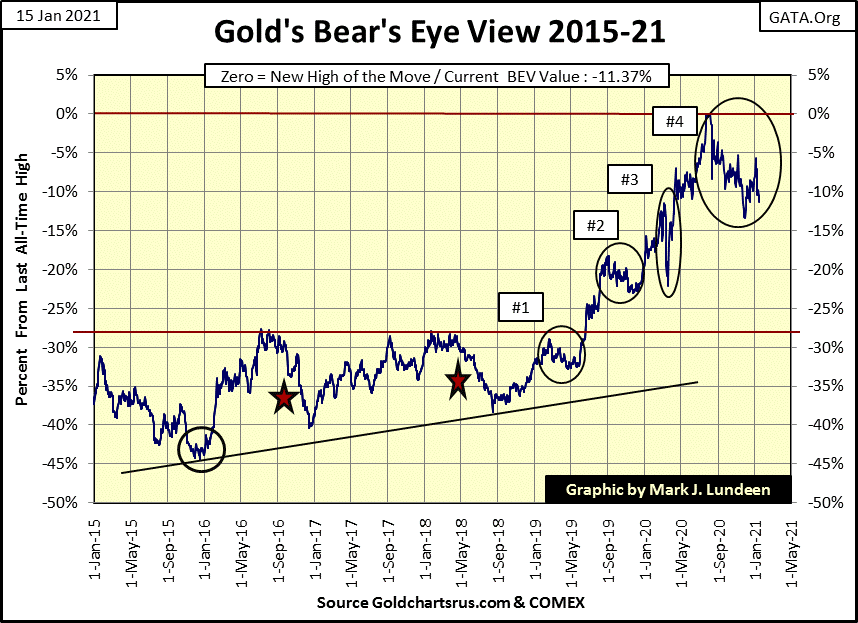
So let’s look at gold’s BEV chart below and see what it has to say to us. Gold’s last all-time high was $2061 on August 6th, and has spent the best part of the past six months correcting its breaching the $2000 level. Gold did something similar when it first breached the $1000 level in March 2008, and for the same reason. But in 2008 gold corrected for six months, declining by 30% in the process. So far in 2020-21, gold has yet to correct 15%.
In a market dominated by “policy”, where it’s possible for the FOMC to “inject” a trillion dollars into the markets in only three weeks, you can be sure the idiot savants at the FOMC want everyone looking at rising financial market valuations and declining bond yields AND NOT at an ounce of gold soaring above $2000.
So gold’s correction that began in mid-August continues (#4), but so far has failed to break below its BEV -15% level ($1751). This correction may go on for a while, and we may see gold break below its BEV -20% line ($1649) before it ends.
But with gold trading in a financial system under a systemic monetary inflationary assault, as is ours, one has to assume gold, silver and the precious metal miners are assets one must have to survive the coming deflationary disaster.
If “policy” is determined to subsidize low prices in the old monetary metals by flooding their futures markets with paper gold and silver, take advantage of their efforts and buy all the real gold and silver you can afford while the sale of a lifetime continues.
Next is gold plotted with its step sum, a chart that contains some interesting details on the gold market. We see both gold and its step sum correcting from their August 2020 highs, and we also see the possible limit this correction has to go when we study the history contained in this chart.
From gold’s all time high of August 2011, when the gold bulls were feeling ten foot tall and bullet proof, the next four years were a humbling experience when gold saw the bottom of a 45% correction in December 2015. This knocked the wind out of the gold and silver market, people who thought gold was headed ever higher in 2011 were long gone by the end of 2015. Most likely the gold bulls of August 2011 have yet to come back, but they will return when the price of gold is much higher.
Then there is the matter of gold’s line-of-death at $1360 (Red Line), where for six years gold could not get above, and stay above $1360 without beginning a multiyear correction. This was a real moral killer for the gold bulls – until the summer of 2019 when all that changed.
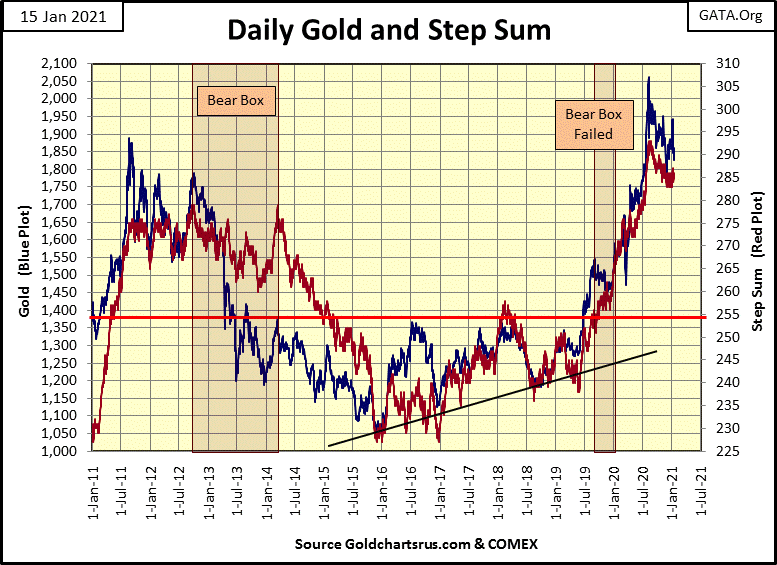
I don’t have a crystal ball to gaze into the future, but I’m looking at the chart above were for eight years (August 2011 to June 2019) being bullish on gold only resulted in pain and frustration. Technically, what we are looking at above is an excellent setup for a major upward thrust in a market. In this case for gold.
Seeing gold close this week below its all-time highs of August 2011 tells me that the bulk of the pending upward thrust has yet to be expressed, so I’m going to assume much, much more is to come for the persevering gold and silver bulls.
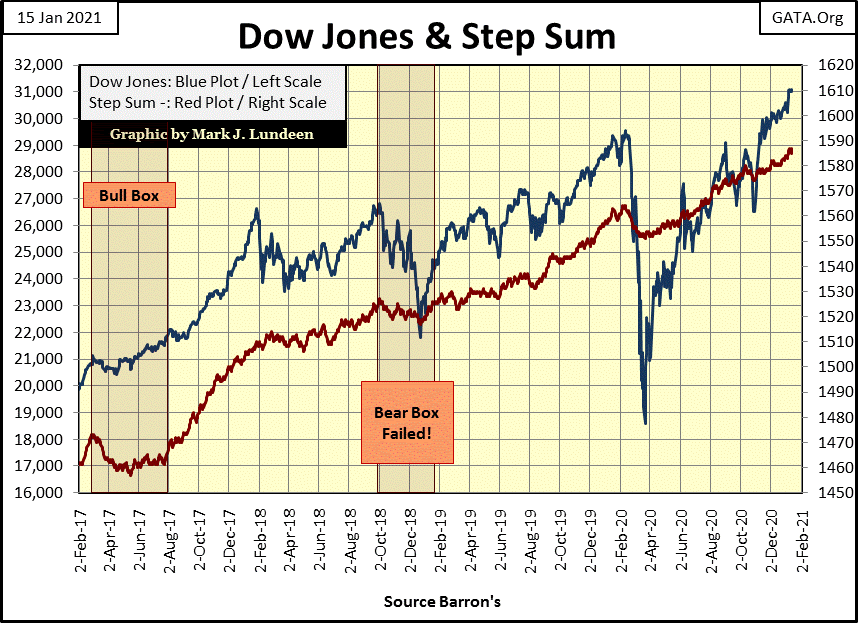
Moving on to the Dow Jones and its step sum, what is there to say except that they are both going up, and will continue to do so until they start going down. Ah, but what valuation will the Dow Jones be at when that happens sometime in our uncertain future?
From my seat in the stock market’s peanut gallery, I haven’t a clue, but I am enjoying the show for as long it lasts.
Here’s the step sum tables for gold and the Dow Jones.
Gold continues to oscillate between its BEV -15% and -5% lines. So, as it’s not really going up it’s also not really going down either. But its step sum has advanced by two steps since December 10th, and that’s good.
What’s bad is seeing its volatility’s 200 day M/A decline from 0.91% down to 0.80%. Bull markets in gold and silver are volatile markets. When the current correction in gold is over, expect to see its termination heralded with a series of 3% days, days of extreme volatility in the gold market. Until then we must be patient.
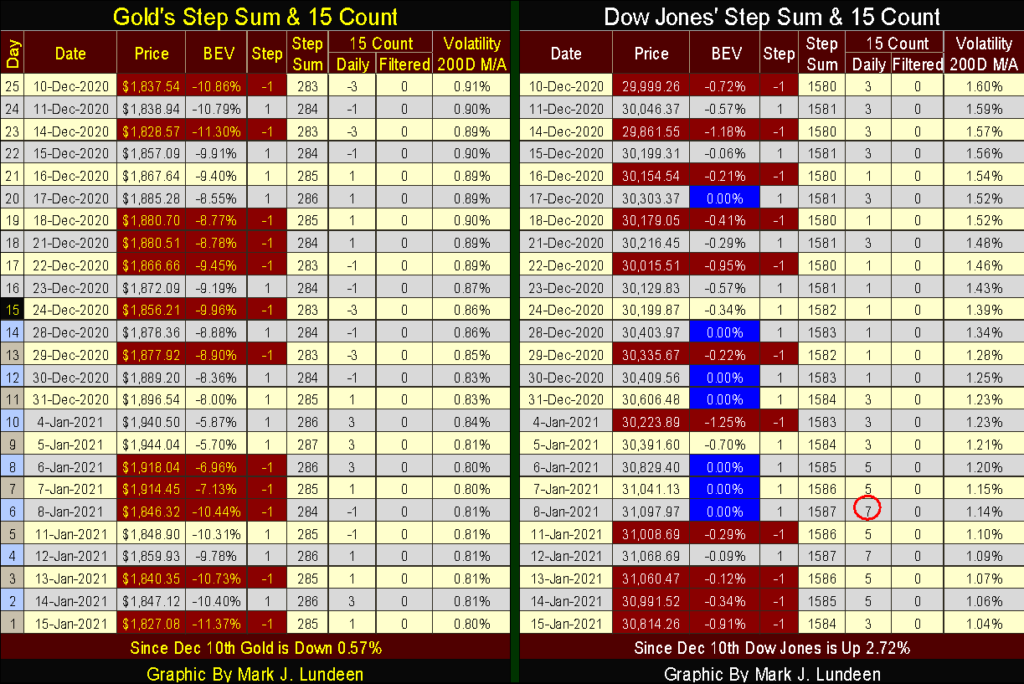
On the Dow Jones side of the table we see five new BEV Zero highlighted in blue; five new all-time highs. By the time of the last of the series (January 8th) the Dow Jones’ step sum had advanced by seven steps; that’s a strong advance that drove its 15 count up to a +7, which is an overbought market, a market that is due for a pullback, which it has.
Look at daily volatility for the Dow Jones drop like a rock as last year’s Dow Jones 2% days (days of extreme volatility) drop out of the 200 day sample, one by one.
__
(Featured image by energepic.com via Pexels)
DISCLAIMER: This article was written by a third party contributor and does not reflect the opinion of Born2Invest, its management, staff or its associates. Please review our disclaimer for more information.
This article may include forward-looking statements. These forward-looking statements generally are identified by the words “believe,” “project,” “estimate,” “become,” “plan,” “will,” and similar expressions. These forward-looking statements involve known and unknown risks as well as uncertainties, including those discussed in the following cautionary statements and elsewhere in this article and on this site. Although the Company may believe that its expectations are based on reasonable assumptions, the actual results that the Company may achieve may differ materially from any forward-looking statements, which reflect the opinions of the management of the Company only as of the date hereof. Additionally, please make sure to read these important disclosures.

-

 Business7 days ago
TopRanked.io Weekly Affiliate Digest: What’s Hot in Affiliate Marketing [Sports Betting + TikTok + World Cup]
-

 Africa2 weeks ago
Damane Cash and FMSCD Partner to Enable Cash Advance in Exchange Offices
-

 Africa2 days ago
Fez Launches $22 Billion Plan to Tackle Deadly Building Collapses
-

 Crowdfunding1 week ago
Görlitz Christmas Crowdfunding Campaign Exceeds All Goals


