Markets
2025 Unleashed: Political Turmoil, Market Warnings, and the AI Mania’s Dangerous Edge
Chaos grips 2025: Trump’s trade threats, military posturing, and Middle East tensions heighten global instability. Canada faces political turmoil amid raging wars. Stock markets stay calm until Friday’s job report shakes bonds. AI-driven tech giants (MAG7) dominate, yet caution is advised. Manias signal danger; history warns crashes follow. Will 2025 repeat past collapses?

When we wrote in our 2025 forecast (on December 16, 2024), we noted that 2025 could be a year of chaos and volatility. But, boy, here we are barely two weeks into 2025 and already chaos and volatility are on the rise. Perhaps the biggest piece of chaos is emanating from the master of chaos, U.S. president-elect Donald Trump.
From saying he will place huge tariffs on trading partners Canada and Mexico, to threatening the Panama Canal and Greenland with military intervention, to threatening to use economic force on Canada, to attacking cartels in Mexico and reducing Gaza to rubble (hint: it already is) if Hamas doesn’t release the hostages, one feels he has stepped into an alternative world. Oh, yes, and renaming the Gulf of Mexico.
Add in the devastating fires in Los Angeles that mimic Dante’s Inferno or the eruption of Mount Vesuvius that buried Pompeii and that alone is enough to call it chaos. Then we had the resignation of Canada’s prime minister, proroguing of parliament, and a looming leadership race that will be followed by an election. Of course, it doesn’t stop there as chaos continues to reign in the Middle East and the Russia/Ukraine war continues to rage. Is there any respite? Just think. Almost 51 weeks to go.
By comparison, the stock market appears to be a sea of calm. Then came Friday following the job numbers and down we went. The bond market is witnessing interest rates back up even as the Fed cuts rates. Yet the bond market is sparking nary a peep. Gold is rising, albeit slowly. The so-called Santa Claus rally was negative, but the First Five Days were positive.
They represent two-thirds of the January trifecta with only the January barometer to come. Mixed signals? Will 2025 bring us a market crash? Yes, it could happen, but so far, while regional banks are having problems, we are hearing of no big bank in trouble that could spark a 2008 financial crisis meltdown. At the heart of most market crashes, one normally finds a banking crisis.
The stock market over the past several years has been rising on a wave of expectations over AI. The leaders have been the Magnificent 7 (MAG7); i.e. Apple, Amazon, Microsoft, Google, Nvidia, Meta, and Tesla. Plus, we have Bitcoin and the cryptos rising to unheard-of heights as well. But are the days of the MAG7 and Bitcoin numbered?
Naturally, we can’t say that for sure; however, in looking at their charts, things do not look right. This has nothing to do with their fundamentals which may be strong, but a look at their chart patterns suggests one should now be very cautious about owning these stocks. The MAG7 have been in a mania, the AI mania. We are reminded, however, that manias do not end well. The technological mania of the 1920s, the mania that developed after World War II that led to the Nifty Fifty mania, Japan’s mania of the 1980s, the dot.com/high- tech mania of the 1990s, the housing mania of the early 2000s. All led to crashes and severe drops for the stock market. Is this time different? We suspect not.
We deliberately chose to start our examination of them from 2020, the year of the pandemic. It was out of that crisis that was saved by the Fed (and other central banks) lowering interest rates to zero or at least near zero. It was also a period that saw the central banks unleash the most massive period of quantitative easing (QE) ever seen. Money supply exploded to the upside. The Fed’s balance sheet soared. Money supply and the Fed’s balance sheet also exploded after the 2008 financial crisis.
While M1 rose 250% from 2009 to 2019, M1 exploded to the upside by over 500% from January 2020 onwards. It was an unprecedented amount of money hurled into the financial system to stave off a possible depression stemming from the pandemic. While the monetary expansion out of the 2008 financial crisis was huge, it did not unleash inflation. But it caught up after the pandemic, unleashing the highest inflation since the late 1980s.
Putting together the monetary reaction from the 2008 financial crisis and the pandemic, it was the most massive monetary expansion in history. A question we’ve often asked is, could the financial system survive another crisis? Possibly, but not without unleashing huge inflation and potentially triggering an inflationary depression. The monetary expansion also helped unleash the stock market, eventually sending it into a mania and bubble. Classic case of too much money chasing too few stocks. It became the era of AI and the MAG7 along with Bitcoin and the cryptos.
From 2009 to 2019, the NASDAQ rose 551%. From 2020 until today the NASDAQ is up another 117%. Is that a record run? Well, no. From 1991 to the top in March 2000, the NASDAQ rose 1,180%. For the key period from October 1998 (market low following the Russian default and Long-Term Capital Management (LTCM) collapse) until March 2000 the NASDAQ was up 170%. The decade was dominated by the dot.com/high-tech/internet mania that led to the bubble. Once the NASDAQ topped in March 2000 it fell 72%, the biggest decline for a stock market index since the Dow Jones Industrials (DJI) fell 89% from 1929 to 1932.
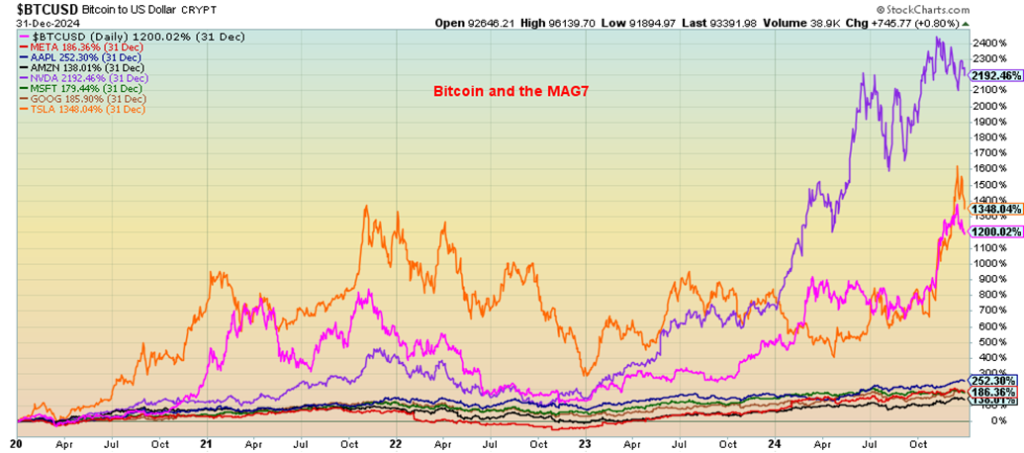
In many ways, the dot.com mania outpaced the AI mania. But that doesn’t mean it won’t end the same. We are seeing signs of trouble. During the dot.com bubble, the names of Pets.com, Boo.com, WorldCom, Global Communications, Nortel, and Qualcomm became household names. We also note eBay and, yes, Amazon as well. Today, Nvidia, Apple, Amazon, Microsoft, Google, Meta, and, yes, Tesla are the leaders—the MAG7. Add in Bitcoin, which has leaped some 1,200% since 2020. Since getting underway in 2015, Bitcoin is up a remarkable 33,000%.
Bitcoin and MAG7 Performance 2020–2025
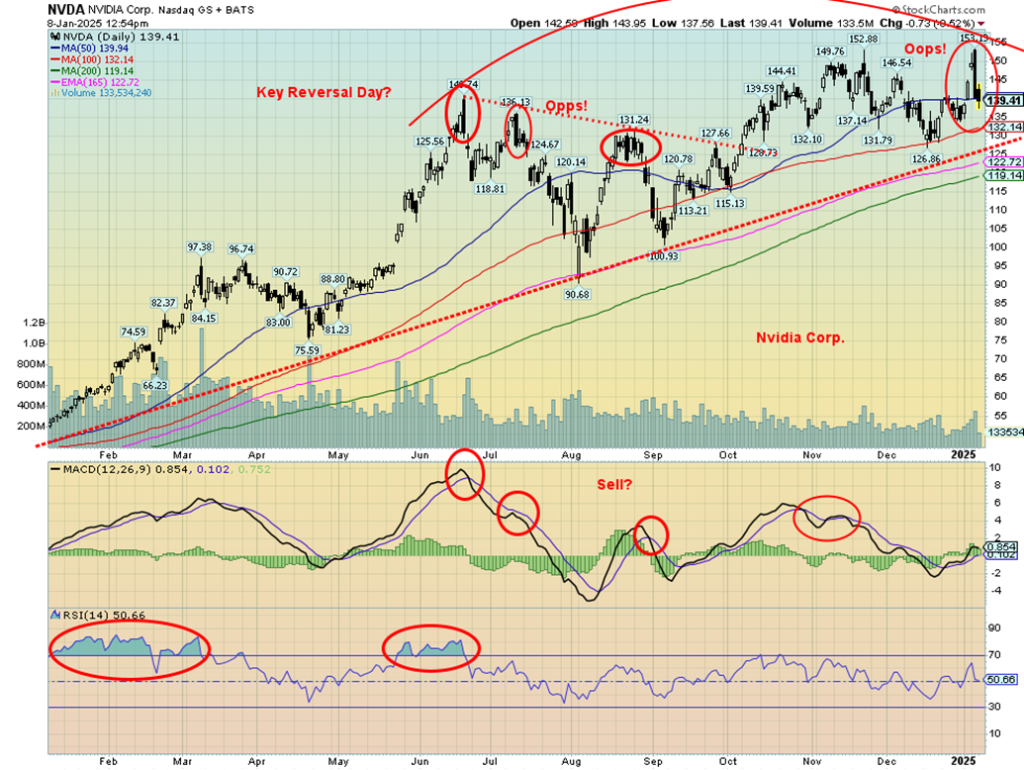
Our first look is at Nvidia (NVDA), the leader of the AI pack. Nvidia has been the leader, up some 2,192%, since 2020. It has made all the principals of Nvidia billionaires, led by its CEO and President Jensen Huang, currently worth around $120 billion. Most of that was attained in the past two years as Nvidia soared. But is the party over? Last June 2024 we made what appeared to be a key reversal day as Nvidia made all-time highs but closed below the low of the previous day. No, Nvidia did not immediately begin to fall, but it had reversals again in July and August 2024.
Nvidia once again recovered and rose irregularly once again to new highs at $153.15 on January 7, 2025. Then it reversed again and closed the day at $140. There appears to be a potential double top on the charts with the high of $152.88 on November 21, 2024, a day that also saw Nvidia close sharply lower after making the high. The key areas are now the December 17, 2024 low of $126.86, the uptrend line coming at currently around $125, and the 200-day MA, currently at $119. A break now of those points could project Nvidia to fall to around $100 at least. Note the steady decline in volume since that top in June 2024, another negative sign.
Probably the most talked-about stock of the MAG7 has been Tesla (TSLA) and its controversial CEO Elon Musk. Musk was appointed by president-elect Donald Trump to head up the Department of Government Efficiency (DOGE), cheekily named after Musk’s favourite crypto Dogecoin (DOGE).
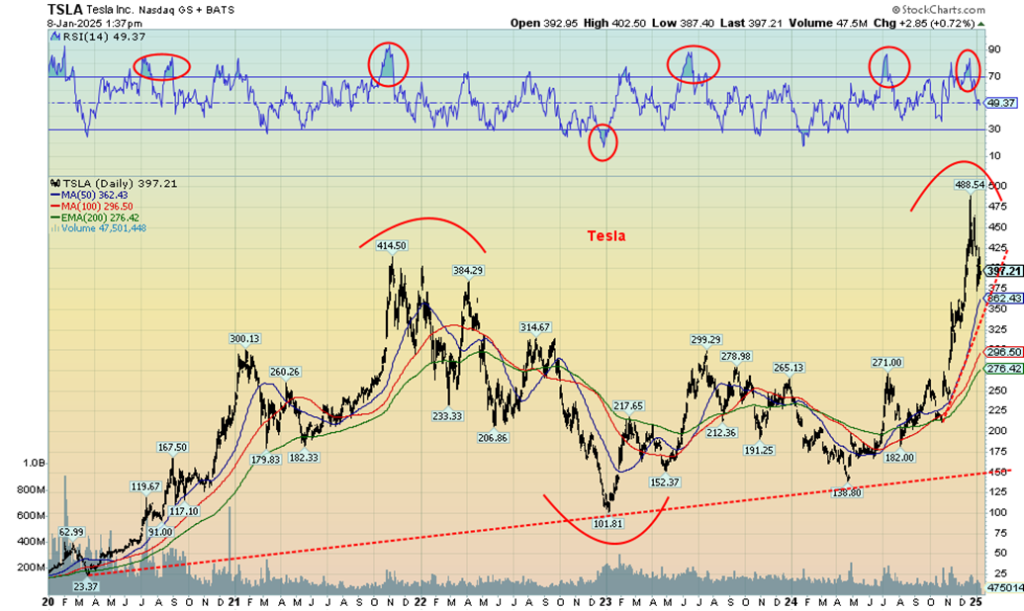
Through his 12% ownership of Tesla and other companies which he co-founded including Space-X, the Boring Company, X Corp, xAI, Neuralink, and Open AI, and as the owner of X (formerly Twitter), Musk is now worth an astounding $415 billion (according to Forbes’ real-time billionaires list). That’s down from around $460 billion. Most of that has been achieved since a low for Tesla in early January 2023 at about $102. The spike to a high on December 18, 2024 at $488.54 really got underway in October 2024 when, in the space of about two months, Tesla more than doubled.
Nvidia
However, Tesla is facing problems. That spike followed by a reversal is symptomatic of the problems. There are concerns about the quality and safety of their vehicles, particularly with features like Autopilot and Full Self-Driving, issues with build quality, inconsistent customer service, a potentially aging product lineup, growing competition from other EV manufacturers, and controversies surrounding Musk’s behavior and public statements.
None of this is conducive to a rising stock price. The spike and reversal could be the tip of the iceberg. What goes up fast could come down even faster, slashing Musk’s wealth. That is already a swift 20% drop from the high. A fall to that gentle uptrend line near $150 can’t be ruled out. Total decline—about 70%. If the AI/MAG7 stocks fall, they will drag the entire market down with them.
Tesla
While not a member of the MAG7, Bitcoin should not be ignored. We see plenty of talk about Bitcoin becoming the new gold, and that it could replace the U.S. dollar. After all, Bitcoin is limited and gold has its limitations, but the printing of the U.S. dollar is infinite. Over the past four years, gold ETFs have actually been net negative. It is possible that cryptocurrency ETFs are the recipient of the outflow. Buying crypto can be somewhat difficult and then there is the potential for hacks.
Gold, on the other hand, is real. Gold ETFs represent a call on physical gold, whereas cryptocurrency ETFs are just a claim on something that exists only in cyberspace. Irrespective of this, the claim is that Bitcoin is a hedge against inflation. Besides president-elect Donald Trump, other presidents have also taken an interest in Bitcoin. The promise is to create digital currencies that can substitute for today’s money. Will it happen?
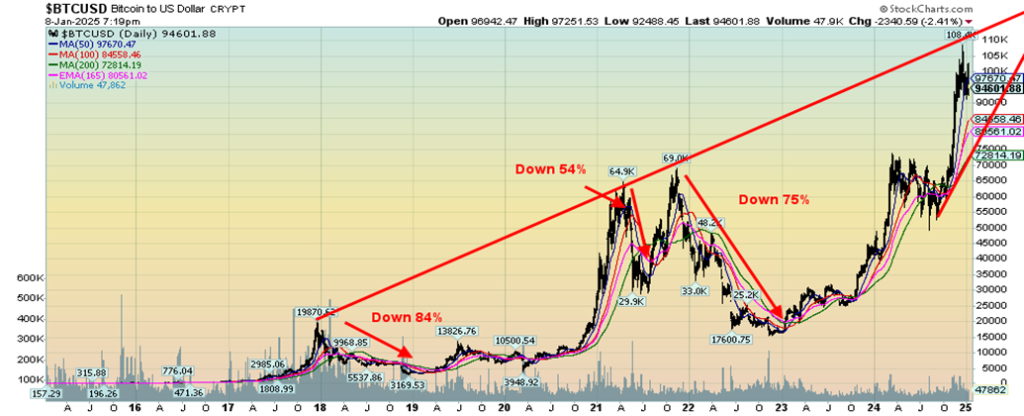
However, a look at the chart of Bitcoin shows that a potentially dangerous pattern is forming. Since Bitcoin came into existence it has had three manias. The first one saw Bitcoin rise from literally pennies to over $19,000 by 2017. In August 2011, Bitcoin traded around $12. By December 2017 Bitcoin was at $19,120, a gain of over 159,000%. Once the top came in, Bitcoin fell 84% to a low in December 2018. That provided the basis for the second mania. Bitcoin rose into two tops 2021 with the second top over $69,000. The gain this time was over 217,000%. That triggered the top, which was followed by a 75% decline into December 2022.
That set the stage for mania number 3. So far, Bitcoin has topped at over $108,000, a gain this time of over 69,000%. Note how Bitcoin created a rising channel, starting from December 2017 to and connecting the April 2021 top. The rise this time has taken us back to the top of the channel. The odds of Bitcoin continuing up and breaking the top of the channel without some sort of correction are low.
More likely is a correction that could be on the scale of the two previous drops. Based on the previous two declines, the average was 79.5%. A decline of that magnitude today could take Bitcoin back to $22,000. None of this is to say it will happen. There is considerable support between $55,000 and $75,000. The first sign of trouble would be a break under $90,000. Bitcoin at these levels deserves at least some caution.
Bitcoin
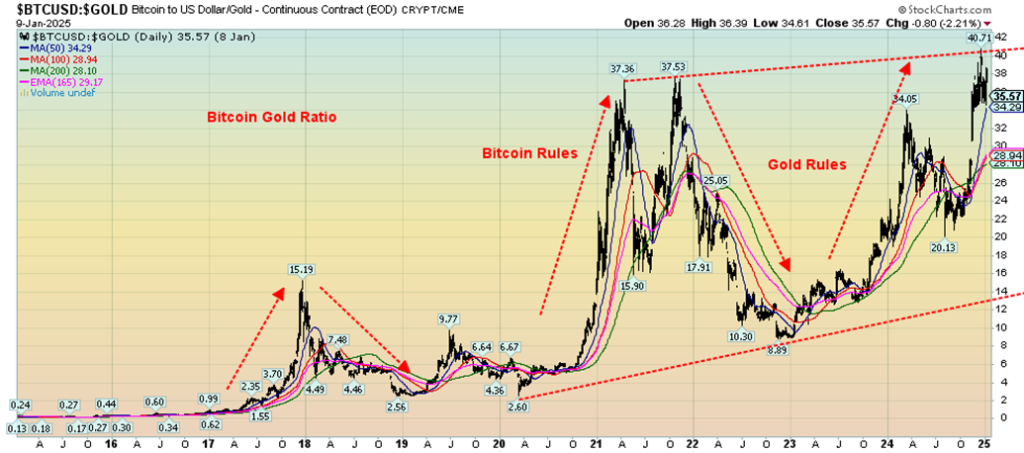
It’s probably no surprise that the Bitcoin/Gold ratio follows a similar pattern to Bitcoin. Again, once the top is seen, the decline sets in in favour of gold over Bitcoin. The declines were similar with the drop from the 2017 top 83% and the decline from the 2021 top 76%.
Our last chart below is something we noted in our Technical Scoop eCcommentary62, January 7, 2024 where we noted that as the Fed cut rates 100 bp, the U.S. 10-year treasury instead rose 100 bp, seemingly in defiance of the Fed. The same has been happening between gold and the U.S. 10-year treasury note. Gold usually responds negatively to rising interest rates. But this time gold has been rising, seemingly in defiance of rising interest rates.
We could show the same between gold and the US$ Index. The US$ Index has been rising and gold is also rising. It suggests to us that something is out of line and the market is signaling that something could happen. Naturally, we can’t define what that is, but when these relationships break down it is usually a sign of market misplacement. It is another warning sign for 2025. Chaos and volatility.
And we haven’t even mentioned the massive debt.
Bitcoin Gold Ratio
Gold and the U.S. 10-year Treasury Note (inverted) 2020–2025
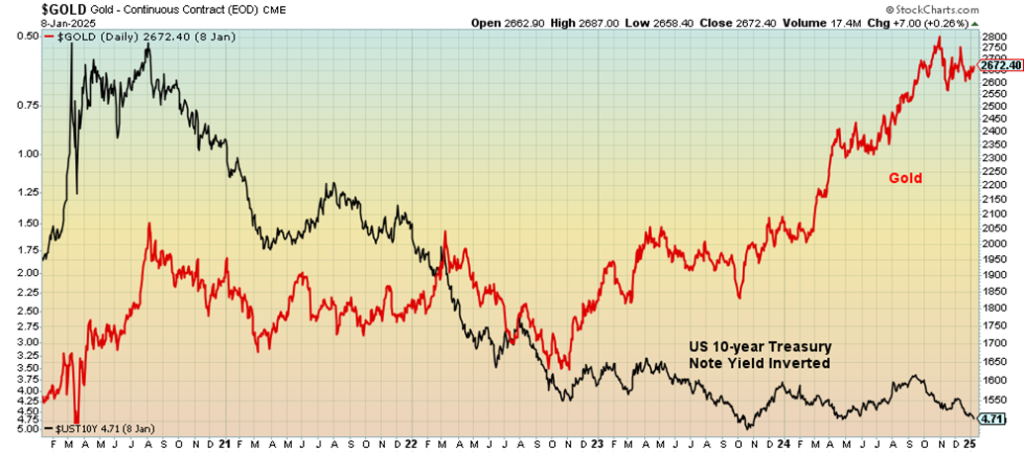
Chart of the Week: U.S. Job Numbers
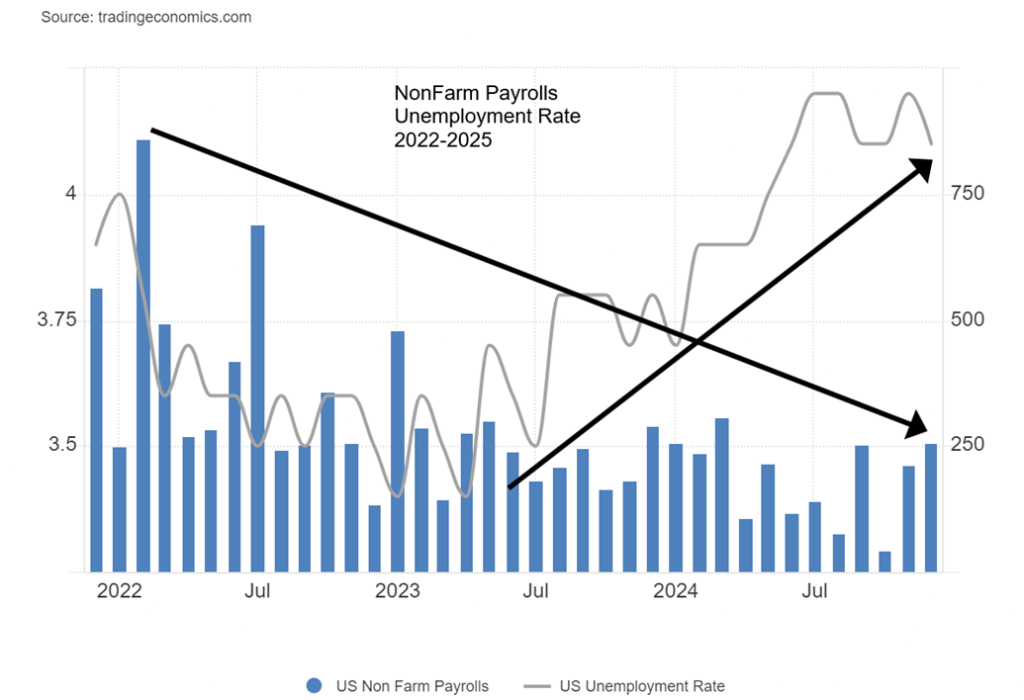
In what had to be a complete surprise for most forecasters, the December nonfarm payroll jobs report indicated that 256,000 new jobs were created. That October and November were revised downward is beside the point. The revisions were small, only 8,000. The forecast was for only 160,000 new jobs. The unemployment rate U3 also fell to 4.1% from 4.2%. The U6 unemployment rate (total unemployed, plus all persons marginally attached to the labour force, plus total employed part-time for economic reasons, as a percent of the civilian labour force, plus all persons marginally attached to the labour force) fell to 7.5% from 7.7%. It had to be a hallelujah moment.
But a funny thing happened on the way to celebrating the numbers. Yes, bond yields rose and the US$ Index leaped. But the stock market sold off and gold rose (see commentary on stock indices and gold). Oil was up sharply as well. Maybe things weren’t so rosy after all? They are calling it the goldilocks economy and with those kinds of numbers it certainly looks like it.
Helping it, we note that the civilian labour force rose 243,000, the employment level (number employed) was up 478,000, the unemployment level fell by 235,000, and the total population level of those eligible 16 years of age and over rose a much smaller 175,000. Oddly, the number of those not in the labour force (includes retirees, students, etc.) rose by a whopping 593,000. As usual, some of the numbers are odd and don’t add up.
Even the percentage of those holding multiple jobs fell to 5.2% from 5.3%. But the average weeks unemployed rose to 23.7 weeks vs. 23.6 weeks. Those unemployed more than 27 weeks fell 141,000. The medium weeks unemployed also dropped to 9.8 from 11.0. The employment population level rose to 60.0% from 59.8% which suggests a larger share of the population was working. The labour force participation rate was unchanged at 62.5%. Average hourly earnings were up 0.3% from November.
So where did all the jobs come from? Healthcare, government, and social assistance saw good gains. Retail was up as well, but that may have been because of Christmas hiring. Notably, all were service sector jobs. Tellingly, full-time jobs gained 87,000 but part-time jobs jumped 157,000. These part-time jobs could disappear quickly. Manufacturing jobs continue to fall. None of this takes into account recent Wall Street layoffs and the negative impact of the wildfires in California. That might show up next month. As usual, these job numbers are subject to revisions, where the tendency has been toward downward revisions. Sometimes things sound better than they are.
The biggest thing out of this better than expected jobs report is it might cause the Fed to pause interest rate cuts. The next FOMC is January 28–29.
While the strong job report might make the Fed hesitate, we couldn’t help but notice the Michigan Consumer Sentiment report came in at 70, down from the previous month’s 73.3 and the expected 74. Maybe the thought of tariffs is sinking in.
Canada Job Numbers
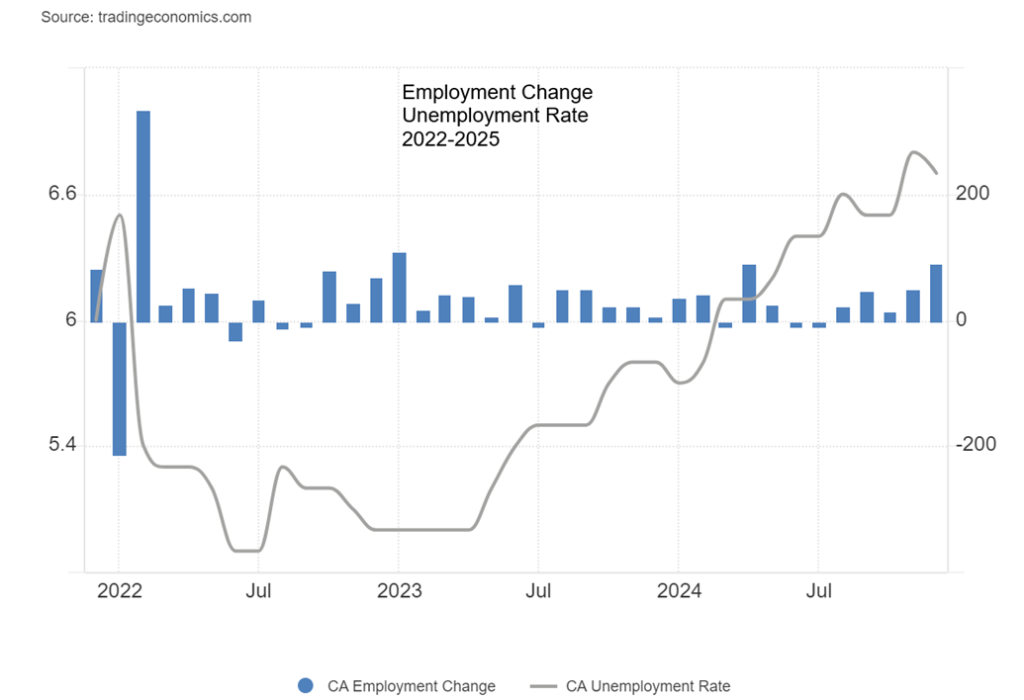
Well, if we thought the U.S. job numbers were gangbusters, Canada followed up with gangbuster job numbers of its own. In December, the Canadian economy produced 91,000 jobs according to Statistics Canada, blowing well past the expected 25,000. The unemployment rate fell to 6.7% from 6.9%. Better still, full-time employment rose 57,500 while part-time employment was up 33,500. The participation rate was 65.1%, up from 65.0%. Wage gains were 3.7% year over year (y-o-y), down from 3.9%.
Job gains appeared in a number of sectors including education, transportation, finance, insurance, real estate, leasing, health care, and social assistance. Biggest gains were in Alberta and Ontario.
Notably and not unexpectedly, long bond rates rose and the Canadian dollar was steady. The strong report puts another interest rate cut by the BofC in doubt. The next meeting is scheduled for January 29.
Markets & Trends
| % Gains (Losses) Trends | ||||||||
| Close Dec 31/24 | Close Jan 10/25 | Week | YTD | Daily (Short Term) | Weekly (Intermediate) | Monthly (Long Term) | ||
| Stock Market Indices | ||||||||
| S&P 500 | 5,881.63 | 5,827.04 | (1.9)% | (0.9)% | down | up | up | |
| Dow Jones Industrials | 42,544.22 | 41,938.35 | (1.9)% | (1.4)% | down | up | up | |
| Dow Jones Transport | 16,030.66 | 15,923.42 | (1.1)% | 0.2% | down | up | up | |
| NASDAQ | 19,310.79 | 19,161.63 | (2.3)% | (0.8)% | down | up | up | |
| S&P/TSX Composite | 24,796.40 | 24,767.23 | (1.2)% | 0.2% | down | up | up | |
| S&P/TSX Venture (CDNX) | 597.87 | 608.42 | (2.4)% | 1.8% | up (weak) | up | neutral | |
| S&P 600 (small) | 1,408.17 | 1,381.94 | (2.8)% | (1.9)% | down | up | up | |
| MSCI World | 2,304.50 | 2,316.20 | 0.6% | 0.5% | down | down | up | |
| Bitcoin | 93,467.13 | 94,716.58 | (3.6)% | 1.3% | down | up | up | |
| Gold Mining Stock Indices | ||||||||
| Gold Bugs Index (HUI) | 275.58 | 293.55 | 3.1% | 6.5% | neutral | neutral | up | |
| TSX Gold Index (TGD) | 336.87 | 359.39 | 2.8% | 6.7% | up | up (weak) | up | |
| % | ||||||||
| U.S. 10-Year Treasury Bond yield | 4.58% | 4.60% | (0.7)% | 0.4% | ||||
| Cdn. 10-Year Bond CGB yield | 3.25% | 3.26% | (1.5)% | 0.3% | ||||
| Recession Watch Spreads | ||||||||
| U.S. 2-year 10-year Treasury spread | 0.33% | 0.31% | 3.3% | (6.1)% | ||||
| Cdn 2-year 10-year CGB spread | 0.30% | 0.32% | 6.7% | 6.7% | ||||
| Currencies | ||||||||
| US$ Index | 108.44 | 109.64 (new highs) | 0.7% | 1.1% | up | up | up | |
| Canadian $ | 69.49 | 69.29 | 0.1% | (0.3)% | down | down | down | |
| Euro | 103.54 | 102.42 (new lows) | (0.6)% | (1.1)% | down | down | down | |
| Swiss Franc | 110.16 | 109.09 (new lows) | (0.9)% | (1.0)% | down | down | neutral | |
| British Pound | 125.11 | 122.08 (new lows) | (1.7)% | (2.4)% | down | down | down (weak) | |
| Japanese Yen | 63.57 | 63.42 | (0.2)% | (0.2)% | down | down | down | |
| Precious Metals | ||||||||
| Gold | 2,641.00 | 2,715.00 | 2.3% | 2.8% | up | up | up | |
| Silver | 29.24 | 31.31 | 4.1% | 7.1% | up (weak) | up (weak) | up | |
| Platinum | 910.50 | 996.10 | 5.0% | 9.4% | up | neutral | neutral | |
| Base Metals | ||||||||
| Palladium | 909.80 | 968.40 | 5.0% | 6.4% | up (weak) | down (weak) | down | |
| Copper | 4.03 | 4.30 | 5.7% | 6.7% | up | down (weak) | up (weak) | |
| Energy | ||||||||
| WTI Oil | 71.72 | 76.57 | 3.5% | 6.8% | up | neutral | down | |
| Nat Gas | 3.63 | 3.99 | 19.1% | 9.9% | up | up | neutral | |
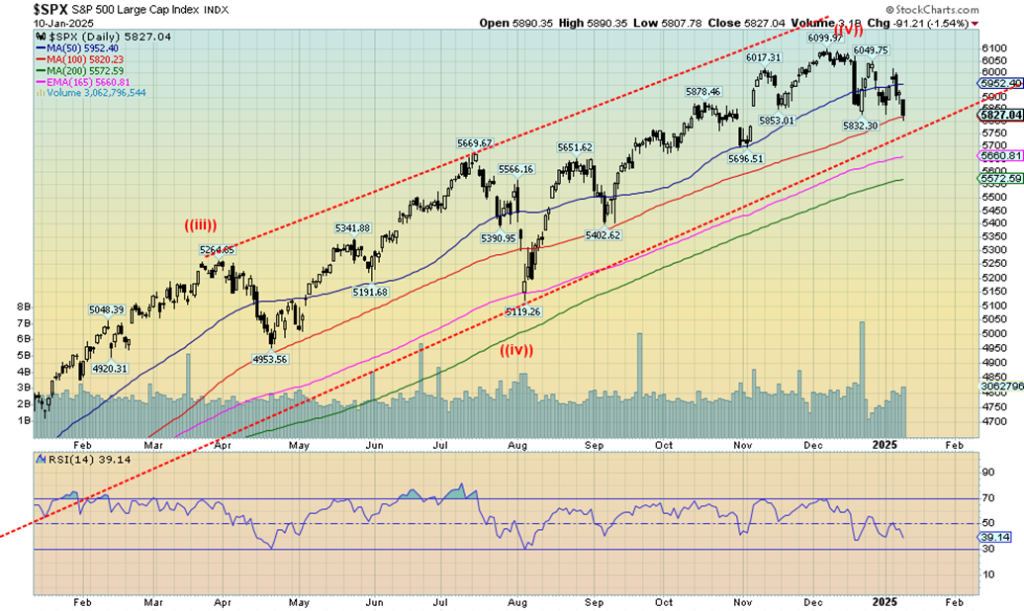
Is the party over? That’s a question we have to ask ourselves, given the action of the past week. It was all about higher bond yields, a chaotic president threatening to unleash terror on everyone, stronger than expected job numbers that suggest cutting rates further might not be on the agenda, sticky inflation, and raging fires in Los Angeles where the economic impact is not as yet known.
However, there are already estimates of up to $150 billion in damage and we suspect it could go a lot higher. Insurance companies are teetering on the edge of bankruptcy and home owners may come out empty-handed as they try to rebuild in a disaster zone that looks worse than Gaza. That is, if they are not more permanently homeless, as some will be. None of it paints a particularly good picture.
The Santa Claus rally was a bust. But the First Five Days indicator eked out a gain. Then the bottom fell out of the market. All that is left of the trifecta is the January Barometer that doesn’t end until January 31. Oddly, that nearly coincides with the FOMC meeting January 28–29. As to the First Five Days indicator, we wondered if traders were trying to prevent it from turning negative.
Friday was the stock market disaster as it realized that the much stronger than expected jobs numbers weren’t actually good for them. The stock market fell Friday as if it had caught the fire from L.A. The stock market wants inflation falling and interest rates falling. Instead, they are getting sticky inflation and rising bond yields. The odds of a rate cut plummeted. On the week, the S&P 500 (SPX) fell 1.9%, the Dow Jones Industrials (DJI) dropped 1.9%, the Dow Jones Transportations (DJT) were lucky and only fell 1.1%, while the NASDAQ, thanks to a weak MAG7, fell 2.3%. The S&P 400 (Mid) was off 1.7% while the S&P 600 (Small) dropped 2.8%.
The NY FANG Index was down 2.6% and the S&P 500 Equal Weight Index dropped 1.8%. Not to be outdone, Bitcoin fell 3.6%. A drop under $90,000 could spell trouble for Bitcoin.
Elsewhere in Canada, the TSX Composite, thanks to Energy and Materials, was down only 1.2% but the TSX Venture Exchange (CDNX) wasn’t spared, down 2.4%. In the EU, the London FTSE actually gained 0.4% despite the pound sterling falling out of bed, the Paris CAC 40 gained 2.0%, the German DAX was 1.6%, and the EuroNext gained 1.5%. The EU was up, the U.S. down. In Asia, China’s Shanghai Index (SSEC) fell 1.3%, the Tokyo Nikkei Dow (TKN) dropped 2.7%, while Hong Kong’s Hang Seng (HSI) fell 3.5%. The MSCI World Index was up a small 0.6%, but we don’t have Friday in those numbers. It’s U.S. and Asia down, EU up.
Friday was a bad day for the stock markets, and with new lows being seen, the odds going forward are not favourable. A trendline that has been around since the 2022 lows is now threatened. A drop below 5,800 seals the deal with stocks headed lower. The 200-day MA is down at around 5,575. The RSI is 39, still not deep enough to suggest the market is oversold.
Since making the all-time high on December 6, the SPX has made two lower highs. That’s a downtrend in formation. On Friday, we made lower lows. Volatility rebounded, but the VIX volatility indictor is still below the December 18 spike. We expect the VIX to take out the December 18 high. Building before this drop was a declining advance/decline line, even as the stock market moved higher, and a put/call ratio that signaled complacency. How things change as the CNN Fear & Greed Index is now registering fear.
Expect that uptrend line to fall, probably in the coming week. Once 5,400 falls, it could be lights out. Only by regaining above 6,050 could the stock market be saved. We’re not expecting that to happen.
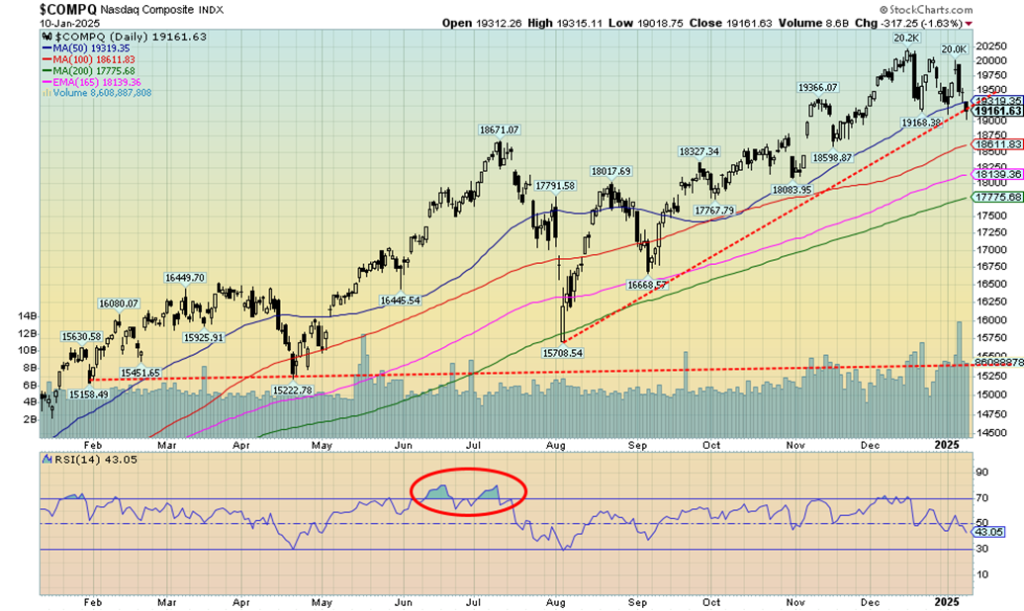
The NASDAQ fell 2.3% this past week. Leading the way down was the NY FANGS Index, down 2.6%. The MAG7 led everyone up, so will the MAG7 lead everyone down? Meta was the only positive one from the MAG7, up 1.9%. Nvidia was the dog, down 5.9%. Netflix lost 4.9% but it is not a member of the MAG7. Nor is Advanced Micro (AMD), which was down 7.4%. They still love Trump as Trump Media (DJT) gained 2.0%.
The NASDAQ appears poised to break that uptrend line from the August low. From there, the 200-day MA down at 17,775 might beckon. Note how volume perked up this past week. Not a good sign on a down week. But with an RSI at 43 we are not as yet oversold. More room to move lower. We’d have to recover and regain 20,000 to suggest to us that a low is in. Otherwise, all we can say is look out below. Is it the final top? Can’t say that yet. That August low was near 15,700. We’d probably have to take that out to say a final top is most likely in.
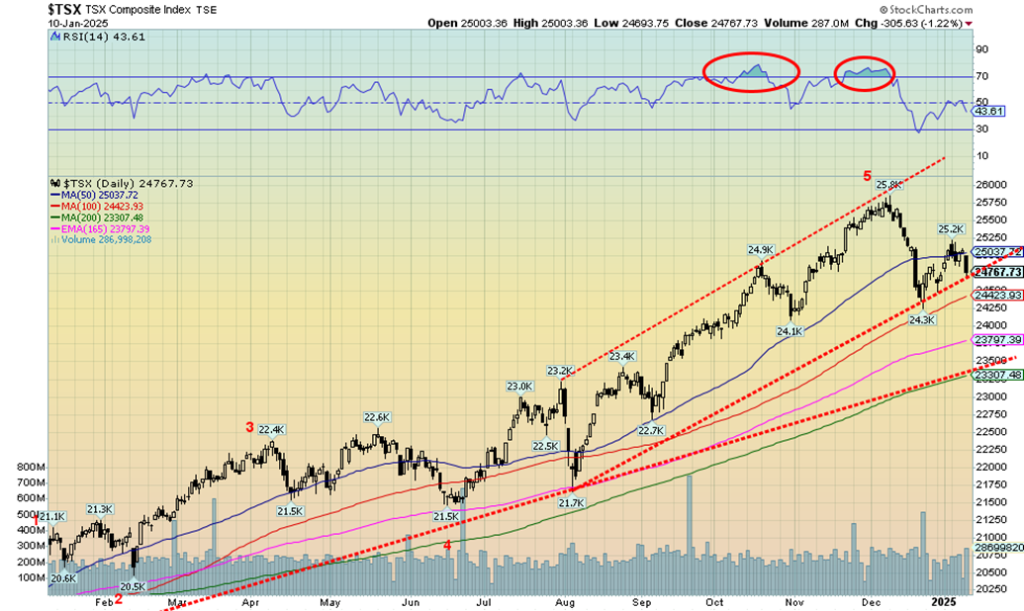
If there is an advantage that the TSX Composite has over the U.S. indices, it is the dominance of materials and energy. Yes, the TSX was hit this past week just like its U.S. counterparts. It just wasn’t hit as badly. The TSX Composite fell 1.2%. The materials and energy dominated TSX Venture Exchange (CDNX) seemed to freak as well, falling 2.4%. Grant you, the CDNX is still up on the year at 1.8%. The others can’t claim that performance. Of the 14 sub-indices, four were up and 10 were down.
No surprise then that Energy (TEN) was up 3.9%, Golds (TGD) gained 2.8%, Metals & Mining (TGM) was up 1.1%, and Materials (TMT) jumped 1.8%. All this in the face of everything else falling. The falling leader was Health Care (THC), down 6.3%, but THC’s impact on the TSX is small. Financials (TFS) fell 2.0%, Consumer Staples (TCS) dropped 3.0%, Real Estate (TRE) was off 3.3%, and Information Technology (TTK) fell 2.5%. Across the board it was Energy and Materials up, everything else down.
A hint on where one should be for 2025? The TSX is on the verge of breaking that uptrend line from August. The next good line also coincides with the 200-day MA near 23,300. Only a return now back above 25,200 might turn this around.
U.S. 10-year Treasury Note, Canada 10-year Bond CGB
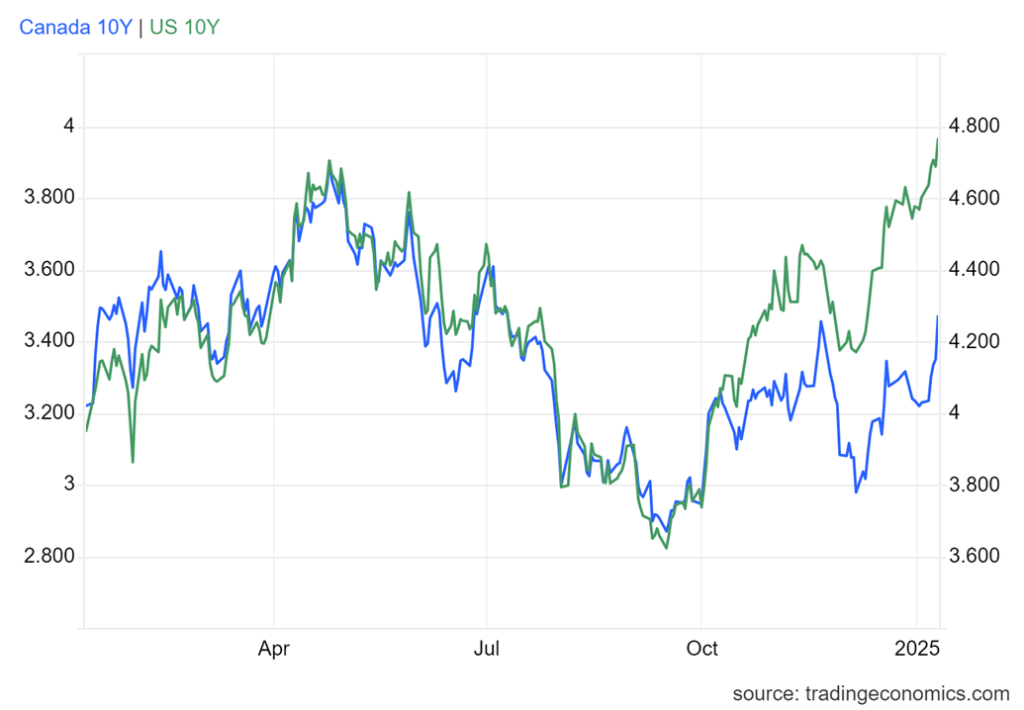
Bond yields are rising. That’s not what they are supposed to do if the Fed is cutting interest rates. Fed rate down, bond yields up. The U.S. 10-year treasury note yield is now up to 4.76%. That’s not far now from the high of 5.07% seen in October 2023. From there we’d have to go back to 2006 and 2007 to see the last time the 10-year yield went over 5.00%. What’s happening?
Economic growth continues to be stronger than expected, the December jobs numbers were gangbusters, inflation is sticky and above where forecasters thought it would be, and expectations for an interest rate cut at the January 28–29 FOMC have faded away. This is not good news for the stock market. Higher bond yields take away from stock yields as expectations of continued rises in PE ratios dissipate. There are also concerns over the potential inflationary impact of Trump tax cuts, deregulation, and especially the threat of trade tariffs. The stock market is noting that and fell sharply on Friday.
Interest rates are also rising in Canada, just not as much. The 10-year Government of Canada bond (CGB) is up to 3.44%. The high in October 2023 was 4.16%. We have a way to go.
At the same time that bond yields are rising, the closely watched 10-year–2-year (2–10) is widening. The U.S. 2–10 is 38 bp and the Canadian 2–10 is 37 bp. Following a long period of a negative yield curve, the yield curve has turned positive. When that happens following a long period of negative yields, it usually means we are getting closer to a recession. If the threats of Trump’s tariffs materialize, a recession could happen.
Higher interest rates are bad for the stock market. Maybe the stock market was noticing on Friday with the DJI dropping over 600 points.
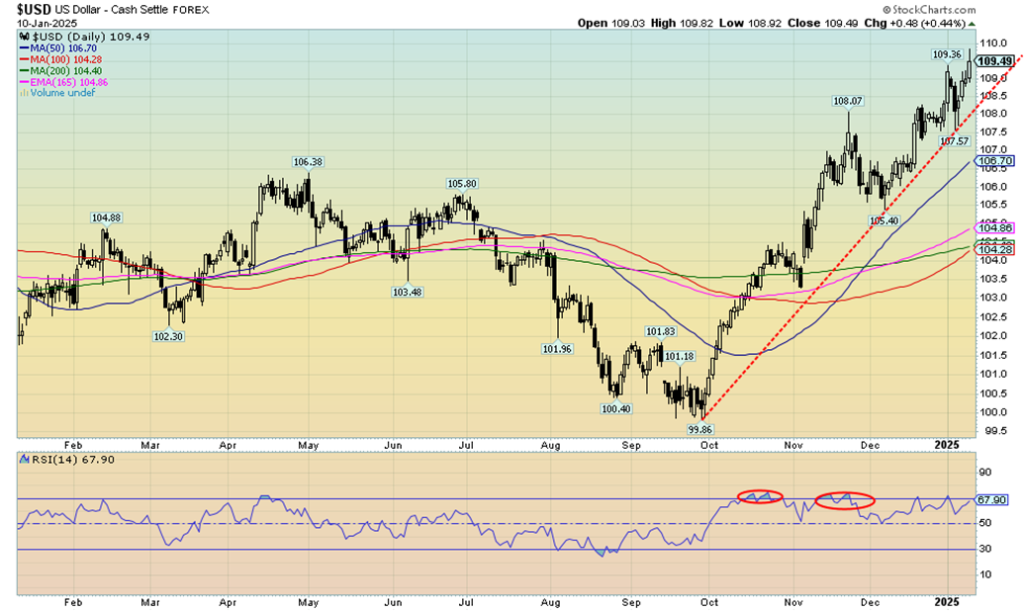
Up, up, and away for the US$ Index. The U.S. dollar rules. The question is for how much longer? The US$ Index has been rising because of the stronger U.S. economy compared to the others, potentially big tax cuts, deregulation by Trump that could boost corporate earnings and the stock market even more, and the positive interest rate differential between the U.S. and everyone else. Continued trouble and conflict with Russia/Ukraine, Israel/Middle East also helps.
On the week, the US$ Index rose 0.7%, while the euro fell 0.6%, the Swiss franc was off 0.9%, the pound sterling suffered the most, down 1.7% while the Japanese yen was down a much smaller 0.2%. Only the Cdn$ gained because of rising oil prices and Prime Minister Justin Trudeau’s resignation. The Cdn$ gained a small 0.1%. The euro, the Swiss franc, and the pound sterling all made 52-week lows while the US$ Index was making 52-week highs.
Of course, a sharply rising U.S. dollar is not good for all the foreigners (of which there are many) that borrowed money in U.S. dollars but their revenue is in the (falling) home currency. As a result, they have to pay back more than they borrowed since it’s in U.S. dollars. A dilemma. And it is what could cause a sovereign debt crisis if they were to default.

Despite strong jobs numbers, rising long-term interest rates, and a rising US$ Index, gold rose this past week. Normally we’d expect gold to get hammered down under those conditions. But no. Instead, we went up in defiance of them. Naturally, when we see that we realize that gold is focusing on something else.
So just what is driving gold higher?
Some factors are the potential for higher inflation, even stagflation, and thoughts that the Fed could now be on hold, tariffs and tax cuts from Trump that could help ignite further inflation, and uncertainty surrounding Trump’s presidency with threats of annexation against Panama and Greenland and economic armageddon for Canada. And we still have the conflicts in Ukraine/Russia and Israel/and just about anybody in the Middle East. Gold senses our concerns that 2025 could be a year of chaos and volatility.
Gold’s biggest competition is Bitcoin, where Bitcoin is being espoused as the replacement for the U.S. dollar as the world’s reserve currency. Then they barely get that thought out and another hack takes place where Bitcoins are stolen. Not that gold can’t be hacked or at least filled with tungsten. Gold can also be stolen, but that’s less a concern as eventually it comes on the market. Demand for gold remains strong, particularly from central banks.
On the week, gold rose 2.3%, silver was up 4.1%, platinum and palladium showed some life, both up 5.0%, while copper gained 5.7%. A good week for the precious metals. Also great were the gold stocks as the Gold Bugs Index (HUI) rose 3.1% and the TSX Gold Index (TGD) was up 2.8%. Gold has been gaining on all the currencies as well, primarily due to the strength of the US$ Index. Gold in Cdn$ rose 2.1%, in euros up 2.9%, Swiss franc up 3.2%, pound sterling up 4.1%, and Japanese yen up 2.6%.
Gold still needs to regain above $2,740/$2,750 to suggest to us that we should see new all-time highs above $2,802. We thought we had completed a potential five-wave advance to the October high at $2,802. The subsequent pattern appears to have taken on the shape of an ABC flat correction. But only new highs above $2,802 can confirm the pattern. Next targets then could be $3,050, once they are through $2,802. We are always reminded that gold does have some positive seasonals during this time, usually topping out during the Prospectors and Developers Association of Canada (PDAC) annual get-together on March 2–5.
But gold rising against a strong jobs report, rising bond yields, and a rising US$ Index we have to view as positive for higher prices.
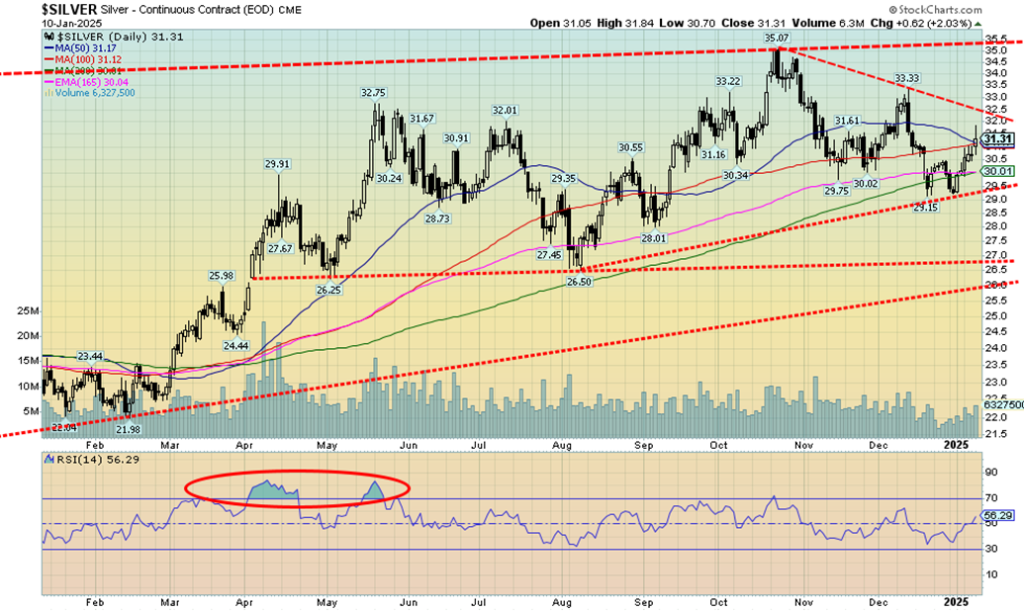
Like gold, silver had a good week. With a gain of 4.1% this past week, silver outpaced gold. Silver is now up 7.1% in 2025 vs. gold up 2.8%. That is a positive development as we need to see silver leading if we are to go higher. But the reality is silver is a lot further from telling us we should see new highs than gold is. We believe we have to break above $34 to suggest new highs above the October high of $35.07. We also have downtrend line resistance just above at $32.00. The 50-day MA stopped our advance this past week.
Other encouraging signs were the higher low we saw on December 31 that was above the one seen on December 14. Despite the good week and start to 2025, silver still lags. Gold is within calling distance of further new all-time highs. Silver, on the other hand, still seems a long way from $50 and the highs of 1980 and 2011. On an inflation-adjusted basis, we’d have to reach $67 to equal 2011 and $175 to equal the 1980 high. A lot of work to be done. Support is down to $29.50 with interim support at $30. We could be forming an ascending triangle, so a breakout over $35.50 could project us up to $44.00. Interim stop would be at $39/$40.
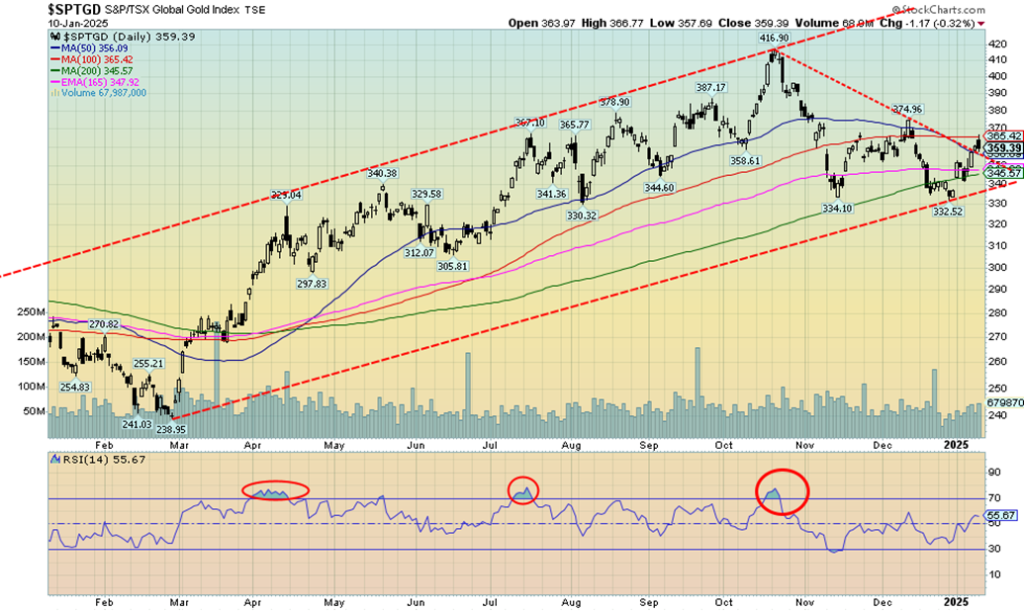
We suppose we should be encouraged by the rise in gold stocks so far in 2025. So far, they’ve been the big winners with the Gold Bugs Index (HUI) up 6.5%, including the 3.1% gained this past week, and the TSX Gold Index (TGD) up 6.7%, including the 2.8% gain this past week. That’s encouraging, but don’t get too excited just yet, as there is resistance above, first at 375 for the TGD and then at 400 and 415. Above 400, new highs could be seen.
The all-time high set in 2011 remains at 455. Because of inflation, we’d have to get to 610 to equal that lofty level. We did break a small downtrend from the October high so that is encouraging. But we note we stopped this past week at the 100-day MA. The recent low at 332 should hold on any pullback with interim support at 340/345. The pattern is encouraging as we see gold stock prices (TGD and HUI) going higher.
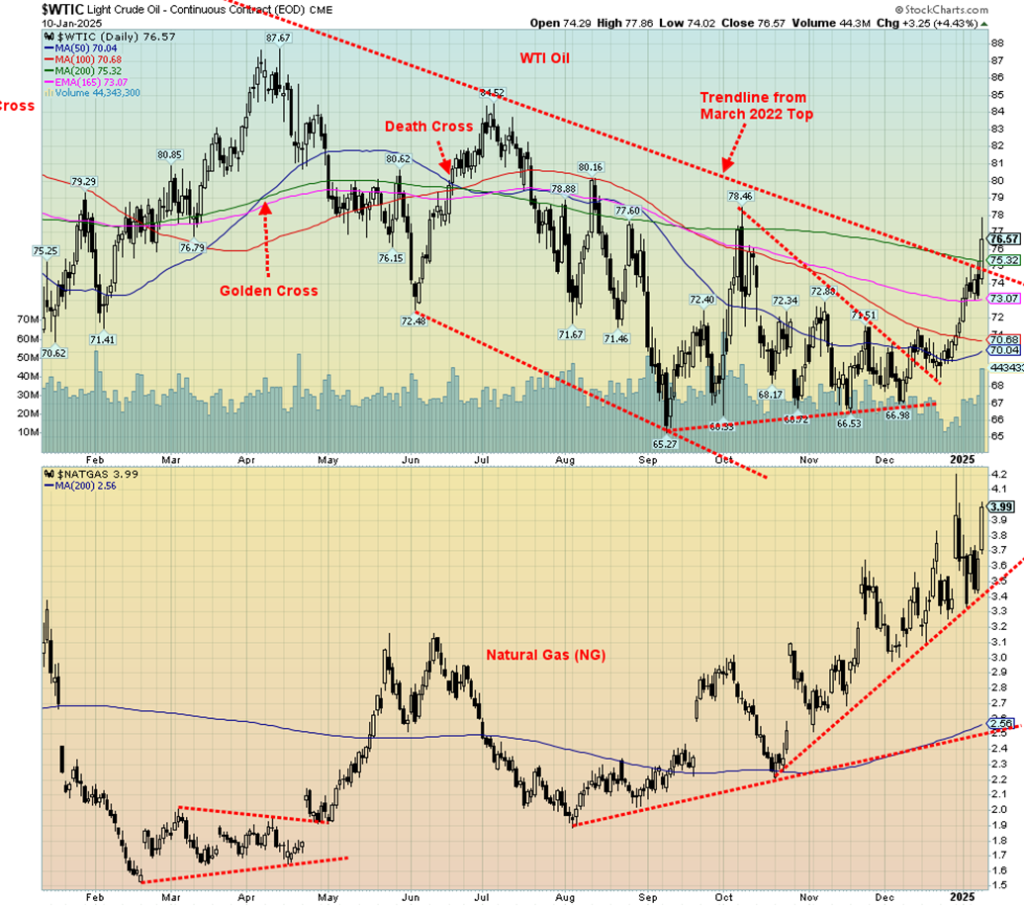
Oil prices are on the rise. Brent crude has broken above $80 for the first time since last October, even as it closed just under $80. This is due to further sanctions on Russia impacting ghost tankers, cold weather, concerns about inflation, especially following the December jobs report, and widening backwardation on the futures curve. What the backwardation means is that the near futures contract (spot) is now rising above futures contracts further out. That shows increasing pressure on the spot market but raises expectations that prices could fall later.
All this is great news for the energy patch. Note that we appear to have broken the downtrend line from the 2022 top. Naturally, we would like to see upside follow-through, but this is a start. On the other side, rising energy prices are not good for consumers as they could see prices rise at the pump and on their heating bills. A host of other products dependent on oil could also see price rises.
On the week, WTI oil rose 3.5%, Brent crude was up 4.1%, and natural gas (NG) also rose, thanks primarily to colder weather, up 19.1% to almost $4.00. In the EU NG at the Dutch hub faltered losing 8.4%. Milder temperatures helped there. Energy stocks rose with the ARCA Oil & Gas Index (XOI) up 1.9% and the TSX Energy Index (TEN) gaining 3.9%.
There is still a fair bit of work to do for WTI oil to even think about the 2022 high near $130. There is some resistance at $80, then $85/$87. Above $90 things are looking higher. However, we’d have to get over $114 to suggest new highs above the 2022 high. $75 could now be support and, as well, down to $73. Further support is seen down to $70. But we look higher, spurred on by an increase in volume. The pressure is all on the spot rate as futures traders appear to be discounting the rise further out.
NG is in a nice uptrend with support now, down to $3.50. Under $3 the rally is over. We have a long way to go to reach the heights of 2022 where NG rose to over $9.00. There is fairly clear sailing for NG prices up to $6.00 where they would run into resistance.
The breakout could be significant. But what we need to see now is upside follow-through with only minimal downside. The biggest risk with Trump back in power is the potential for a clash with Iran—that could send oil prices soaring. The cold weather will dissipate and that may bring some softening of prices. But if the geopolitics flare, oil is going higher.
__
(Featured image by sergeitokmakov via Pixabay)
DISCLAIMER: This article was written by a third party contributor and does not reflect the opinion of Born2Invest, its management, staff or its associates. Please review our disclaimer for more information.
This article may include forward-looking statements. These forward-looking statements generally are identified by the words “believe,” “project,” “estimate,” “become,” “plan,” “will,” and similar expressions, including with regards to potential earnings in the Empire Flippers affiliate program. These forward-looking statements involve known and unknown risks as well as uncertainties, including those discussed in the following cautionary statements and elsewhere in this article and on this site. Although the Company may believe that its expectations are based on reasonable assumptions, the actual results that the Company may achieve may differ materially from any forward-looking statements, which reflect the opinions of the management of the Company only as of the date hereof. Additionally, please make sure to read these important disclosures.
Copyright David Chapman 2024
David Chapman is not a registered advisory service and is not an exempt market dealer (EMD) nor a licensed financial advisor. He does not and cannot give individualised market advice. David Chapman has worked in the financial industry for over 40 years including large financial corporations, banks, and investment dealers. The information in this newsletter is intended only for informational and educational purposes. It should not be construed as an offer, a solicitation of an offer or sale of any security. Every effort is made to provide accurate and complete information.
However, we cannot guarantee that there will be no errors. We make no claims, promises or guarantees about the accuracy, completeness, or adequacy of the contents of this commentary and expressly disclaim liability for errors and omissions in the contents of this commentary. David Chapman will always use his best efforts to ensure the accuracy and timeliness of all information. The reader assumes all risk when trading in securities and David Chapman advises consulting a licensed professional financial advisor or portfolio manager such as Enriched Investing Incorporated before proceeding with any trade or idea presented in this newsletter.
David Chapman may own shares in companies mentioned in this newsletter. Before making an investment, prospective investors should review each security’s offering documents which summarize the objectives, fees, expenses and associated risks. David Chapman shares his ideas and opinions for informational and educational purposes only and expects the reader to perform due diligence before considering a position in any security. That includes consulting with your own licensed professional financial advisor such as Enriched Investing Incorporated. Performance is not guaranteed, values change frequently, and past performance may not be repeated.

-

 Impact Investing2 weeks ago
Enfinity Launches First Solar Plant in Italy with Microsoft
-

 Crypto4 days ago
Bitcoin Wavers Below $70K as Crypto Market Struggles for Momentum
-

 Markets2 weeks ago
Silver Dips Sharply, While Gold Gains Amid Mixed Stock Market
-

 Africa19 hours ago
Morocco’s Tax Reforms Show Tangible Results


