Featured
A Billion Dollars Isn’t What it Used to Be
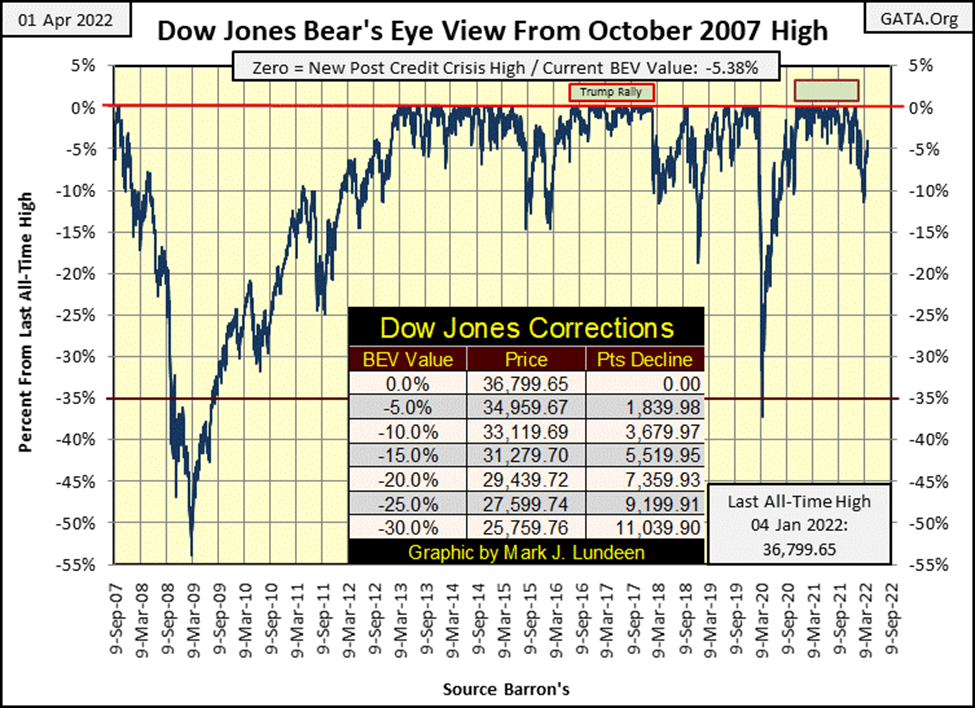
Since last September, the Dow Jones hasn’t liked closing below 34,000. That plus since January 4th, the Dow Jones hasn’t been able to make a new all-time high. Since early January, the Dow Jones has spent most of its time deflating a bit at a time. Then three weeks ago, it made a move off its 33,000 level to where we see the Dow Jones at the close of this week.

The Dow Jones closed this week almost where it did last, down about $45, or 0.12 BEV points. Last week I thought the Dow Jones was thinking it over; what its next big move was going to be; to the up or downside, to new all-time highs, or a break below its 2020 flash crash’s BEV -37% bottom.
This week I’m no closer in making that call; what direction will the Dow Jones’ next big move will be; up or down? Logically I believe it should be down, for lots, or reasons. First, the post-March 2020 Flash Crash Advance (our market advance) is a phony advance. Driven solely by “liquidity injections,” flowing from the FOMC. Such bull markets are also called financial bubbles, and all such bubbles ultimately pop and deflate.
And now, Putin has turned things around for NATO and Joe Biden by demanding countries hostile to Russia (the US and NATO) must now pay for Russia’s oil and natural gas with rubles or gold. Russia will no longer take America’s IOU nothings flowing from the Federal Reserve. Now we all feel the pain when filling our gas-tanks!
Unlike the US and NATO, Russia isn’t loaded down with massive levels of debt. So, they can afford to take a loss on their oil exports for a while, maybe a long while. This means Putin will not be forced to take a second job to service his 30Yr mortgage, credit-card debt, school or car loans from the bank.
* It’s so nice not owning anyone any money! *
These new Russian sanctions are having a good effect for Putin, as seen in the chart below for the Russian ruble. Two weeks ago, the ruble spiked to about 134 rubles to the dollar because of Western sanctions. This week, it was the dollar’s turn to collapse in ruble terms, down to 85 rubles to the dollar. So much for sanctions from Washington and NATO harming Russia.
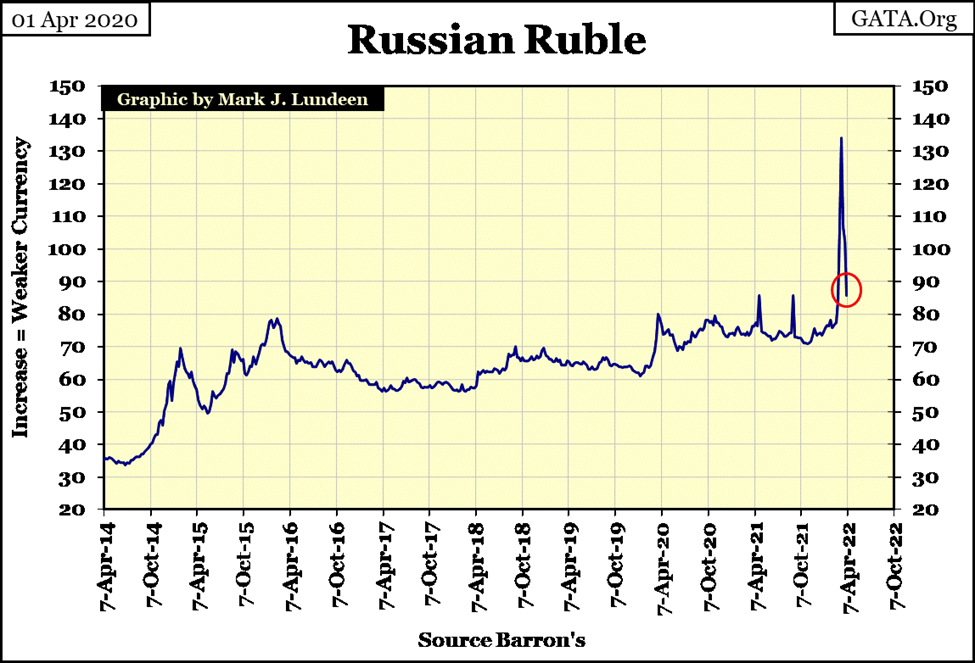
It appears this exact thing, (having sanctions applied to them) that is now happening to Washington and NATO, who are discovering they really do need oil and gas from Putin, as Putin is now sanctioning them via the petrol-ruble!
The West has a gaggle-of-clowns in leadership positions, who make threats to militarily enter Ukraine or nuke Russia. This is not helpful. Our “leaders” need to tone it down.
In the past, I’ve not said anything bad about Putin, as for the most part such news is from the mainstream media. A very compromised source of information, staffed with people who are willing to say (lie) about anything to support our very corrupt financial and political establishments. So, knowing so little about the actual Ukraine / Russia situation, my first inclination is to go counter to the mainstream media’s narrative. That’s not saying I believe Putin is an angel, or I don’t feel pity for the people in Ukraine who are suffering.
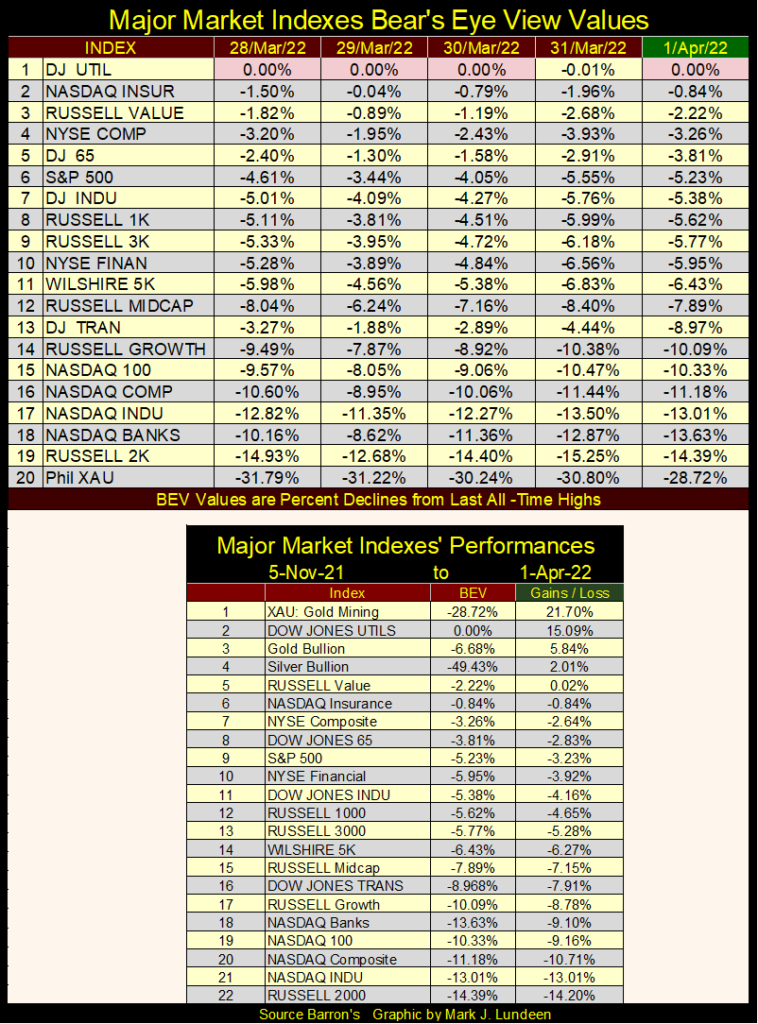
Major market indexes, like the Dow Jones above, are also waiting for something to happen before they make their next big move in the table below. But what’s with the Dow Jones Utilities? Since March 3rd they have made eight new BEV Zeros, and haven’t closed below a BEV of -2.50% in daily trading.
So, what’s up with the Big Smoke Stacks? Is the market pricing in our “progressive’” solar & wind power future? The “progressives” are the same people who would like to see US armed forces enter the Ukraine in a kinetic sort of way. The anti-Vietnam War “peace activists” from the 1960s, and their political broods, such as congressional-entity (I hope I used its preferred personal pronoun) Alexandria Ocasio-Cortez (NY-D), are the biggest war mongering, market manipulating agents-of-hope & change the United States have ever seen.
Be that as it may be, the stock market as a whole also appears to be waiting for something to happen. If that is something good or bad, that is something you and me are going to have to wait to see.
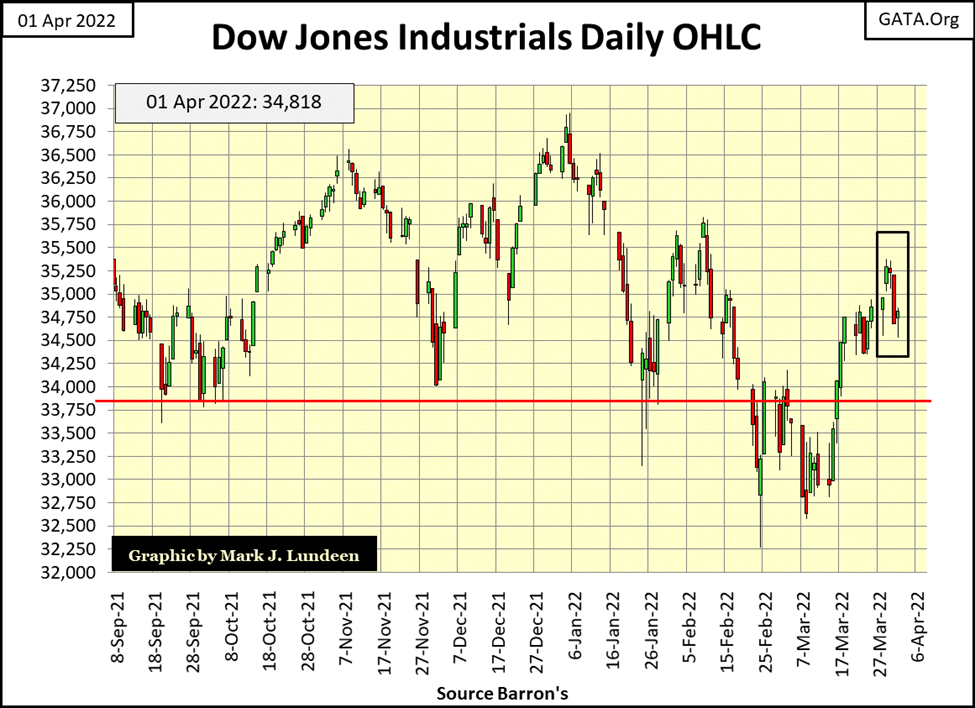
Moving down to the Dow Jones’ daily bar chart below, nothing really happened this week. The week started off strong, but then closed just a few dollars off last week’s close. Since last September, the Dow Jones hasn’t liked closing below 34,000. That plus since January 4th, the Dow Jones hasn’t been able to make a new all-time high. Since early January, the Dow Jones has spent most of its time deflating a bit at a time. Then three weeks ago, it made a move off its 33,000 level to where we see the Dow Jones at the close of this week.
Maybe this advance will end with the Dow Jones making market history. But after studying this chart, I have a feeling that in fact the past three weeks will ultimately be a bullish correction within the context of a larger bear market decline.
This is just a feeling I have at this point of time. Should we see the Dow Jones and the other major indexes above take off to the upside, I’ll change my bearish opinion in a New York minute. I always keep in mind that I’m looking at the market, and the market can do anything at any time.
Look at the Russian Ruble chart above. Every “market expert” gleefully called for the weakening ruble when the sanctions were first placed on Russia. Who called the collapsing dollar in terms of rubles we’ve seen these past two weeks? Not me!
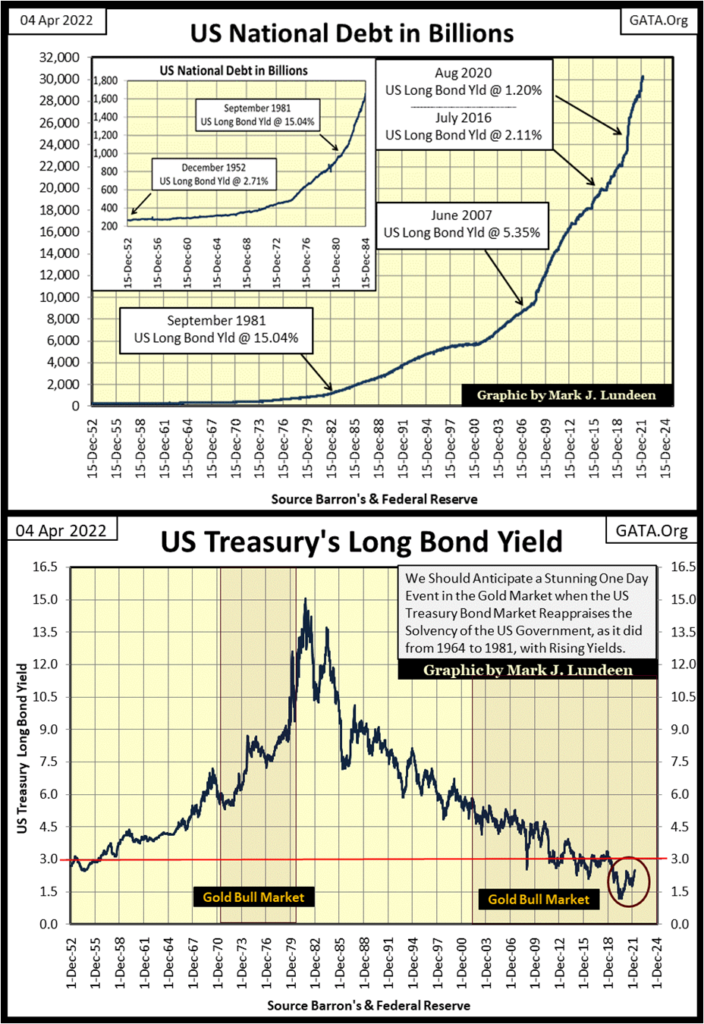
One of the things economics used to stress was credit risks; the more debt a person, corporate entity, or government has to service, the higher the risk its creditors must also bear. And being a risky credit, the cost of money for borrowing additional sums increased. So it went, until September 1981 as seen in the chart insert below.
In December 1952, the US national debt was $267 billion dollars, a distressing figure that inspired concern by all, 70 Years ago. Yet the US Federal Government, being the US Federal Government, could continue to increase its debt at a very reasonable rate of only 2.71%, and that is how things went until the 1960s.
I remember Richard Russell commenting about when the long T-bond yield rose above 5% in September 1967. “Back then,” he said, “bond buyers believed a 5% yield in the T-bond market would begin sucking dollars off the face of the moon.”
NASA would know more about that than I do. All I can say about this is, since 1952, the US national debt had increased to $336 billion dollars by September 1967, a then whopping increase of $69 billion from fifteen years before, resulting in a doubling of bond yields for the US Treasury. And bond yields in the T-bond market would continue increasing until September 1981, when they peaked at 15.04% as the US national debt reached $977 billion dollars.
Public and market sentiment at the time was one of alarm. CPI inflation was double-digits as the Federal Government’s debts approached $1 trillion dollars!
It’s apparent how in the 1960s, the bond market was holding the US Government to the simple economic reality, the greater the debt load a debtor had to service, the greater the risks its creditors bare. So, bond buyers demanded larger yields to compensate themselves for the growing risks they took on in the Treasury market. Before 1981, the US Treasury had to pay bond buyers an ever-rising coupon yields to sell additional debt in the T-bond market.
All that changed post 1981, as seen in the chart below. For the next thirty-nine years, as the US national debt increased above $26.5 trillion dollars in August 2020, the yield for the long T-bond collapsed to 1.20%.
How did that happen? Kevin M. Warsh, former Fed Governor tells us how this was done below.
In a nutshell, today’s yields for US Treasury debt are market manipulations, yields that in no way compensate bond owners for the * MASSIVE RISKS * they have taken on holding so called riskless AAA rated-Treasury debt. What kind of massive risks are hidden in the Treasury bond market? At some point the idiot savants at the FOMC are going to lose their control over the bond market, and yields will rise. Then T-bond owners will discover, as did Bunker Hunt below, that a billion dollars isn’t what it used to be.
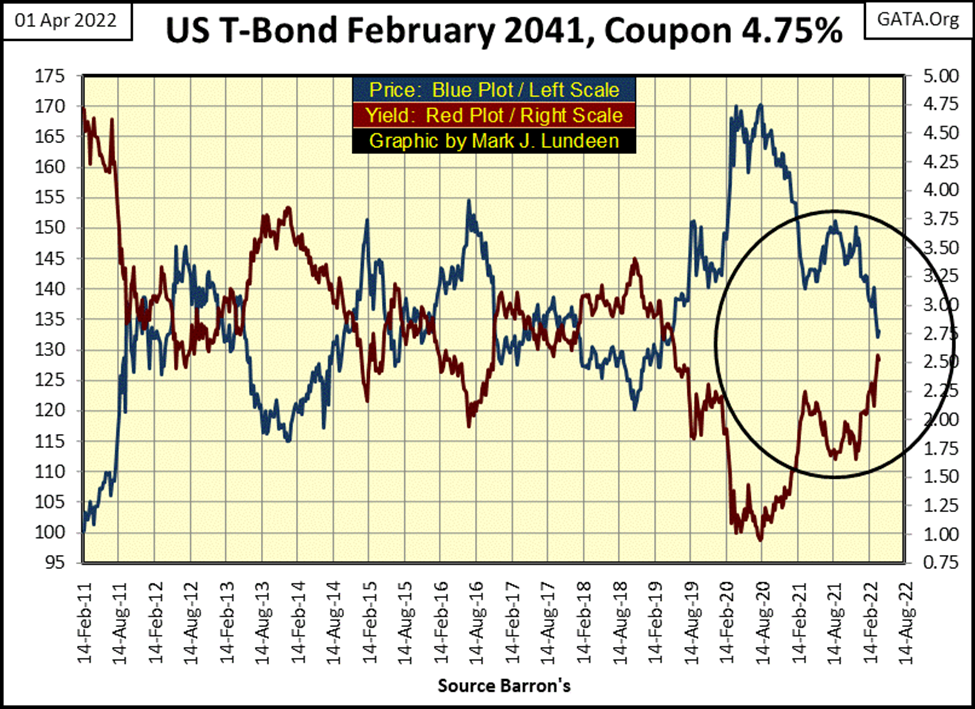
Below is a chart for a US Treasury 30Yr Bond issued in February 2011. In it, we see how variations in bond yields (Red Plot), impact bond prices (Blue Plot). As this bond’s yield increased from below 1% in August 2020, to 2.52% at this week’s close, this bond’s face value deflated by 22%, a loss of principle that overwhelms any annual coupon income this bond had ever paid to anyone who owned it.
As bond yields continue rising in the years to come, this will be a story told over and over again by pension fund money managers, fiduciaries for insurance companies, and beneficiaries of trust funds filled with Treasury Debt for safety. Holding wealth in the Treasury, or any of the bond markets in 2022 is a very dangerous thing to do.
How high can T-bond yields rise? With the current national debt being over $30 trillion dollars, something higher than the 15% T-bonds yielded when the national debt was just a tad over $1 trillion dollars in 1981.
That will be a bleak day for Wall Street and the US Treasury. But it’s an ill-wind that blows no good. Come the days when billionaires and millionaires again discover being a billionaire or millionaire isn’t what it used to be, vast flows of flight-capital will once again take-to-foot, finding safety in the old monetary metals; gold silver and the mining companies that mine then.
That’s how I see this playing out sometime in the future. So, let’s see what gold did this week in its BEV chart below.
This BEV chart goes back fourteen-years, and we see while all BEV Zeros (0.00%) are new all-time highs, no two identical closing prices can be BEV Zeros in a BEV chart.
I noted three significant BEV Zeros below. In March 2008, it took a close of $1003, gold’s first four-digit dollar close to make a BEV Zero (0.00%) in the chart below. Gold saw a very nice advance following the sub-prime mortgage debacle, with the last BEV Zero of that advance closed with the price of gold of $1888. We also see our latest BEV Zero, August 6th 2020’s, close of $2061. So, in gold’s BEV chart below, we’ll never see its plot rise above 0.00%, a BEV Zero, no matter what the price gold.
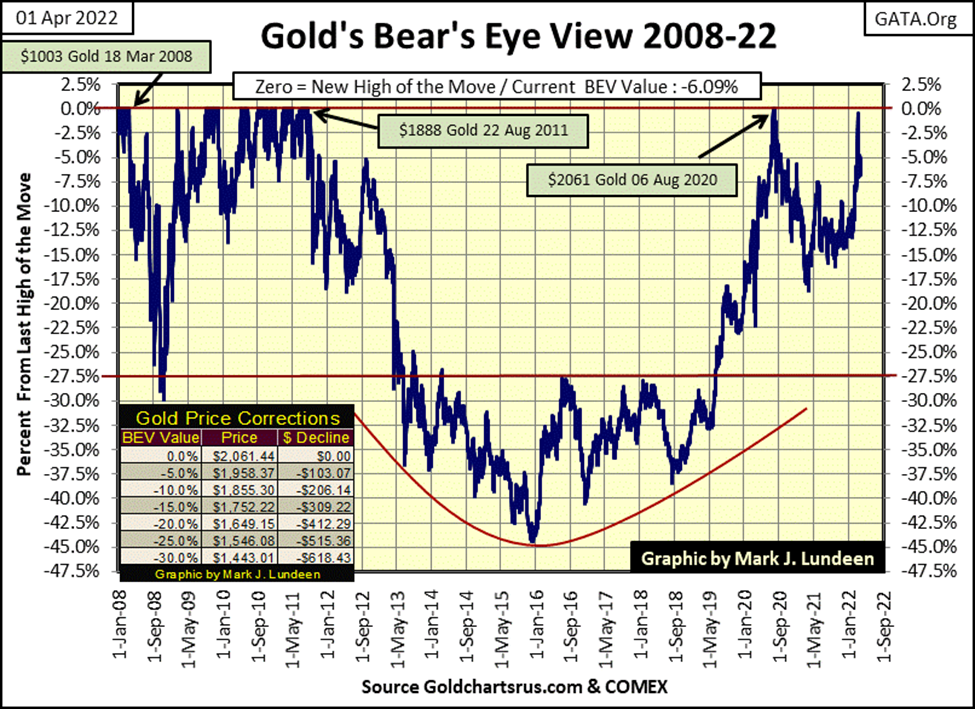
Anyways, the gold market continues looking good. I know market sentiment for gold is currently dreary, and everyone is frustrated, but that doesn’t matter as this is a market that has been sold out for years. By saying sold out, I mean gold and silver have not been a popular destination for investment funds for many years.
The people holding precious metals assets today are hardcore believers of the evils of central banking – people like me. I’m not going anywhere. So, being aware of the coming problems personal wealth is going to have to deal with in the years to come, from rising interest rates and bond yields, to massive inflation in consumer prices, at night I sleep comfortably knowing my personal wealth is in the old monetary metals and their miners.
Okay, great. But when is gold going to begin my much-anticipated run into market history? I haven’t a clue. As I see it, the bull market in gold and silver will be a reaction to a massive bear market in everything Wall Street has been peddling to the public for the past few decades. If I can’t predict one, I can’t predict the other. This is a time for patience – damn it.
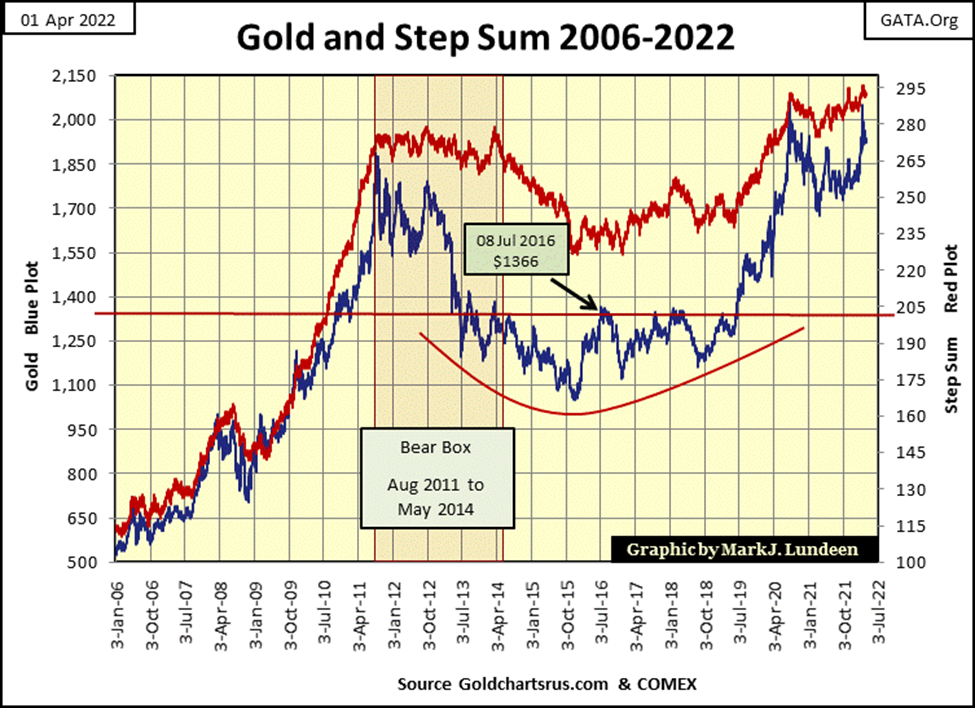
As it’s been true for the past month or so, gold’s step sum chart below remains little changed, but continues being positive for a breakout in the gold market. A break out above $2150 may result in a bull market run as we see in this chart from 2006 to 2011.
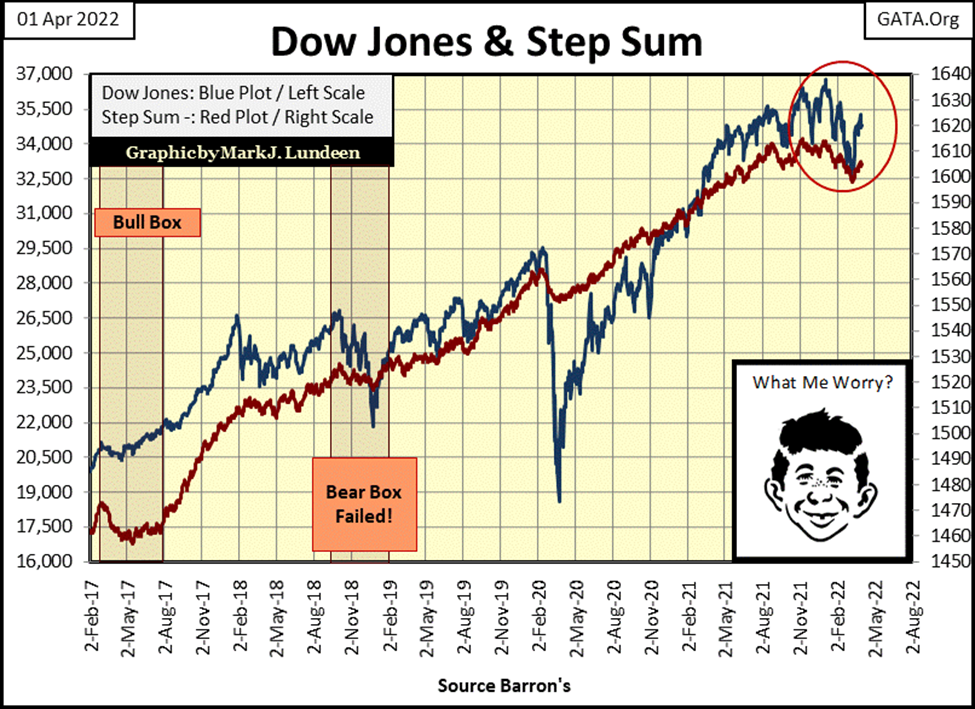
Here is the step sum chart for the Dow Jones, it too is little changed in the past few weeks. Like gold, we’re waiting to discover whether its next move will be a new all-time high, only a 5.3% advance from today’s close would do that, or if the Dow Jones will continue deflating, somewhere far below.
Here are the step sum tables for gold and the Dow Jones below. Not too much to say about then, except to note how the Dow Jones closed the week with a 15-count of +7, making the Dow Jones an overbought market. Markets don’t like being overbought, so they usually sell off when they are. But they don’t have to. We wait to see what next week brings to Wall Street.
That’s it for this week. I’ll have some more market commentary next week.
__
(Featured image by geralt via Pixabay)
DISCLAIMER: This article was written by a third party contributor and does not reflect the opinion of Born2Invest, its management, staff or its associates. Please review our disclaimer for more information.
This article may include forward-looking statements. These forward-looking statements generally are identified by the words “believe,” “project,” “estimate,” “become,” “plan,” “will,” and similar expressions. These forward-looking statements involve known and unknown risks as well as uncertainties, including those discussed in the following cautionary statements and elsewhere in this article and on this site. Although the Company may believe that its expectations are based on reasonable assumptions, the actual results that the Company may achieve may differ materially from any forward-looking statements, which reflect the opinions of the management of the Company only as of the date hereof. Additionally, please make sure to read these important disclosures.


PayPal’s Slowdown: From Fintech Leader to Low-Growth Dividend Stock
PayPal has shifted from fintech leader to low-growth, value-style stock, losing over 25% in market value and trading at a...


Tilray (TLRY) Falls as Bearish Momentum Persists Despite Marketing Push
Tilray (TLRY) fell 3.32% to $4.44, remaining below key moving averages and signaling continued bearish pressure. Despite a £1 million...


ESG Gap Persists as Firms Struggle to Link Sustainability to Financial Value
KPMG’s Global Survey shows a major gap between ESG awareness and financial integration. While 72% of managers understand sustainability strategies,...


Bitcoin and Ethereum Slide as Market Pressure Builds Amid Strategy Concerns and Layer 2 Disruptions
Bitcoin fell below $60,000 with heavy ETF outflows, pressured by concerns over Strategy’s finances and its STRC stock decline. Ethereum...


AI Venture Builder Launches €600K Crowdfunding Round to Scale Secure AI Solutions
AI Venture Builder, an Italian-British firm developing AI applications and vertical startups, returns to CrowdFundMe with a equity campaign. After...
 |
|
 |  |
 |
|
-

 Cannabis2 weeks ago
Europe’s Cannabis Shift: Rising Use, and New Risks
-
 Crowdfunding20 hours ago
AI Venture Builder Launches €600K Crowdfunding Round to Scale Secure AI Solutions
-

 Impact Investing1 week ago
AI Adoption in Italian Retail Stalls Despite Strong Experimentation
-

 Cannabis2 weeks ago
Cannabis Legalization in Germany: A Mixed Interim Assessment