Featured
A Look at How Markets Reacted During the Two Biggest Wars of the Last Century
The FOMC and BofC met. BofC didn’t hike rates as expected. The Fed remains hawkish and that spooks the market. The U.S. dollar soared and gold and silver “tanked”. Gold looks vulnerable to the downside but the larger pattern continues to look bullish. If gold is unloved and unwanted why have the central banks loaded up? We look at Russia’s international reserves including its gold reserves.

Are we headed for the worst January ever? Previously, the worst January ever for the S&P 500 was in 2009 when it fell 8.6%. The NASDAQ’s worst January was 2008 when it fell 9.9%. The NASDAQ appears destined to easily beat that mark, given it is down 12.0% to date. The S&P 500 is down too but, barring a big down day on Monday, January 31, the 2009 record may remain intact. So far, the S&P 500 is down 7.0% in January following Friday’s big bounce-back.
Change Since Start of Year 2022
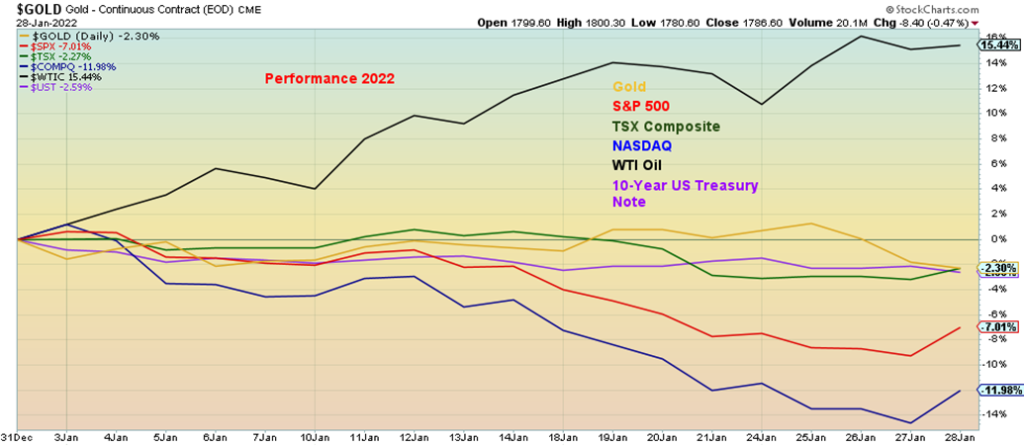
The clear-cut winner to date has been WTI oil, up 15.4% so far in 2022. Gold was up earlier but faded in the past week and is down 2.3%. The TSX is off 2.3% and the US 10-year treasury note is down as well at 2.6%. Nothing has been spared. The small-cap Russell 2000 is down 20% so far, signaling that small-cap stocks are already in a bear market. The large-cap Russell 1000 is also in record January down territory, off 8.5% thus far. According to Ned Davis Research, a stock market research group, this is the worst January start ever. The Stock Trader’s Almanac lists 2009 as the worst ever.
And what does that say about the January barometer? Not good, as the odds favor 2022 to be a difficult year. The caveat is that out of 11 misses since 1950, eight of them have occurred since 2000 including six since 2009. Misses were seen in 2009, 2010, 2014, 2016, 2018, and 2020. So, is the January barometer still working? The odds still favor 2022 as shaping up to be a difficult, possibly down year. Is there any hope? Extreme fear can help form a market bottom. Are we there yet?
The difficulty for the market has been primarily with the high techs that sparked the market to record heights. In 2021, four stocks—Microsoft, Apple, Google (Alphabet), and Tesla—accounted for 25% of the S&P 500’s total return. All are down so far in 2022. It is no surprise to find that these stocks, along with the rest of the FAANGs, are taking the market down. The four noted are already down a collective 10.3% in January.
But now the Fed is taking away the punch bowl and the market is not reacting well to this news. The market is already dealing with the rampaging Omicron variant (where the U.S. has already surpassed 900,000 dead), the Russia/U.S./Ukraine tension, and the China/U.S./Taiwan conflict. The Fed has a history of not reacting soon enough and when they do, they tend to overshoot. The FOMC meeting of January 25–26 saw no rate hikes. Some had expected the Fed to pre-empt and starting hiking at that meeting. The next FOMC meeting is not until March 15–16 where the Fed is widely expected to hike rates 25 bp. Could they hike 50 bp? The hint was that there would be at least three rate hikes in 2022 and now the market is pricing in four rate hikes, with some traders even pricing in five rate hikes.
The great QE unwinding is underway and is expected to be completed by March. Now there is talk the Fed will start QT—quantitative tightening. What that means is that they will start to sell bonds from their portfolio into the market. This has the effect of draining funds out of the financial system. If funds are drained, that means fewer funds are available for risk assets. And that, in turn, spells potential trouble for the stock market. Is the Fed more concerned about inflation, about asset bubbles, or about keeping the stock market afloat and employment strong? A trend away from risk assets could also spill over into the housing market and into other asset classes. How the Fed reacts going forward is important. If the market is in a meltdown and economic numbers weaken, will they continue to stick to their interest rate hike agenda?
Years of ultra-record low-interest rates, combined with years of QE have created what some have called one of the biggest asset bubbles of all time. And the asset bubble hasn’t just been confined to stocks. Housing, art, antiques, coins, and stamps have also benefitted. Some have called it the “everything bubble.”
There is a direct correlation between ultra-low interest rates, QE, an expansionary money supply (M2), and the performance of the S&P 500. This has now put the markets in a very vulnerable position if interest rates
are hiked and the punch bowl of QE is taken away. Add in nervousness about outside events, fear of QT, and the probability that the Fed could be shrinking its balance sheet, and we could see a slowdown in monetary growth (M2, M1, etc.) that could spell considerable trouble for markets in 2022. Maybe the January barometer will fulfill its prediction after all.
S&P 500, Fed Rate, GDP, M2 1980–2022
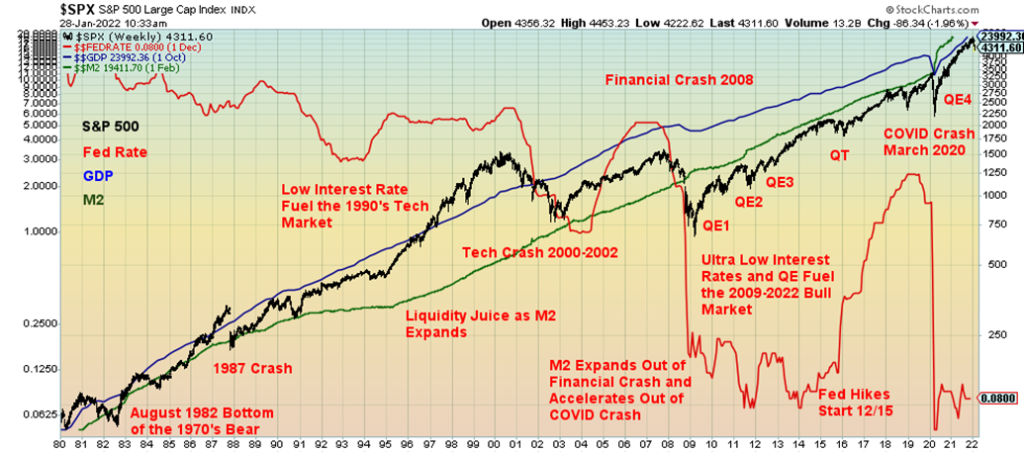
Chart of the Week
War and the Markets
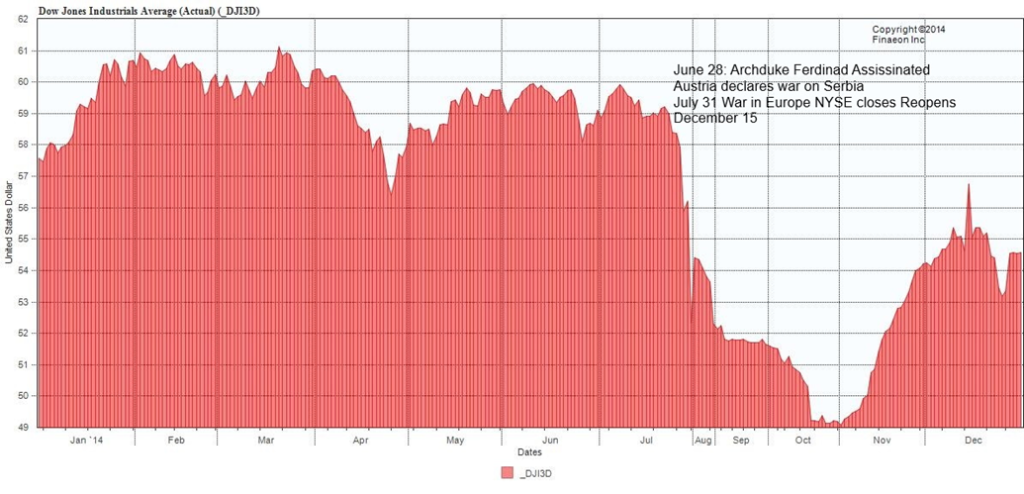
Dow Jones Industrials 1914
All of the talk about war with Russia had us looking up what happened in previous periods when war broke out. No, we are not suggesting that World War III is about to burst onto the scene. However, we are reminded that no one thought that World War I would break out, and as to World War II, there was to be “peace in our time.” World wars are actually rare events. In the 20th century there were two. In the 19th century only one: the War of 1812–1814 coupled with the Napoleonic Wars in Europe could qualify as a world war. And in the 18th century, again, there was only one that encompassed a great deal of the world at the time and that was the war known as the Seven Years’ War of 1756–1763.
Yes, regional wars or wars involving the Great Powers can spark a market reaction. Gulf War 1 in 1990 was one as was Gulf War 2 in 2003. Both saw sell-offs into the invasion, but then the markets rebounded strongly following the actual invasion. The war in Vietnam was a long-drawn-out affair, but we note that the peak in the stock market for the next 16 years came in 1966 as the U.S. was ramping up its involvement in Vietnam. The September 11, 2001 attacks sparked a market collapse and a temporary shutdown of the exchange. There are a number of examples of temporary shutdowns, but not all were war-related and there are too many to enumerate.
The first chart above shows the action of the Dow Jones Industrials (DJI) in 1914. The assassination of Archduke Ferdinand in June 1914 did spark a sell-off. By the time war was declared on July 31, 1914–August 1, 1914, the DJI had fallen roughly 13%. The NYSE closed for the first time since 1873 based on fears of an avalanche of selling from Europe. Market makers continued to make daily prices but nothing traded. In terms of bid/offers the market bottomed according to analyst calculations on November 2, 1914. The NYSE, however, did not reopen for trading until December 12, 1914, surprisingly not far from where it left off in late July. That proved to be a low and the 1915 stock market was one of the best ever as the DJI rose 110% into 1916 as the market surmised that American companies stood to benefit from the war.
Dow Jones Industrials 1938–1949 Inflation-Adjusted
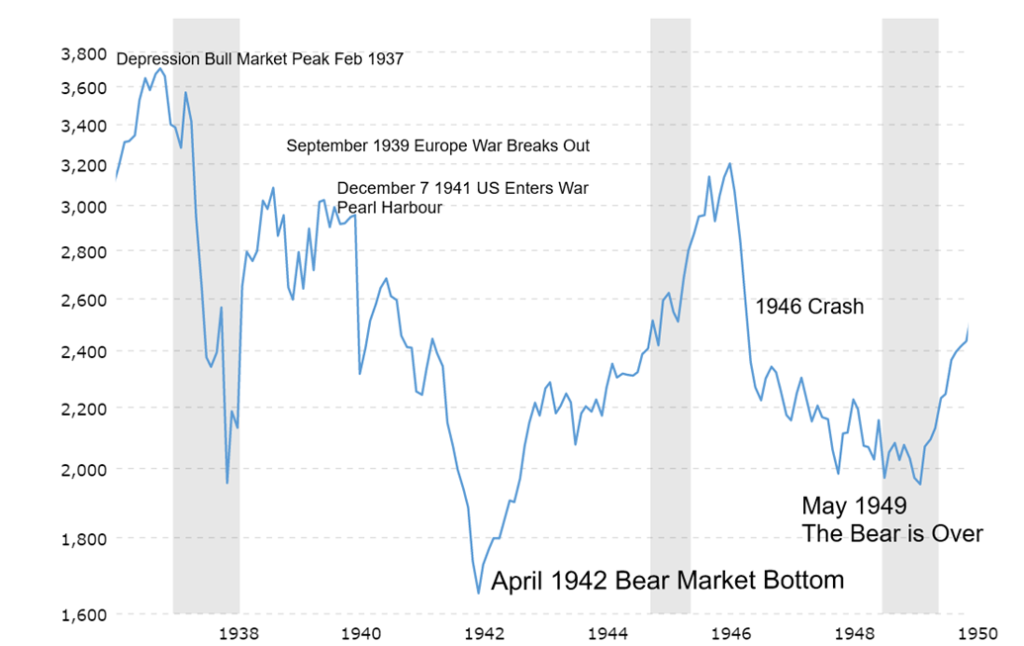
The second chart shows the DJI from 1937 to 1949 covering the period leading up to World War II and its aftermath and culminating with the 1949 bear market low that signaled the end of the Great Depression and War 1929–1949. We used an inflation-adjusted chart as it defines the peaks and troughs better than a nominal chart. The nominal low in 1949 was actually only marginally lower than the nominal low in 1946. The Great Depression bull market 1932–1937 peaked in February 1937. The stock market crash of 1937–1938 was sparked primarily by the Fed tightening and the Fed together with the U.S. Treasury carrying out contractionary policies. (Does that sound familiar? Hiking interest rates, end of QE, QT?)
Things heated up in 1938 following Germany’s annexation of Austria. Markets recovered into the latter part of 1938 as the Munich Pact of September calmed the waters. In March 1939 Germany annexed Czechoslovakia and Germany and Italy signed a military pact. Markets recovered but peaked by early September when Germany invaded Poland from the west and Russia invaded Poland from the east. Britain and France declared war on Germany.
The market seemed to mark time into 1940, but when Germany crossed into France and marched on Paris the DJI sunk roughly 24% in May/June 1940. The invasion of France sparked the Dunkirk evacuation as British forces were trapped in France. Again, the markets seemed to mark time throughout 1941 until September when FDR signed a huge tax bill to raise money. By December 7, 1941 and the Japanese attack on Pearl Harbour the market was already on a downward swing. The crash of ’42 followed and by April the DJI had fallen over 40% from its high in September 1939. The bottom came in late April as U.S. victories in the Pacific signaled that the tide of war could go in the U.S.’s favour.
For the next four years the markets enjoyed a significant upswing. From the low in April 1942 to its top in May 1946 the DJI gained 129%. In August 1945 the U.S. dropped the atomic bomb on Hiroshima and Nagasaki (August 6 and 9), hailing the end of the Pacific War and the surrender of Imperial Japan. Rather than celebrate, the markets feared a new type of war with atomic weapons. The crash of 1946 followed. For the next few years, the markets chopped around. In April 1949 NATO was created and a long Berlin airlift ended. The markets made their final bottom on June 13, 1949, signaling the end of the long Great Depression and War.
Each war brought different market responses. The key take-away here is that war is not good for stock markets unless your side is being perceived to be winning and benefitting. The lead-up to war can see a choppy market, but if actual war broke out between the West and Russia, markets would most likely not respond kindly.
MARKETS AND TRENDS
| % Gains (Losses) Trends | ||||||||
| Close Dec 31/21 | Close Jan 28/22 | Week | YTD | Daily (Short Term) | Weekly (Intermediate) | Monthly (Long Term) | ||
| Stock Market Indices | ||||||||
| S&P 500 | 4,766.18 | 4,431.85 | 0.8% | (7.0)% | down | down (weak) | up | |
| Dow Jones Industrials | 36,333.30 | 34,725.47 | 1.3% | (4.4)% | down | down | up | |
| Dow Jones Transports | 16,478.26 | 15,048.62 | (1.3)% | (8.7)% | down | down (weak) | up | |
| NASDAQ | 15,644.97 | 13,770.57 | flat | (12.0)% | down | down | up | |
| S&P/TSX Composite | 21,222.84 | 20,741.75 | 0.6% | (2.3)% | down | neutral | up | |
| S&P/TSX Venture (CDNX) | 939.18 | 838.33 | (2.1)% | (10.7)% | down | down | up | |
| S&P 600 | 1,401.71 | 1,271.86 | (0.8)% | (9.3)% | down | down | up | |
| MSCI World Index | 2,354.17 | 2,229.22 | (4.9)% | (5.3)% | down | down | up | |
| NYSE Bitcoin Index | 47,907.71 | 37,114.55 | (4.4)% | (22.5)% | down | down | up | |
| Gold Mining Stock Indices | ||||||||
| Gold Bugs Index (HUI) | 258.87 | 240.19 | (6.3)% | (7.2)% | down | down | neutral | |
| TSX Gold Index (TGD) | 292.16 | 274.11 | (4.3)% | (6.2)% | down | down | neutral | |
| Fixed Income Yields/Spreads | ||||||||
| U.S. 10-Year Treasury Bond yield | 1.52% | 1.78% | 0.6% | 17.1% | ||||
| Cdn. 10-Year Bond CGB yield | 1.43% | 1.77% | (1.1)% | 23.8% | ||||
| Recession Watch Spreads | ||||||||
| U.S. 2-year 10-year Treasury spread | 0.79% | 0.61% | (17.6)% | (22.8)% | ||||
| Cdn 2-year 10-year CGB spread | 0.48% | 0.51% | (5.6)% | 6.3% | ||||
| Currencies | ||||||||
| US$ Index | 95.59 | 97.27 | 1.7% | 1.3% | up | up | up (weak) | |
| Canadian $ | .7905 | 0.7820 | (1.7)% | (1.1)% | down (weak) | down | up | |
| Euro | 113.74 | 111.49 | (1.7)% | (2.0)% | down | down | down (weak) | |
| Swiss Franc | 109.77 | 107.39 | (2.1)% | (2.2)% | down | down | up (weak) | |
| British Pound | 135.45 | 133.94 | (1.2)% | (1.1)% | neutral | down | up | |
| Japanese Yen | 86.85 | 86.79 | (1.4)% | (0.1)% | down | down | down | |
| Precious Metals | ||||||||
| Gold | 1,828.60 | 1,786.60 | (2.5)% | (2.3)% | down | neutral | up | |
| Silver | 23.35 | 22.30 | (8.3)% | (4.5)% | down | down | up (weak) | |
| Platinum | 966.20 | 1,006.60 | (2.8)% | 4.2% | up | neutral | up (weak) | |
| Base Metals | ||||||||
| Palladium | 1,912.10 | 2,375.30 | 12.9% | 24.2% | up | neutral | up (weak) | |
| Copper | 4.46 | 4.31 | (4.7)% | (3.5)% | down (weak) | neutral | up | |
| Energy | ||||||||
| WTI Oil | 75.21 | 86.82 | 2.0% | 15.4% | up | up | up | |
| Natural Gas | 3.73 | 4.64 | 22.8% | 24.4% | up | neutral | up | |
New highs/lows refer to new 52-week highs/lows and, in some cases, all-time highs.
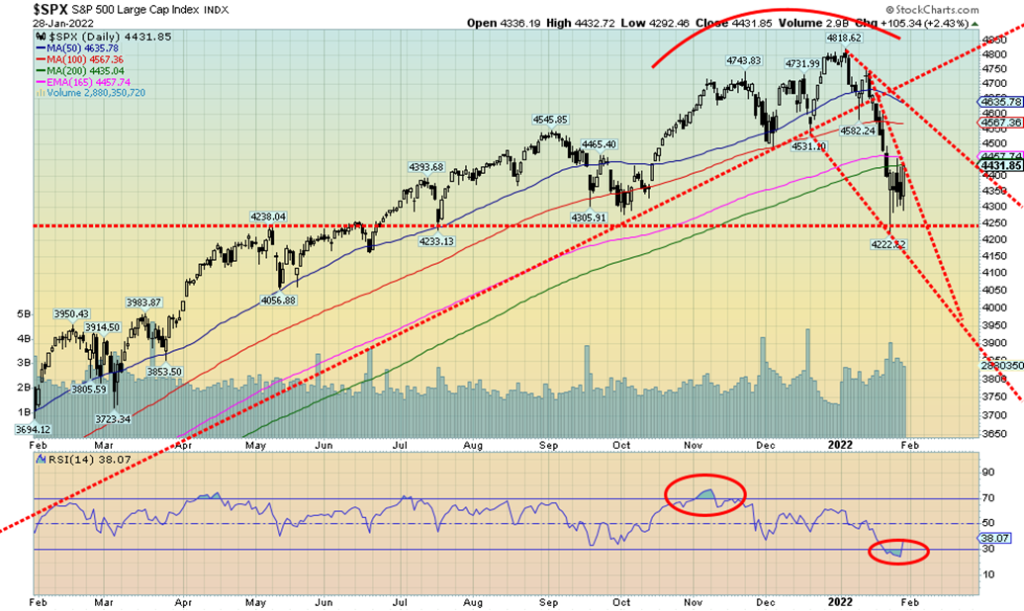
We are off to a poor start for the year. As we noted earlier, the S&P 500 is down 7.0% so far in 2022, shy of the record 8.6% drop seen in January 2009. The rebound Friday of 0.8% helped push the S&P 500 back off the lows. At the recent low the S&P 500 was down 12.4% from the high seen on January 4, 2022. As we noted in an earlier piece, this reminds us of the “Nifty Fifty” rally of 1972 that topped on January 11, 1973. Over the next two years the S&P 500 fell 48.2%. In 1972 it was the “Nifty Fifty.” In 2021 you could say it was the Miracle Four high-tech stocks.
It was an up week for the most part. The Dow Jones Industrials (DJI) gained 1.3%, but the Dow Jones Transportations (DJT) fell 1.3% continuing to diverge from the DJI. The NASDAQ was flat. The small-cap S&P 600 fell 0.8% while the mid-cap S&P 400 was down 0.6%. The large-cap 100 Index (OEX) gained 1.4%. All that continues to suggest to us that value is being purchased overgrowth. In Canada, the TSX Composite gained 0.6% but the TSX Venture Exchange (CDNX) dropped 2.1%. In the eurozone, the London FTSE was up a small 0.1% but the Paris CAC 40 dropped 1.5% and the German DAX was off 1.8%. In Asia, China’s Shanghai Index (SSEC) was down 4.6% and the Tokyo Nikkei Dow (TKN) dropped 2.9%. The MSCI World Index was down 4.9%. Bitcoin continued its woes along with the cryptos, falling 4.4%. They are now down 22.5%, officially signaling that Bitcoin is in a bear market.
The rebound this week appears to us as a wave 4 rebound. That suggests to us that there is a fifth wave down to come. The bottom of the channel is way down near 4,100 currently. A potential target for wave 5 is around
4,100 to 4,200. If this is a larger wave 1 or wave A down as we suspect, once we make this low we should embark on an up wave – wave 2 or B. That would be followed by another down wave and the potential for a low sometime in March to complete an ABC pattern. Since this wave down appears impulsive, even completing that first ABC wave would not mean the end of a potential bear market. We’d be looking for more a 2000–2002 scenario which was a monster ABC pattern. So was the 2007–2009 bear.
The big dangers, of course, are the Russia/Ukraine/U.S. conflict, the hawkish Fed, and the potential for a slowing U.S. economy of which we are seeing early signs. The Russia/Ukraine/U.S. conflict is somewhat strange in that the U.S., with the cooperation of the Germans (doubtful?), wants to cut off Nord Stream 2 and possibly kick Russia out of SWIFT. As one pundit described it, that is akin to the U.S. and the EU holding a gun to their own head à la Blazing Saddles and threatening to shoot themselves. Germany and much of the EU are highly dependent on Russian gas. The threats could see the EU cut off from Russian gas and a consequential negative impact on their economy. It is difficult for the EU to get supplies elsewhere as that has to be carried by ship. Ships are also vulnerable to attack. Pipelines from the Middle East are either incomplete or non-existent.
The S&P 500 has resistance up to 4,500 and further up to 4,600–4,650. A move above 4,750 would signal that the mini-bear is over. At this stage that is not expected. A close Monday under 4,000 would be quite negative (note: not expected). But even a close under 4,200 could be negative.
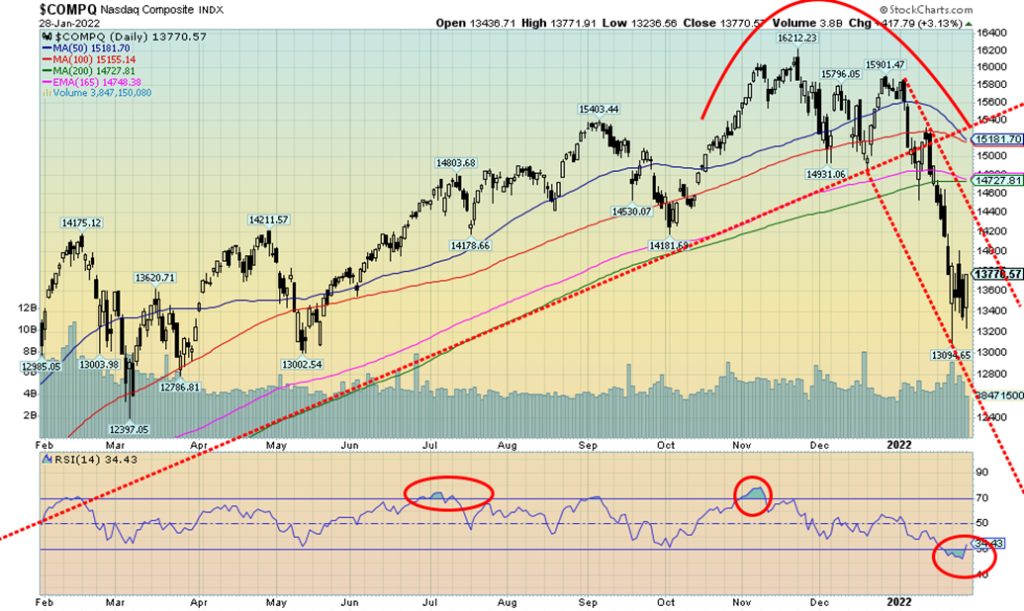
The NASDAQ appears to be on track for its worst January ever. The NASDAQ was flat this past week but remains down 12.0% so far in January with only Monday to go. Leading the way into the abyss has been the technology stock that took the market to new heights. While many of the FAANGs had a rebound week, some didn’t. Meta (Facebook) was down 0.4%, but Apple gained 4.9% and was one of the big winners. Amazon was up 0.9%, Netflix continues to suffer, down another 3.3% and 36.2% in January, Google gained 2.5%. Others saw Microsoft up 4.1% and Twitter gaining 1.3%. But Tesla took it on the chin, down 10.4%, and was a big loser. The Chinese techs fell as Baidu was off 6.6% and Alibaba dropped 6.5%. Rounding out the FAANGs was Nvidia, down 2.2%. None of them are in the black for January. A big winner was value with Berkshire Hathaway up 2.2% this past week and up 4.1% so far in January.
The NASDAQ saw its RSI fall into oversold territory but, so far, this is nothing but a bounce and does not yet suggest that a low has been made. The top of that bear channel is up around 14,200. The bottom of the channel may be more enticing and that is down near 12,800. The NASDAQ has fallen firmly into correction territory (i.e., more than 10% down from the high) but is still not in bear territory (down 20%+ from the high). At its recent low the NASDAQ was down 19.2%. The NASDAQ needs to regain back above 15,200 to suggest to us that low could be in. This has been a steep drop and it is going to take some time to repair. This current rebound appears to us a probable wave 4 with a fifth wave down to come, targeting potentially down to 12,400.
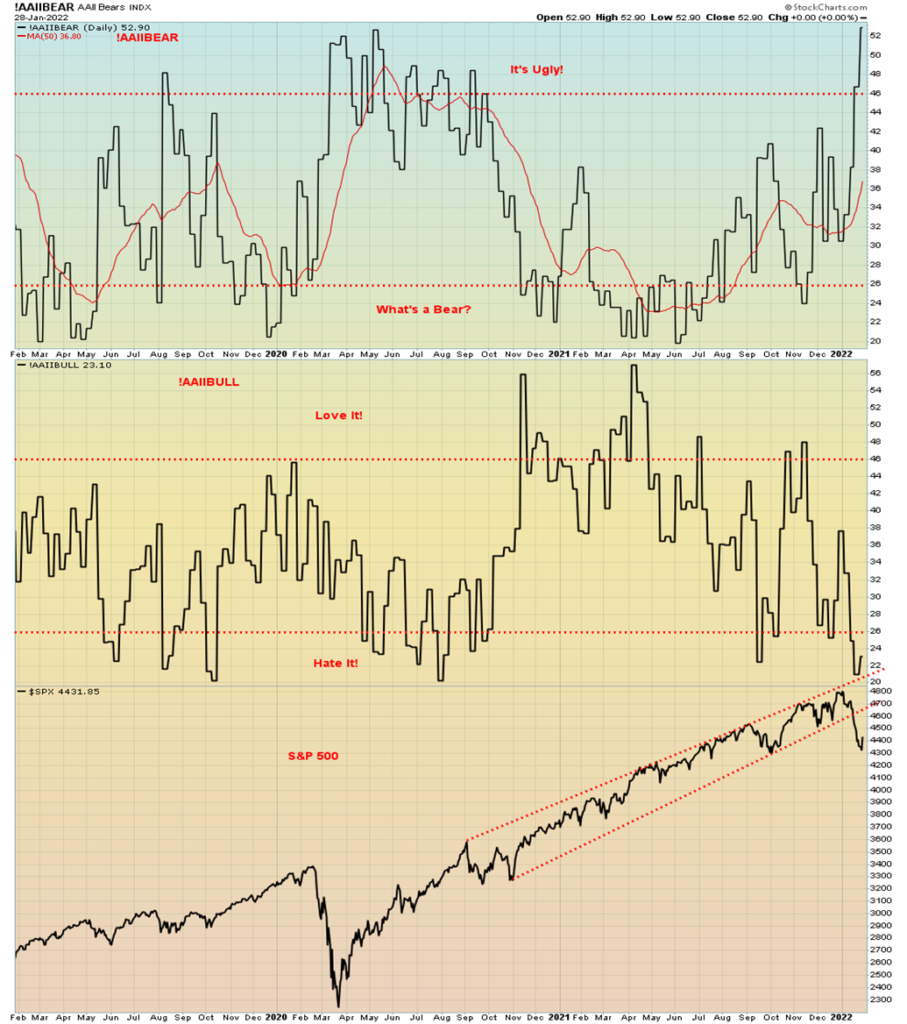
The chart was so big our comment is on this page. Above is the All-Bears Index (!AAIIBEAR) and the All-Bulls Index (!AAIIBULL), along with the S&P 500. The Bear’s Index is firmly into ugly territory and the Bull’s Index is firmly into hate-it territory. These are sentiment indices, which measure how bearish or bullish the market is. Both are now into territory that suggests we could see a rebound. But we may not be quite bearish enough just yet. The CBOE put/call ratio is at 0.72, still below the 0.80 or higher we usually see when the market is making a low. The S&P 500 Bullish Percent Index is at 36.80. It’s in bear territory but has considerable room to move lower. Only 16% of NASDAQ stocks are trading above the 200-day MA and 45% of S&P 500 stocks are above the 200-day MA. The NASDAQ is in correction territory but the S&P 500 is still not there yet. The number of stocks above the 200-day MA for the S&P 500 has to fall under 30% to get into bear territory. The heavily watched NYSE advance-decline line is making new lows with the S&P 500 so no divergences there yet. So, the All-Bears and All-Bulls Indices are showing extremes but others aren’t quite there yet. The result is we are getting oversold and bearish here but we may have a bit lower to go before we find at least our first good low.
Michigan Consumer Sentiment, Michigan Current Economic Conditions 1952–2022
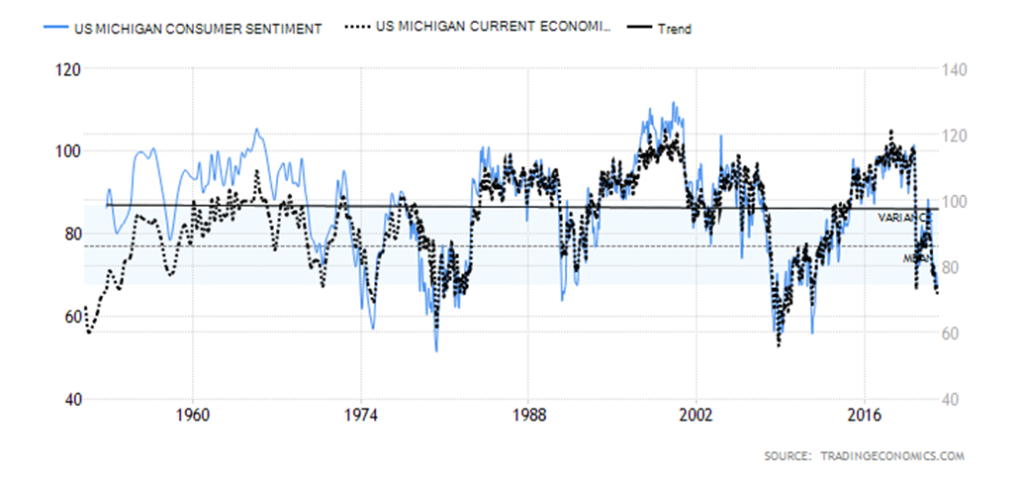
If things were really as good as some like to say, then why is consumer confidence sinking? The Michigan Consumer Confidence Index sunk to 67.2 for January. It’s the lowest level since November 2011. Current conditions and expectations were also revised lower with expectations included above down to 64.1. Confidence in government policies is down, concern over the Omicron is up, and concern about inflation is up, with the three leading the way in the sinking confidence. The Fed is even being viewed as a part of the problem. Not a great endorsement. One difference to note with 2011 is that consumer confidence was improving coming out of the Great Recession. This time it is sinking. We’d have to look back past the period of the Great Recession which sent consumer confidence down to the mid-1970s into the early 1980s to find such low consumer confidence as we appear to be experiencing now. The lowest ever recorded was 51.7 in the early 1980s.
Personal Income and Spending 2017–2022
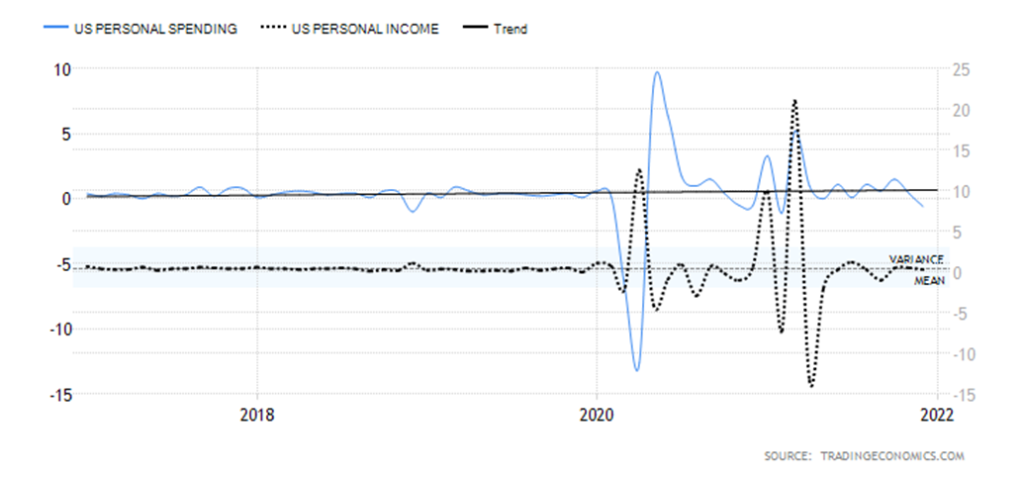
Personal spending sunk in December 2021 by 0.6%. Forecasts had been for a drop of 0.3% with some economists expecting the 0.6% decline. Not a good sign going into January, traditionally a slow month. On the other hand, personal income rose 0.3%, but that was below the consensus 0.5% gain. The biggest drop was for goods such as recreational vehicles and vehicles. It’s no surprise then that durable goods orders fell 0.9% in December, well below the expected 0.2% decline. Services increased, primarily health care. Given the increase in income and decline in spending it was no surprise to discover that personal savings increased 7.9% in December, up from 7.2% in November. Again, this is a sign of a potentially slowing economy, not one that is robust. GDP expanded 5.5% in Q4 over the same quarter a year earlier. Expect the Q1 growth figure to come in lower. The biggest drop was recorded at the height of the COVID recession. Q2 2020 GDP fell 9.1%, the highest level recorded since 1950.
U.S. New Home Sales, Existing Home Sales 1997–2022
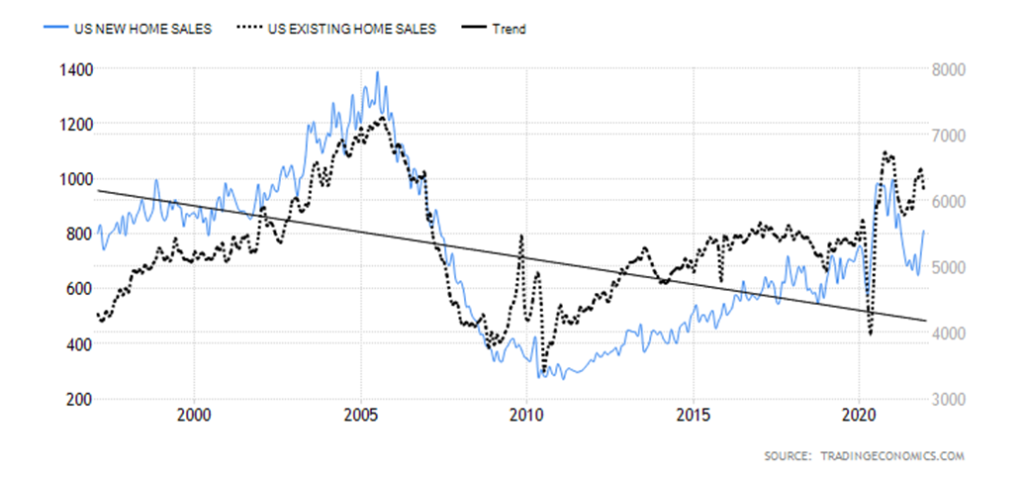
New home sales rose 11.9% from a month earlier to 811 thousand units. But existing home sales fell 4.6%. Pending home sales were also down 3.8%. Note how home sales, both new and existing, remain well down from the levels seen back in 2006 at the height of the housing bubble. None of that has stopped housing prices from rising as the most recent house price index rose 1.1% last in November and year-over-year (y-o-y) house prices were up 17.5%. The Case Shiller home price y-o-y was up 18.3%. Existing home sales are turning down at a lower level from a peak seen in 2021. Meanwhile, new home sales are rising from a recent trough seen in October 2021.
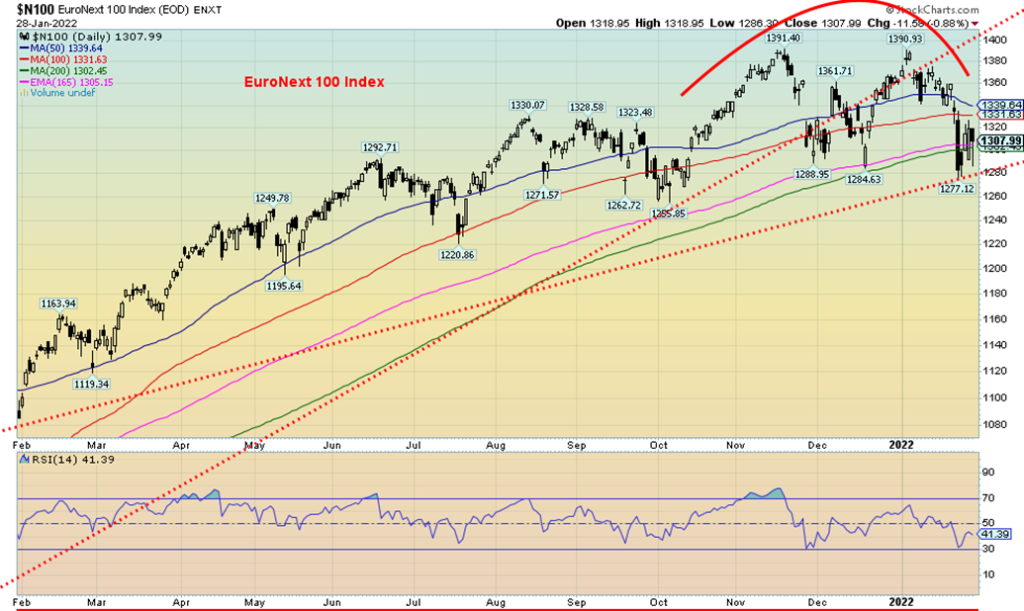
Will it break down? Or will it recover? That is the question. The EuroNext 100 Index appears poised to break down under what appears as a double top pattern. The EuroNext has already broken under the uptrend line from the March 2020 crash low. Up next is support at 1,280 and what could be the neckline of the double top. A firm breakdown under 1,280 could target down to 1,165, an 11% decline from current levels. Concern, of course, is rising about the Russia/Ukraine/U.S. conflict that could result in war. Only regaining above 1,360 could end the bearish scenario.
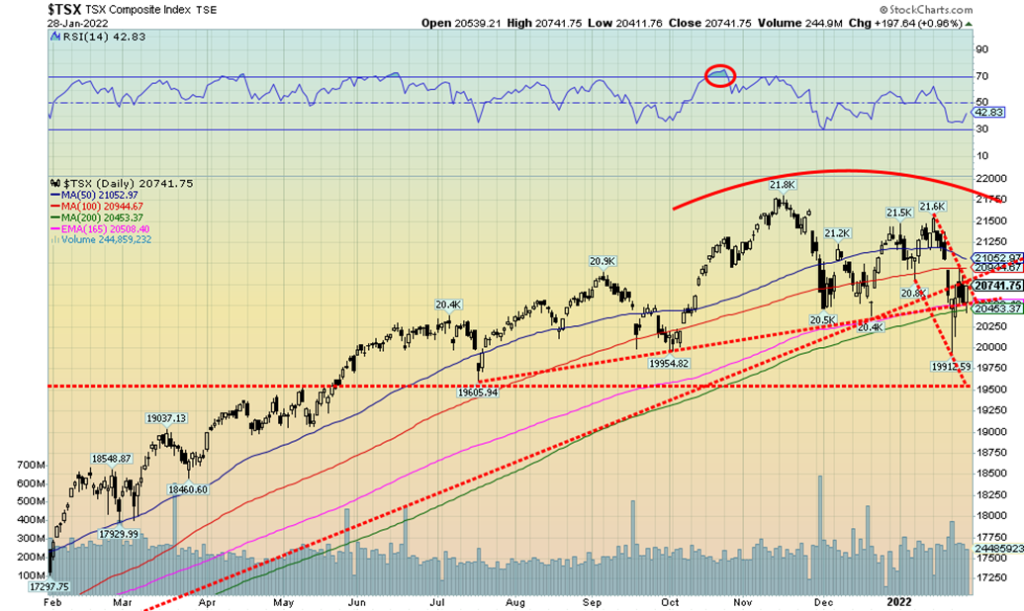
The TSX Composite joined the party this past week following the lousy start, closing the week up 0.6%. The TSX remains down on the year by 2.3%. The small-cap TSX Venture Exchange (CDNX) didn’t fare as well, falling 2.1% and is now down 10.7% in January. The good news for the TSX is that, after hitting a low of 19,912, it is now up 4.1%. Five of the 14 sub-indices closed down on the week, led by Golds (TGD) down 4.3%. Metals & Mining (TGM) lost 3.3% and Materials (TMT) fell 3.2%. The other two losers were Health Care (THC) -1.7% and Industrials (TIN) -0.2%. Leading the way to the upside was Energy (TEN), up 4.3%. Other big winners were Consumer Staples (TCS), up 3.9%, and Telecommunications (TTS), up 2.7%. Information Technology (TTK) gained 1.1% but has been the worst performer on the TSX, down 16.3% in January. The TSX plunged under the 200-day MA this past week; however, the rebound only took the TSX back to the 100-day MA before it settled back. It is possible the TSX has now set up a bear channel. Major support is down to 19,500. A breakdown under that level could spark a panic. Potential targets are 18,300 based on the breakdown from the topping pattern when the TSX broke under 20,500. Only regaining back above 21,000 and preferably over 21,500 could eliminate the bearish scenario.
U.S. 10-year Treasury Bond/Canadian 10-year Government Bond (CGB)
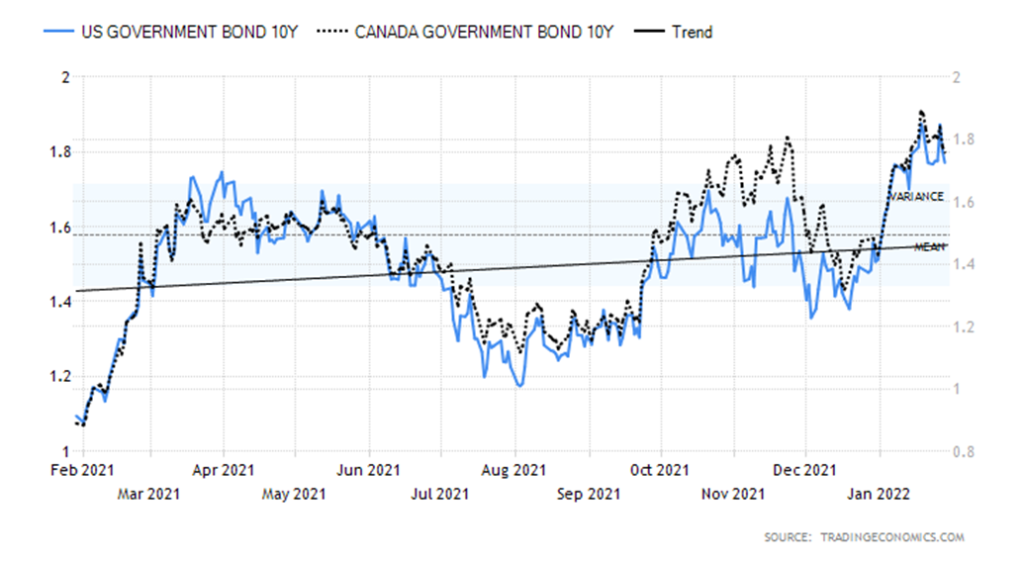
Are bond yields going to go higher? Or are they going to go lower? The bond bears have yields going higher because of inflation. But the bond bulls have yields falling as it becomes obvious the economy is slowing and hiking interest rates is the kiss of death. So, this week we had the double whammy as the U.S. 10-year treasury was up only a small 1 bp to 1.78% while the 2-year treasury note jumped to 1.17%, up from 1.02% the previous week. As a result, the 2–10 spread narrowed to 61 bp, its lowest level in some time. Our other closely watched spread, the 3-month treasury bill vs. the 10-year note, fell to 1.58% as the 3-month jumped to 0.20%, up from 0.11% the previous week. At year end the 3-month was trading at 0.06%. A series of weaker economic numbers, as we outlined earlier, helped push down the 10-year. It is not that traders expect inflation to moderate anytime soon, but they are looking ahead and what they see is a slowing economy—thus, lower yields. The weak stock market is also helping lower the 10-year as when the stock market falls, bonds rise (prices rise inversely to yields). Short rates are being pushed up on the expectation the Fed will hike rates in 2022 at least three times (many expect four times and some are pricing in five times). Are they getting ahead of themselves? Irrespective of this, negative yields (actual yield less the inflation rate) have never been so high as they are now. Hiking interest rates would help narrow that spread.
This coming week is the January job numbers. The market is looking for a nonfarm payroll gain of 155,000, down from the 199,000 reported for December. The unemployment rate (U3) is expected to remain at 3.9%. Canada also reports its January job numbers and they expect a loss of 125,000 jobs because of the Omicron.
The unemployment rate could jump to 6.2% from 5.9%. Keep in mind that Canada’s participation rate is a lot higher than the U.S. (65.3% vs. 61.9%) and that results in a higher unemployment rate. In the U.S., the weekly jobless claims came in at 260,000 which was largely as expected. The previous week saw 290,000 claims so the drop was welcome.
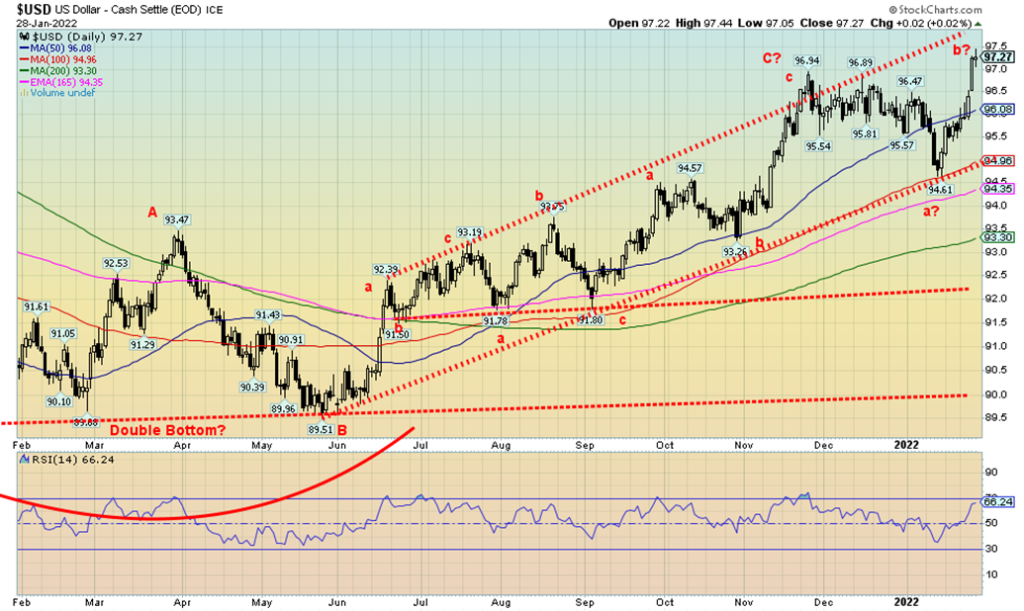
The U.S. dollar is the star. The US$ Index jumped 1.7% this past week as a hawkish Fed, good Q4 GDP numbers, and the ongoing conflict between Russia/Ukraine/U.S. made EU investors nervous and they jumped over to U.S. dollars. The euro took it on the chin, falling 1.7%, the Swiss franc was hurt even more, down 2.1%, while the pound sterling dropped 1.2% and the Japanese yen fell 1.4%. The Canadian dollar fell 1.7% despite higher oil and gas prices. The top of the bull channel is up near 97.80 so there is potential for further gains. Still, we continue to believe that the pattern up from the May low of 89.51 was a corrective pattern given it unfolded in a series of abcs (called zigzags). What we could be seeing is a 2 wave or b wave to the upside following the first downside break that bottomed at 94.61 earlier this month. If this is correct, then the US$ Index should soon start a downward move. Support is seen first at 96, then down to 95. Below 95 there is support at 94.35 and 93.30 before hitting final trendline support just above 92. A firm breakdown under 92 could start a sharper move to the downside.
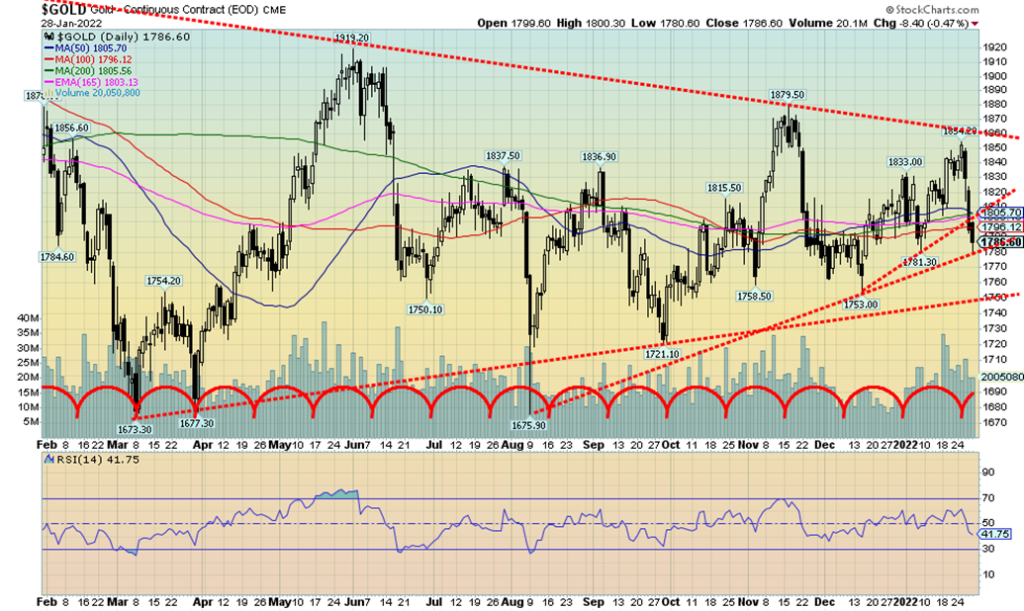
The gold bugs are not happy. Another weekly drop will do that to them. Gold fell 2.5% this past week due to strong U.S. dollar buying as a result of funds fleeing the EU and a hawkish Fed helping to push the US$ Index up over 97. Adding to the woes were the Q4 GDP numbers showing a strong (or strengthening) U.S. economy. However, as we have noted, going forward things may not be so rosy. In the meantime, all this lessens gold’s role as a safe haven. Silver was “whacked” even harder, falling 8.3%. Platinum dropped 2.8%. Looking down the road, though, the metals fell because of fears of a slowdown. Copper dropped 4.7%. But palladium soared 12.9% because of the Russia/Ukraine/U.S. conflict. Russia is the world’s largest producer of palladium, used extensively in automobile manufacturing. For gold, a weakening economy might be a godsend if it weakens the U.S. dollar.
Gold tested down to our support line, currently near $1,780 this past week (low was $1,780.60). A break under that level would be negative and it would be confirmed with a break and close under $1,770. That, in turn, could set up lower prices to test the December low of $1,753 and then the September low of $1,721. A firm breakdown under $1,750 could set up even lower prices with potential down to $1,550. A rebound now that fails between $1,800 and $1,820 would be quite negative. We need to regain back above $1,820 once again to suggest another test of the $1,850/$1,860 major resistance line. There is further resistance above at $1,880 and $1,900/$1,920. Only above $1,935 do we see bluer skies. None of this scenario will sit too well with the gold bugs, many of them calling for an explosive move to the upside. Yes, it could happen but we need to break up through all those resistance points first. Then one can talk about a stronger up move.
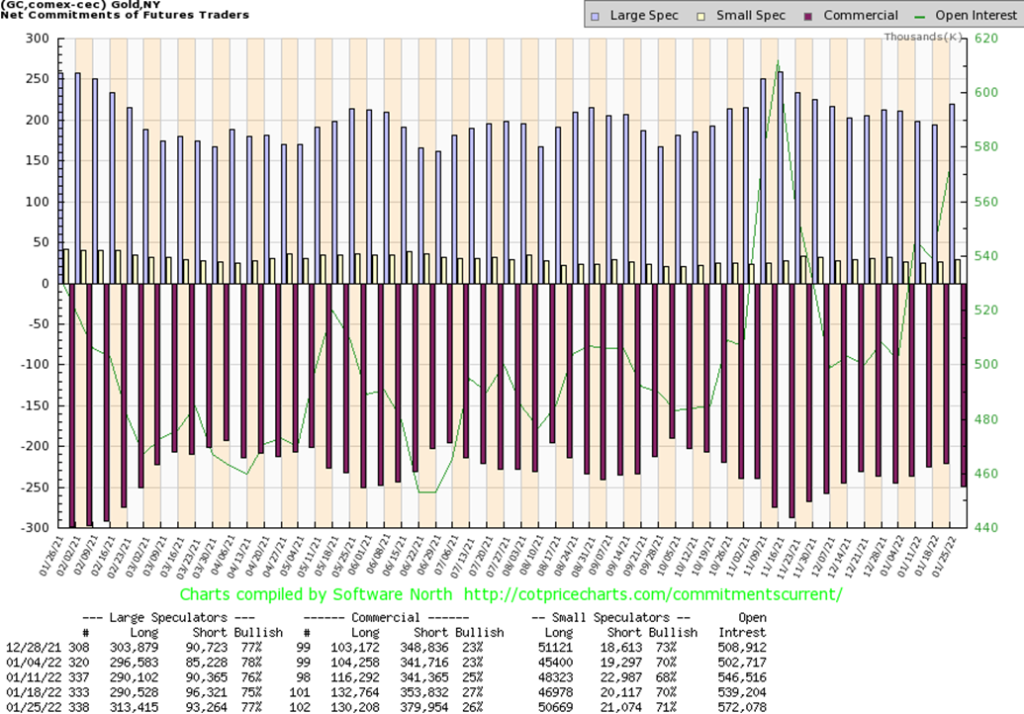
The gold commercial COT (bullion companies and banks) slipped to 26% this past week from 27%. While long open interest fell just over 2,000 contracts, short open interest jumped 26,000 contracts. Overall open interest jumped about 33,000 contracts in a down week. The large speculators COT (hedge funds, managed futures, etc.) rose to 77% from 75% as they added roughly 23,000 contracts to long open interest while slashing roughly 3,000 contracts from short open interest. We have to view this report as at least mildly negative, given the recent action this past week for gold.
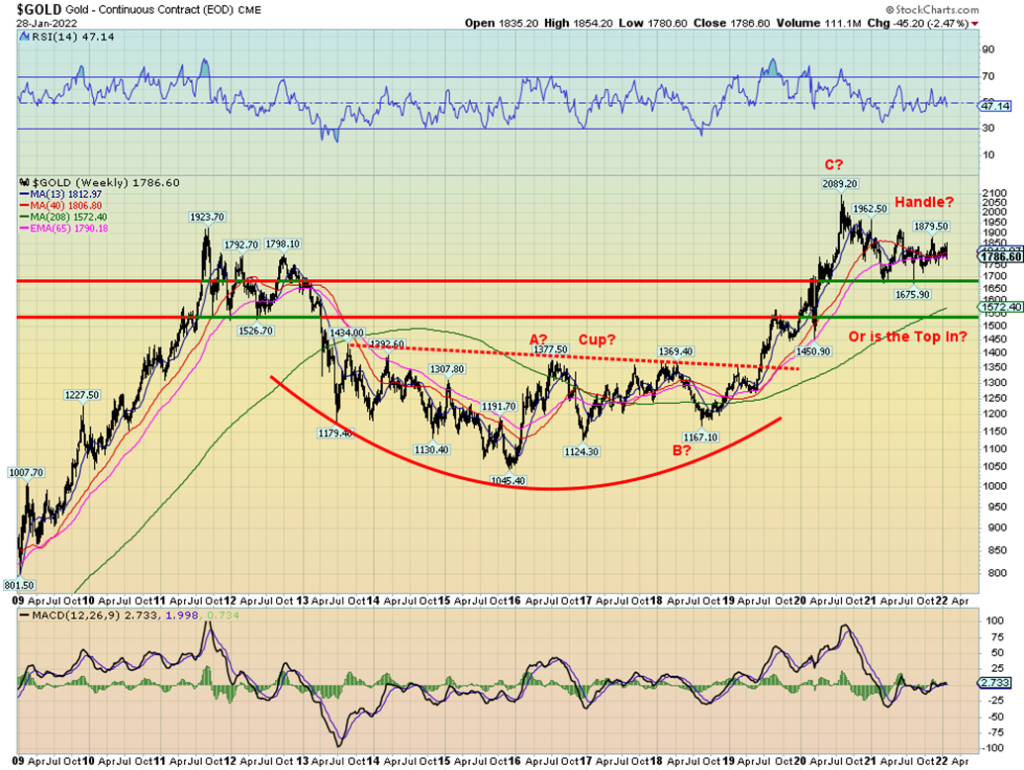
The gold bulls continue to note and are being buoyed by what appears to be a huge cup and handle formation on the gold chart that formed between 2011 and 2020. Since the top in August 2020, we have been forming what many believe to be the handle of the formation. If correct, this is quite bullish and a firm breakout above $1,850/$1,860 could potentially project gold to $2,200/$2,300 as a minimum. Ultimate targets could be up to $2,900. But as usual, we like to have our caveat in place just in case things don’t go as planned. That’s why we are concerned about the entire level between $1,675 the August 2021 low and $1,700. If that level were to give away instead of looking at a run to $2,300, we could be looking at a collapse to $1,260. No, that wouldn’t occur overnight but could take several months to play itself out. We have noted the potential for the 7.83-year cycle low and the 23.5-year cycle low that could be seen as early as late 2022 although better due in 2023–2024. The gold bulls would not be expecting that. This helps explain our concerns about this current move. However, if the cup and handle holds true, the run-up this time would be a final top before the collapse into the 7.83-year and the 23.5-year cycle lows.
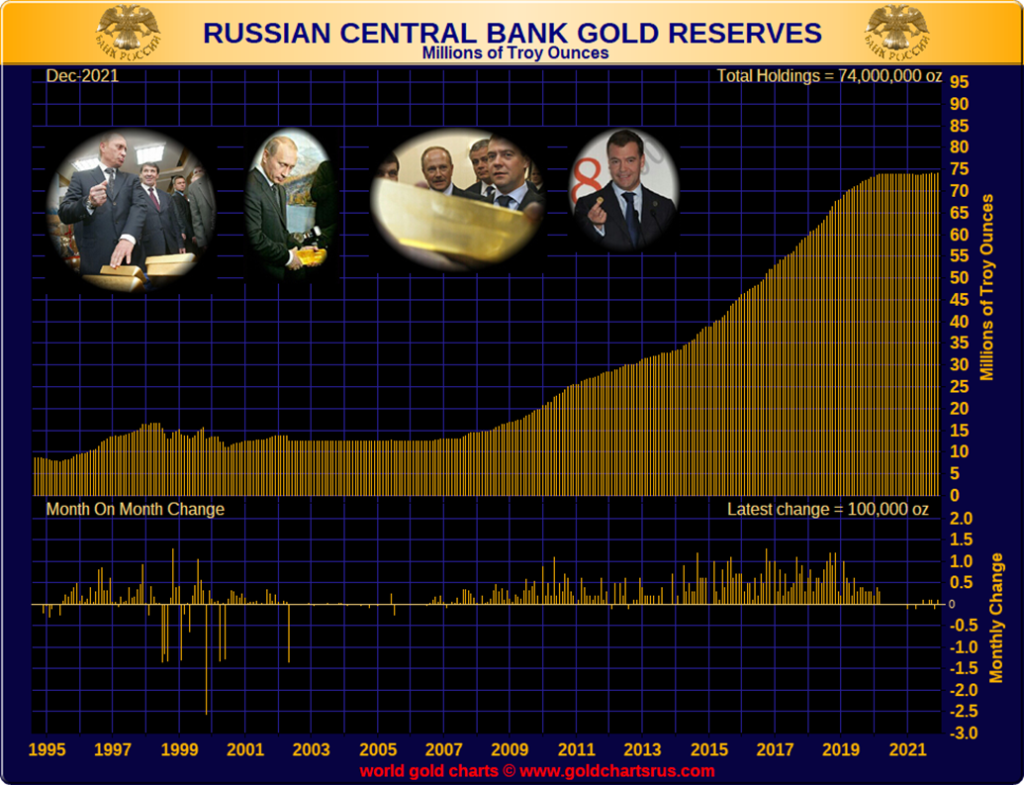
Over the past number of years, Russia has been building its international reserves, including its gold reserves. They have been shedding their reserves of U.S. dollars, replacing them with gold and Chinese yuan securities. The purpose is to divest themselves of U.S. dollars so as not be held hostage using the U.S. dollar as their major reserve holdings. Given high oil and gas prices, Russia has been able to divert billions to building their reserve war chest including reserves of gold.
According to data, the Bank of Russia (BOR) Russia’s international reserves hit $639.6 billion this past week. Overall, Russia’s foreign reserves are held in foreign currency funds, special drawing rights in the IMF, and gold. Russia’s official reserves are now the fourth largest in the world, behind China ($3.2 trillion), Japan ($1.4 trillion), and Switzerland ($1.1 trillion). The U.S. is well down the list at $251.8 billion as of January 21, 2022. However, that is a bit misleading as the U.S. is still carrying the world’s largest gold reserves of 261.499 million ounces on its books at $42.22. Valued at $1,800, the U.S.’s international reserves would jump to $711.5 billion and the U.S. would jump to fourth place, replacing Russia.
The BOR is holding an estimated 74.0 million ounces of gold (2,298.3 metric tonnes) which at $1,800 would be $133.2 billion. The U.S. has the world’s largest holding of gold reserves, followed by Germany, Italy, France, and then Russia and China. The IMF itself would be in the top five, given they hold 90.5 million ounces of gold. Canada sold its gold reserves back in 2016. For those interested, here is an article on Canada selling its gold reserves written back in March 2016 by the author while at Bullion Management Group: www.bmg-group.com. https://bmg-group.com/wp-content/uploads/2016/03/And-Then-There-Was-None-Canada-Sells-Its-Gold-2016.03.09-1.pdf
Russia also has the world’s second-largest reserves of gold mining reserves behind Australia with an estimated 5,300 metric tonnes. The world’s central bank gold reserves are estimated at 35,571.3 metric tonnes according to the World Gold Council (www.gold.org). Russia’s national debt is estimated at $296 billion which would give them a debt/GDP ratio of about 17.7%. Compare that to the U.S.’s national debt/GDP at 127.5%.
World gold reserves held by the central banks are shown by the World Gold Council to be 35,571.3 metric tonnes, the highest level seen since the 1960s. The increase in central bank gold reserves started to rise from a trough that was seen in 2009 when reserves hit bottom at 29,964 metric tonnes. As we have often noted, if gold is such a barbarous relic and not money, then why have the world’s central banks increased their gold reserves by 5,600 metric tonnes since 2009? Gold is also now classified as a Tier 1 asset for commercial banks under the Basel III accords since 2017. Gold has a zero-risk weighting.
Yet gold remains unloved and under owned.
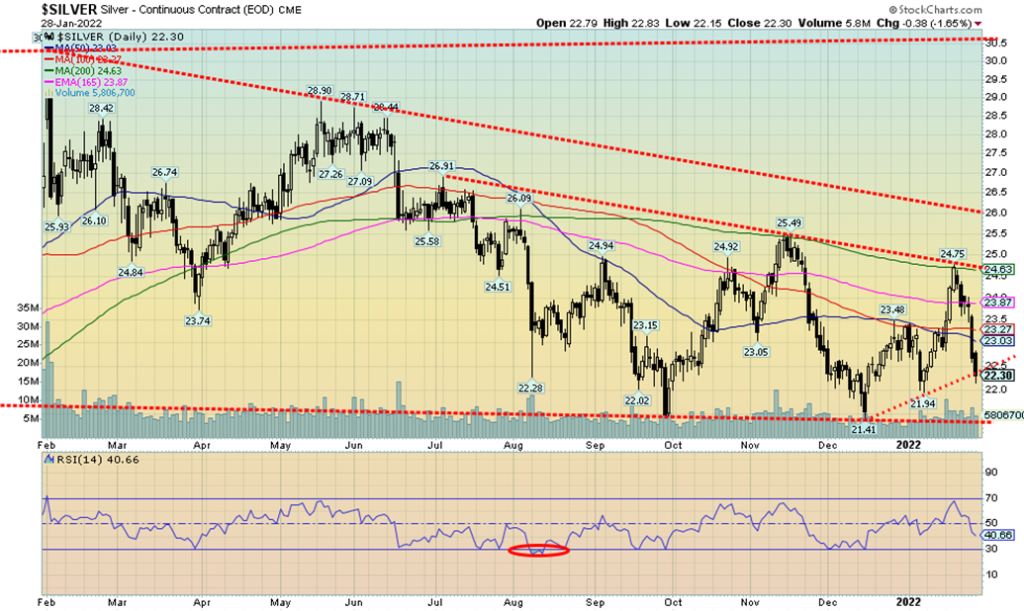
Silver had a miserable week, falling 8.3% and leading the way down for the precious metals. If there is any good news, it is that silver tested the uptrend line from the December low of $21.41. The trouble is, silver closed just on or just below the line and it could set up further losses this coming week. A breakdown under $22 would set up new lows below $21.41. Prices have now fallen over 10% in just six trading days. Elliott Wave International (www.elliottwave.com) believes it is an impulse wave and that prices are going lower with potential targets down to $17. One could argue that the formation over the past several months following the May top is a descending triangle (a triangle formation of descending lower highs and relatively flat lows) with ultimate targets even lower, down to $14. At this point, only new highs above the recent high of $24.75 could keep the bulls alive. Preferably silver also takes out the November high of $25.49 as well as confirming that a low is in.
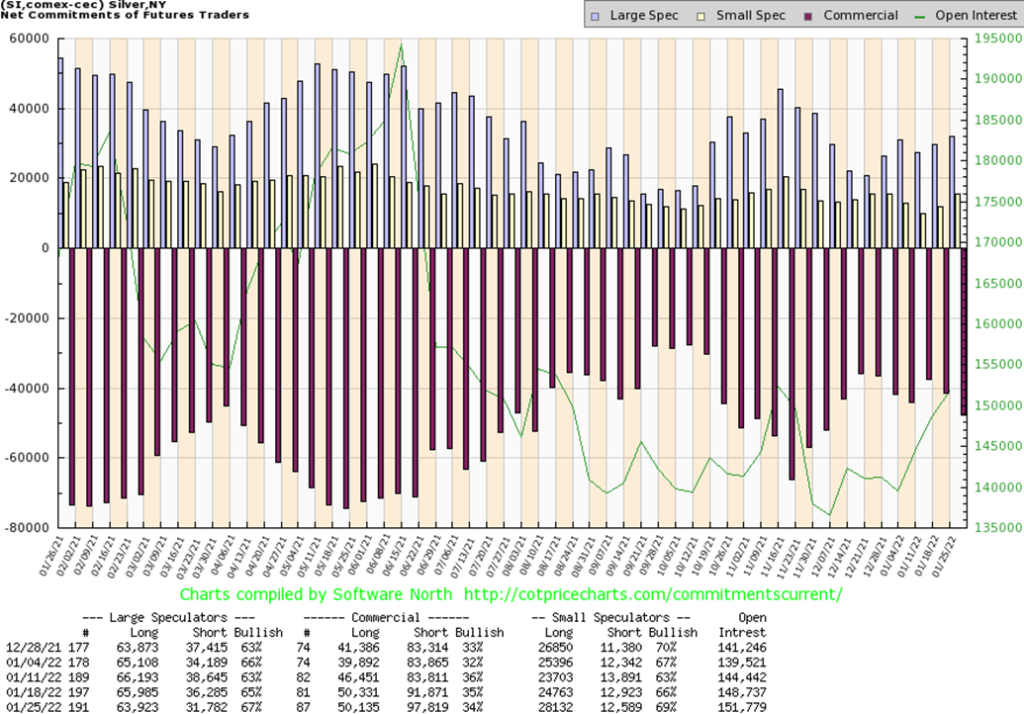
The silver commercial COT slipped to 34% from 35% this past week. Long open interest was largely unchanged while short open interest rose roughly 6,000 contracts. The large speculators COT rose to 67% from 65% as they largely slashed their short open interest position. Total open interest was up roughly 2,000 contracts. As with the gold COT, we view this as at least mildly negative. We remain well off the lows seen back in November 2021.
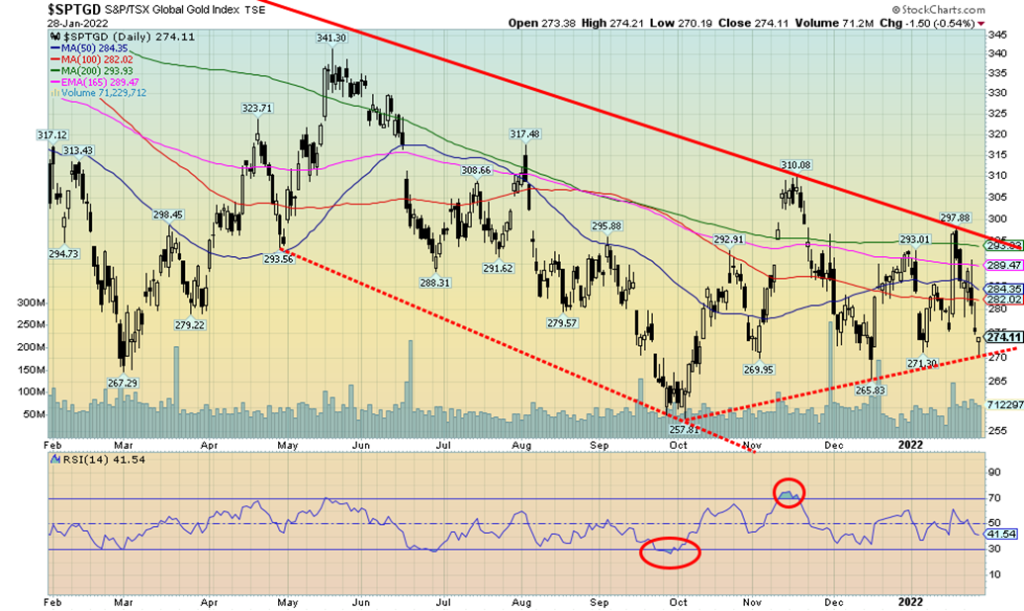
The gold stocks get no respect. With respect to gold, gold stocks are cheap. The Gold/HUI ratio is at 7.44, well-entrenched at levels suggesting to us that gold stocks remain cheap relative to gold. This past week the gold stocks were hammered, down as the TSX Gold Index (TGD) fell 4.3% and the Gold Bugs Index (HUI) dropped 6.3%. The TGD fell to its lowest level since the December low of 271.30. The low this week was 270.19. We remain above the early October low of 257.81. But the level hit was a line of defense at 270 that we had previously noted. The good news is that TGD rallied back on Friday but still closed down 0.5% on the day.
The rebound back on Friday left a potential hammer on the chart. The hammer is a Japanese candlestick pattern that is formed when there is long lower shadow and a small white (or black) body at the top of the day’s trading range. It signifies that the market opened and then plunged, but rebounded back to close just above or below the opening levels and close to the highs of the day. The hammer frequently follows a steep decline and it is noted the TGD fell a sharp 9.3% in just seven trading days. The hammer is seen only at bottoms. With that bit of encouragement, we would, of course, need to see follow-through to the upside this coming week.
Support continues at 270 while the resistance is well-defined, ranging from 280 up to 295. To be on the safe side, we would only consider the market is breaking out with solid closes over 300.
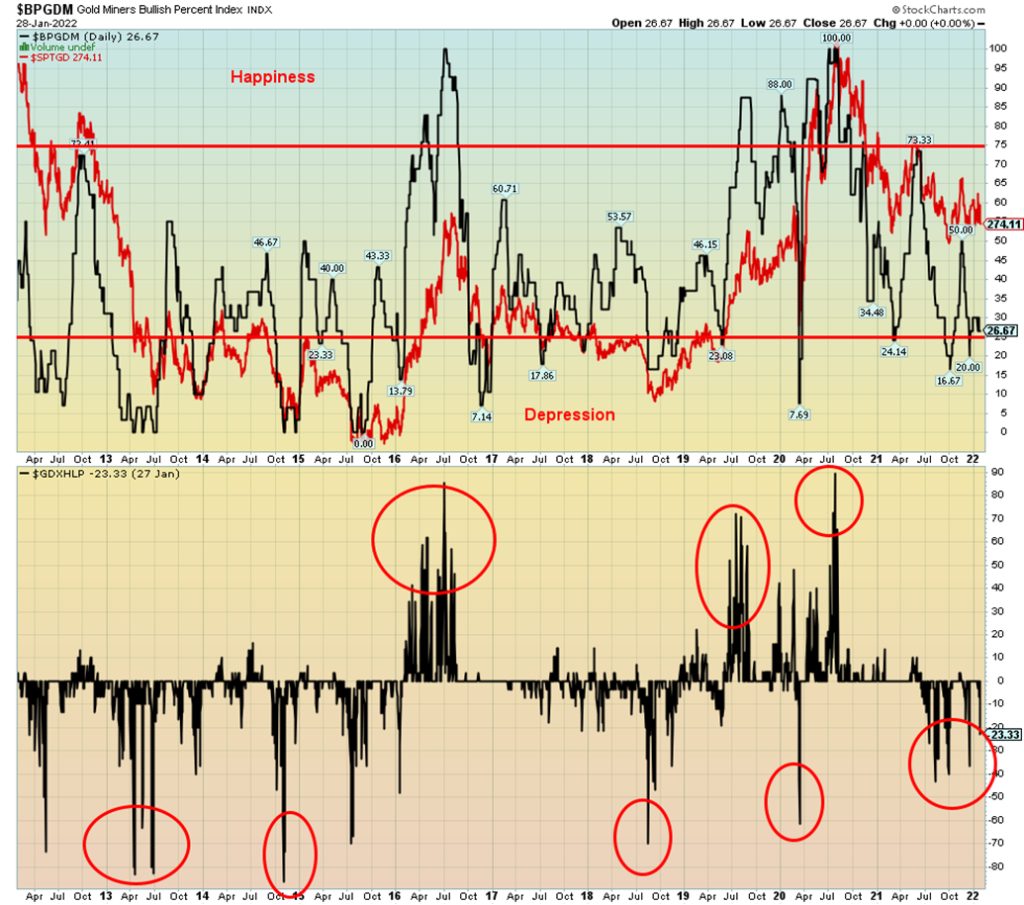
Sentiment towards the gold miners remains in a deep funk. No, it is nowhere near levels seen in 2015 or during the March 2020 COVID crash. But at 26.67, the Gold Miners Bullish Percent Index (BPGDM) remains near its lowest levels seen over the past year. There was a brief bit of euphoria in November that took the index to 50%, but that level could not be held and sentiment sank again as the market sold off. The Gold Miners New Highs-New Lows Percent Index (GDXHLP) also continues to hover in negative territory with new lows outpacing new highs. The new lows are highlighted by the recent collapse of Gatos Silver (GATO/TSX) when it reported that its numbers had been overstated. With the BPGDM hovering near lows it tells us that there is not a lot of bullishness out there, but the index is not at such low levels that it is potentially a low-risk buy.
Oil prices continue to firm up as geopolitical concerns rise and inventories fall. WTI oil rose almost 2% this past week, closing at $86.82. Brent crude closed at $90.54, up 3.0% on the week. Natural gas (NG) prices soared 22.8% with fears of price spikes as a result of colder weather in the U.S. and supply concerns in Europe due to the Russia/Ukraine/U.S. conflict. NG saw a huge surge just before the expiring February futures contract. It was sharpest one-day surge ever seen since the contract came into being in 1990 on the CME. Falling inventories are helping to drive oil forecasts that suggest that we could soon see $100/barrel oil as many are forecasting. For Brent, it was the first time in seven years that prices soared past $90.
Coal prices have also surged past $260/metric tonnes, again largely because of the Russia/Ukraine/U.S. conflict. If gas supplies were cut, coal demand and prices could soar. It is not a good time to be needing fuel for homes, cars, etc.
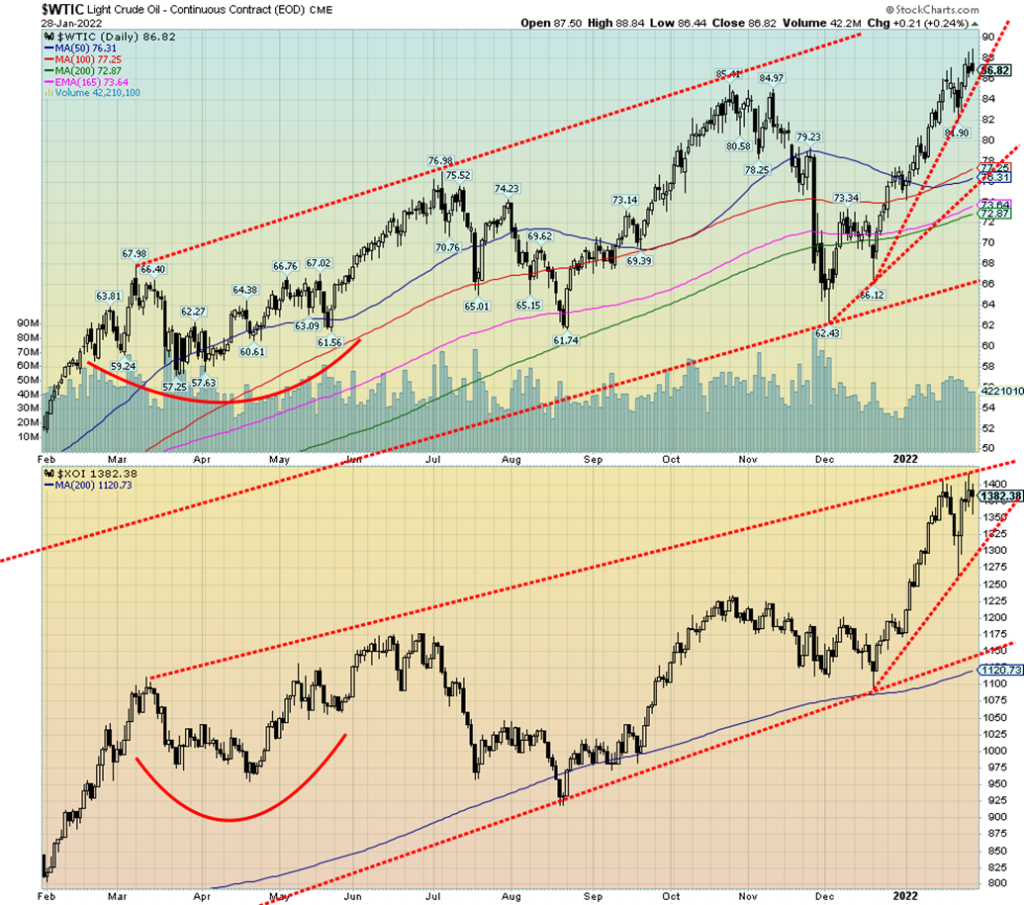
Energy stocks were also a bright spot amongst market gloom. The ARCA Oil & Gas Index (XOI) rose 4.4% this past week while the TSX Energy Index (TEN) was up 4.3%. Both indices remain, however, below recent highs. In theory, at least, the XOI is at/near the top of its channel. So, it’s difficult to say at this time whether Friday’s pullback signaled a top or a pause. The recent low was seen at 1,264. A break under 1,275 would spell trouble and suggest new lows ahead. The bulls need to see this market continue to plow ahead.
We have noted we have potential technical targets for WTI oil up to between $105 to $110 with minimum objectives of $90.80. With a high this past week at $88.84, we are not far from that objective. For the oil bears, they might be buoyed by the reversal on Friday when WTI oil made a new high for this move, then reversed and closed below the opening level. Still, WTI oil gained 0.2% on Friday despite the reversal. The recent low was seen at $81.90 and a break back under $84 could signal a test of that level and new lows. Strong support is seen down to around $76/$77.
Combined with bad weather and the ongoing Russia/Ukraine/U.S. conflict, there is certainly risk that oil prices could soar over $100. If something broke out in the Middle East, then that could be the nail in the coffin and even send oil prices soaring towards the all-time high of $147. The conflict involving Saudi Arabia, UAE, and the Yemeni Houthis backed by Iran could still morph into something more dangerous, given the Houthis’ recent attack on UAE oil facilities. The UAE is OPEC’s third-largest producer. The UAE is also strategically located near the Straits of Hormuz. 16.8 million barrels/day pass through the Straits of Hormuz. Other major oil chokepoints are the Suez Canal, the Bab-El-Mandeb in the Horn of Africa, the Bosphorus Straits between Turkey and Greece out of the Black Sea, and the Straits of Malacca between Malaysia and the Island of Sumatra.
WTI oil is somewhat overbought, but these high prices could persist and go higher given the negatives surrounding oil. Crude oil stocks in the U.S. languish near the bottom of their 5-year range and OPEC continues to under-produce, also contributing to the tight supply situation. Add in trucking woes in North America and in Europe and you have another piece of the puzzle pushing prices higher.
__
(Featured Image by Adam Novakowski via Unsplash)
DISCLAIMER: This article was written by a third party contributor and does not reflect the opinion of Born2Invest, its management, staff or its associates. Please review our disclaimer for more information.
This article may include forward-looking statements. These forward-looking statements generally are identified by the words “believe,” “project,” “estimate,” “become,” “plan,” “will,” and similar expressions. These forward-looking statements involve known and unknown risks as well as uncertainties, including those discussed in the following cautionary statements and elsewhere in this article and on this site. Although the Company may believe that its expectations are based on reasonable assumptions, the actual results that the Company may achieve may differ materially from any forward-looking statements, which reflect the opinions of the management of the Company only as of the date hereof. Additionally, please make sure to read these important disclosures.
David Chapman is not a registered advisory service and is not an exempt market dealer (EMD) nor a licensed financial advisor. He does not and cannot give individualised market advice. David Chapman has worked in the financial industry for over 40 years including large financial corporations, banks, and investment dealers. The information in this newsletter is intended only for informational and educational purposes. It should not be construed as an offer, a solicitation of an offer or sale of any security. Every effort is made to provide accurate and complete information. However, we cannot guarantee that there will be no errors. We make no claims, promises or guarantees about the accuracy, completeness, or adequacy of the contents of this commentary and expressly disclaim liability for errors and omissions in the contents of this commentary. David Chapman will always use his best efforts to ensure the accuracy and timeliness of all information. The reader assumes all risk when trading in securities and David Chapman advises consulting a licensed professional financial advisor or portfolio manager such as Enriched Investing Incorporated before proceeding with any trade or idea presented in this newsletter. David Chapman may own shares in companies mentioned in this newsletter. Before making an investment, prospective investors should review each security’s offering documents which summarize the objectives, fees, expenses and associated risks. David Chapman shares his ideas and opinions for informational and educational purposes only and expects the reader to perform due diligence before considering a position in any security. That includes consulting with your own licensed professional financial advisor such as Enriched Investing Incorporated. Performance is not guaranteed, values change frequently, and past performance may not be repeated.


Youth Cannabis Use in Colorado Is Falling — But the Full Story Is More Complex
The 2026 Colorado survey shows teen cannabis use fell to 10 percent in 2025, down from 21 percent in 2015....


Morocco’s Growth Holds at 4.6% as Agriculture Offsets Economic Pressures
Morocco’s economy grew 4.6% in Q1 2026, driven by a strong agricultural rebound offsetting declines in industry. Services expanded moderately...


Abivax Shares Surge as New Trial Data Eases Safety Concerns Over Ulcerative Colitis Drug
Abivax shares surged nearly 36% after positive updated trial results for its ulcerative colitis drug obefazimod reassured investors following earlier...


El Dorado Raises $9M to Expand Cross-Border Fintech Platform
El Dorado, a Latin American fintech improving cross-border financial services, raised a $9 million Series A led by Paradigm with...


Bitcoin Stalls Near $60K as Strategy Moves, ETFs Outflow, and EU MiCA Rules Take Effect
Bitcoin hovers near $60,000 with ETF outflows, while Strategy boosts reserves, sells BTC, and raises dividends to reassure investors. Ethereum...
 |
|
 |  |
 |
|
-

 Biotech2 weeks ago
Bavarian Biotech Sector Expands with Record Funding and Startup Growth in 2025
-

 Africa3 days ago
BOAD Approves Major Funding Boost to Drive West African Development
-

 Business1 week ago
Markets Diverge as Oil Falls, Rates Hold, and Inflation Persists
-

 Impact Investing7 days ago
Coastal Cities Lead as Heat Strains Italy’s Urban Livability