Markets
Are the Market Bears Moving in for the Kill?
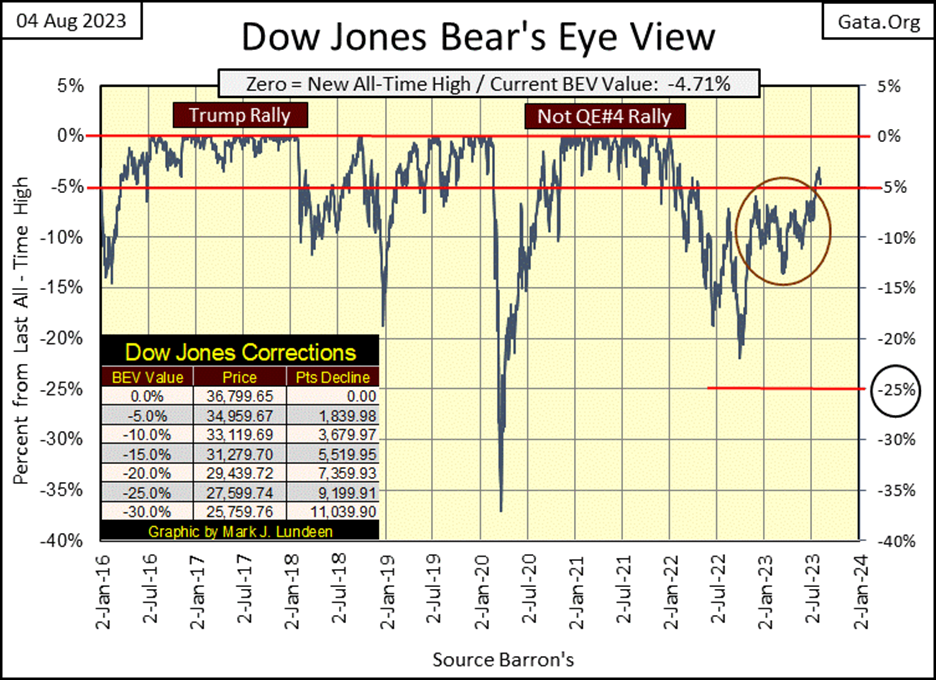
Last week the Dow Jones broke into scoring position. This week? Senator Schumer called to declassify secret UFO documents, Fitch Downgrade US treasuries from AAA to AA+, and the Dow only just kept itself in scoring position with an advance lacking enthusiasm. Could this lack of bull desire to charge into the market be pointing towards an important top in the market this August? Time will tell.

Last week the Dow Jones broke into scoring position. This week? It kept itself in scoring position, but just barely. This advance lacks enthusiasm, the bulls lack the desire to charge into market history. I get the feeling they would just as soon lay under a tree, out of the sun, and snooze during the trading day.
Could we see a new BEV Zero? Sure, but after that, what then? I doubt we’ll see the follow through so obvious in the Trump and Not QE#4 Rallies below. If the bulls can’t get off their asses and start moving up the hill, I’m expecting a retracement back to the Dow Jones’ BEV -10% line before we see a new BEV Zero.
As always; we’ll know more next week.
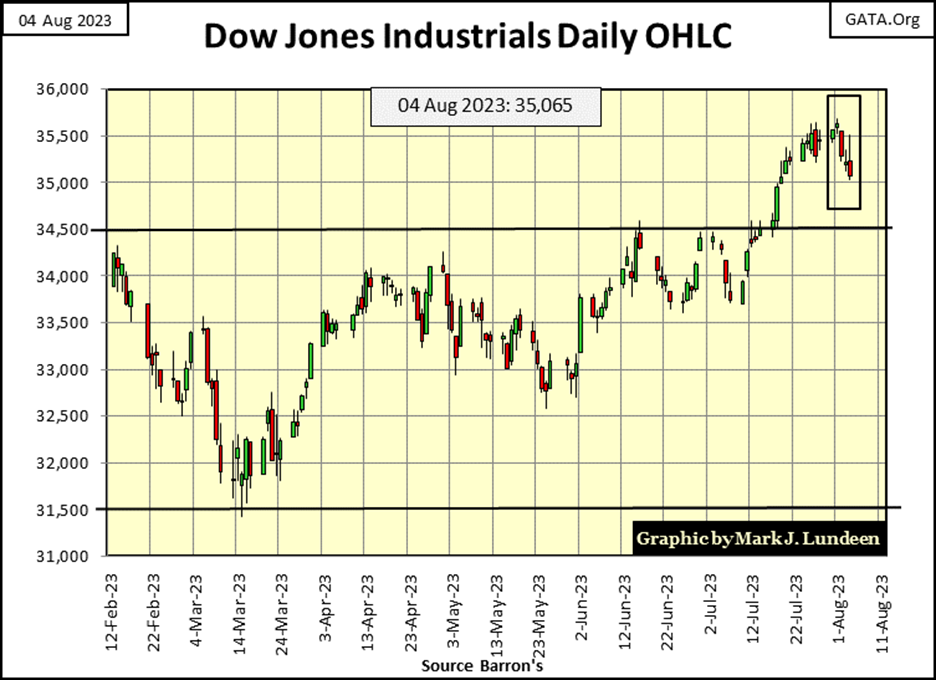
Next is the Dow Jones in daily bars. Monday and Tuesday saw weak gains, then on Wednesday the Dow Jones just gave up and quit, losing half the gains of the previous two weeks by week’s end. The new line of resistance is 35,500. If the bulls cannot get above that level, and then stay above it, as they make further gains, we may be looking at an important top in the market in the making.
I hate Microsoft Office. Microsoft keeps asking me to upgrade to Office 11. But with each upgrade I get, it never becomes better, it only gets worse. Look at Friday below. Four indexes closed in scoring position, so why do I have a box around six indexes, the bottom two of which are NOT in scoring position? Because MS Excel won’t allow me to adjust, or even remove that red box from my graphic.
Is this going to be a new feature in my table for indexes BEV values for the next few years? I could redo the table, but that is work. How do I know MS Excel won’t trash my new table too?
Anyway, the market lost ground this week. Look at the Average at #14, down just under 2 BEV points for the week.
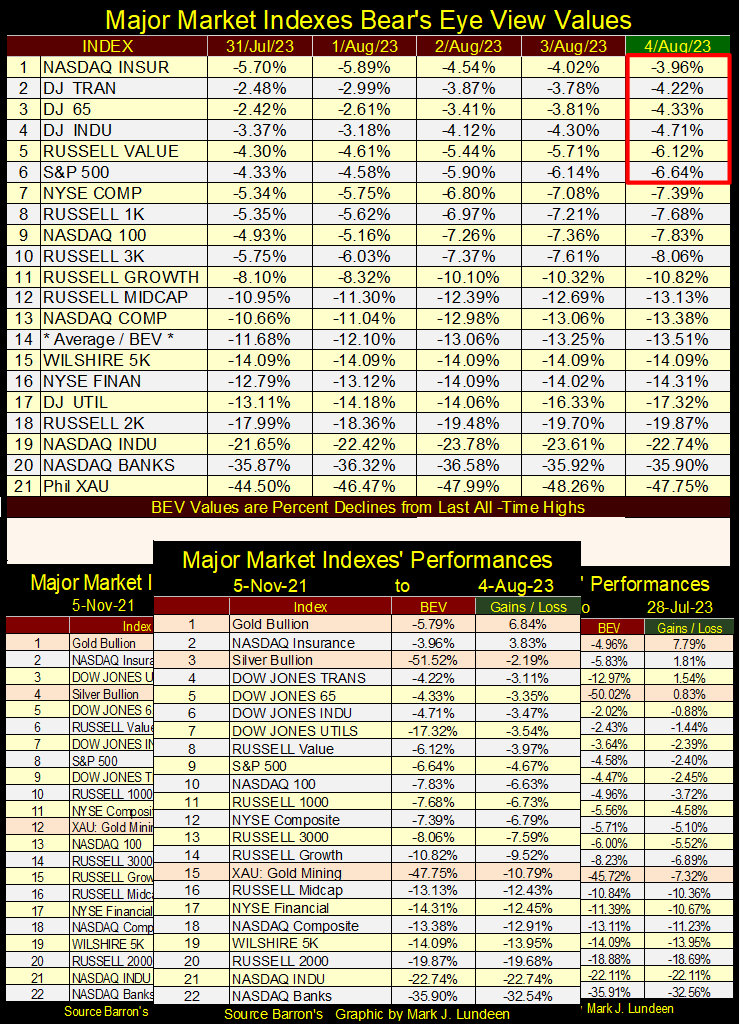
Look at my performance tables above; what a mess. I can’t correct what is seen above, so I’ll have to go with it. Gold has remained at #1 for many months now, and silver is never far from gold. But what is going on with the XAU, that not all that long ago, it was up with gold and silver bullion.
I cover this in more detail below, but to keep it simple, the precious metal miners are historically cheap, and are getting cheaper. If you’re buying, that isn’t a bad thing.
Looking at 52Wk Highs and Lows at the NYSE in the table below, since the end of June there has been only one day with more 52Wk Lows than Highs; July 6th with a H-L Net of only -6. That’s good. However, during a prolonged advance, such as we are having, we should see a few +300 H-L Nets. The largest one below is +209, seen on June 30th. This is weak for a market advance, but typical for a market top, as the bulls no longer have what it takes to keep the ball going down the field.
Is August 2023 going to be an important market top in the stock market? I’ll tell you all about that come the 1st of September, but it just might be.
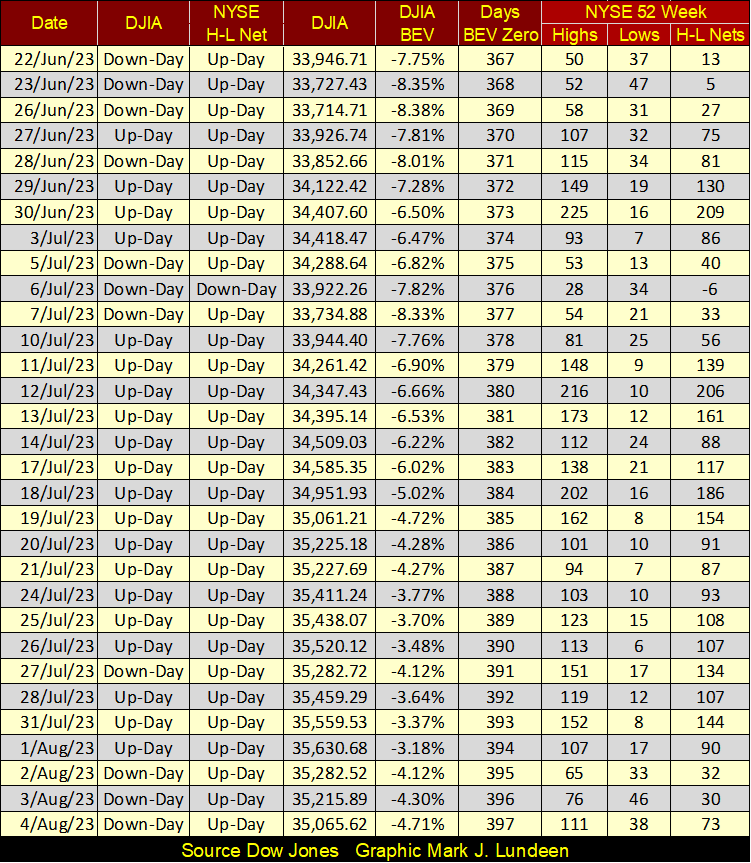
Looking at the Day’s BEV Zero column above, the week closed at 397; that is 397 NYSE trading sessions since the Dow Jones saw it last all-time high on 04 January 2022. This is a statistic that will only grow larger in our current market.
So far in 2023, the gold and silver miners haven’t done much, but then what else has? The question in my mind is; in the stock market, what today is expensive, and what is cheap. The point of that question is, for decades, since October 1981 until very recently, bond yields and interest rates descended from double-digits to low single digits. In this declining interest-rate environment, some stock groups have advanced in a historic fashion, while others haven’t.
To my way of thinking, should rates once again begin trending towards double-digits, the engine-of-inflation that made some stock groups rise for decades will go into reverse, making those stock groups that currently are expensive, at risk of becoming much cheaper. One should also consider the possibility that stock groups that have done little to nothing these past four decades as rates were declining, may become the place to be should rates continue rising.
But will bond yields and interest rates continue rising in the years to come? I think they will, thanks to our elected leaders in Washington inability to control their reckless spending of borrowed money on who knows what, but not limited to endless wars. With the pointless war in Ukraine being their latest, in an apparent endless cavalcade of human catastrophes, we US taxpayers are forced to shoulder.
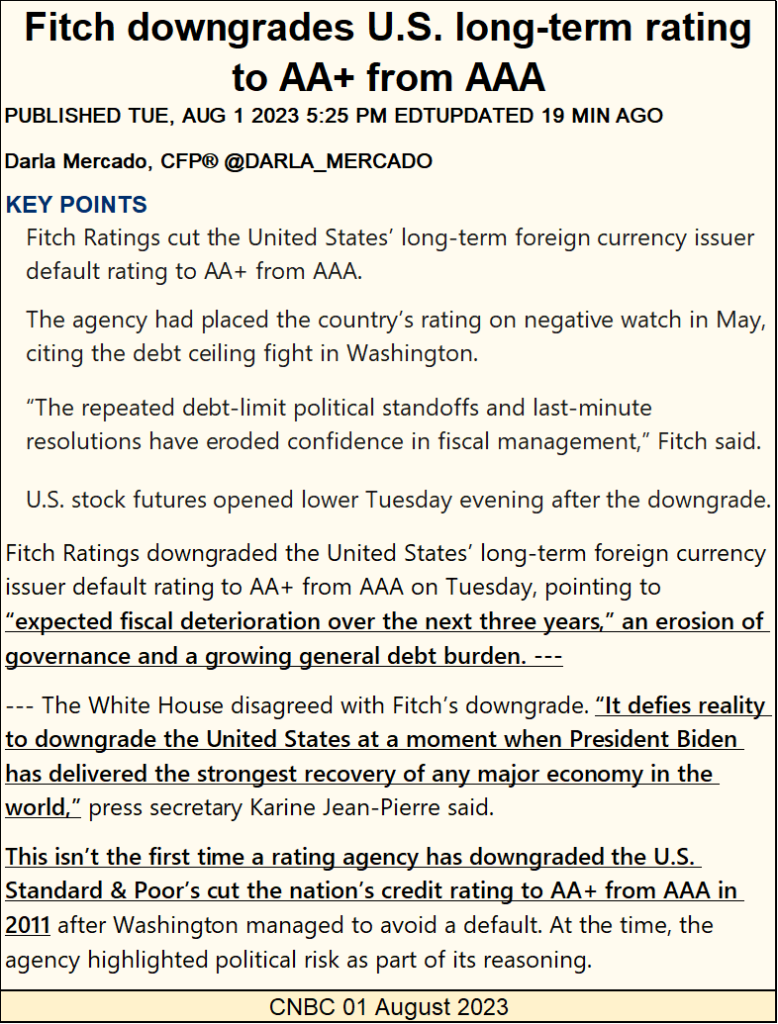
This week, Fitch downgraded the US Treasury’s credit rating from AAA to AA+. That is as much as Fitch dared to take their downgrading. If they had the courage to tell the truth, that Uncle Sam will never, can never pay back any of his debts, except in increasingly worthless US dollars, digital-dollars the FOMC can produce in any volume, at no cost, the credit of the US Treasury would be at best low-grade junk.
That is your opinion, Mark. And you are someone who struggled through high school, and spent twenty years in the Navy, and now you are complaining about the US Treasury’s credit worthiness? In fact there are plenty of really “smart people,” Warren Buffet for one, who like Treasury debt.
Why do “smart people” see the credit worthiness of the US Government so differently from you Mark? Let’s call their differing view on the credit worthiness of the US Treasury, enlightened self-interest.
There are about $33 trillion dollars of Uncle Sam’s IOUs held somewhere in the global economy, by wealthy private citizens, financial institutions, governments and central banks worldwide. None of the above have any interest in seeing their holdings of US Treasury debt downgraded, because these are the people who would take the downgrading of US Treasury Debt where it hurts most – in the wallet. Having an honest reckoning of the US Treasury’s credit would be the fastest way for many billionaires, like Buffet to find themselves in greatly reduced circumstances. Denial is much more than just a river in Egypt!
Bond yields and interest rates have been rising for some time, as seen below. The yield for the US Treasury’s 30Yr long bond (Red Plot below) has been rising since August 2020, and this week closed with a new high of the move; 4.32%.
The FOMC began increasing their Fed Funds Rate (Blue Plot) beginning in April 2022. Both have increased significantly since they bottomed, and I doubt we’re anywhere near the top in the advance in bond yields. Though I know the idiots at the FOMC could cut their Fed Funds Rate back to zero, if they wished, but only at the risk of devaluing the dollar they’ve managed so poorly in the global market place.
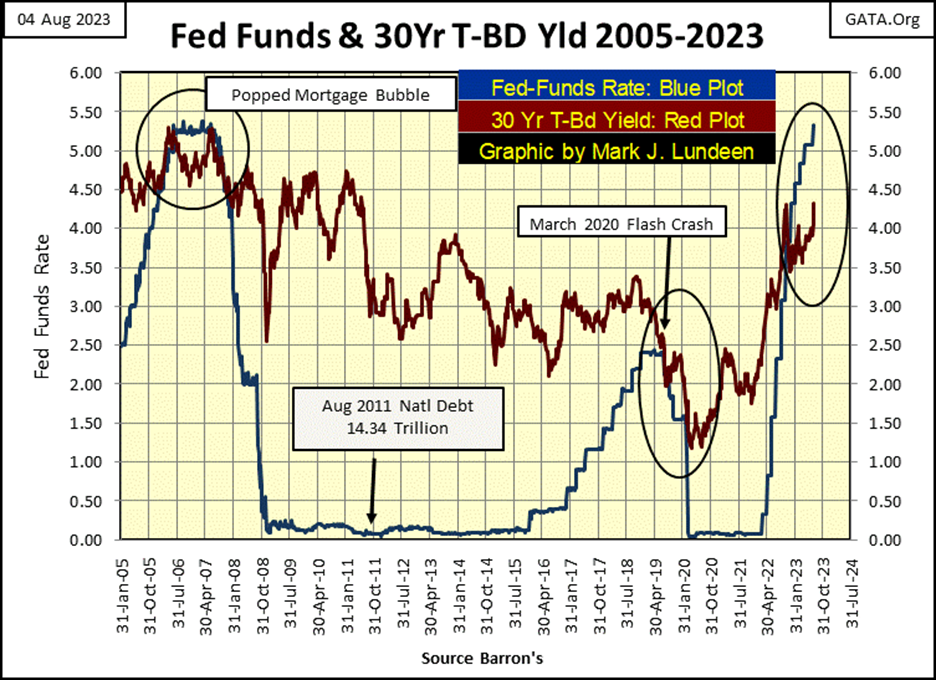
This chart above is also interesting as it shows the yield inversion that triggered the sub-prime mortgage, and March 2020 Flash Crash market declines. It didn’t take much of an inversion to pop those two bubbles. Looking at the current yield inversion, which is massive compared to the two previous times the FOMC inverted the yield curve, I’m surprised we’re not currently in big recession, and the NYSE and NASDAQ has so far been free from panic selling in the former glamor shares everyone still loves.
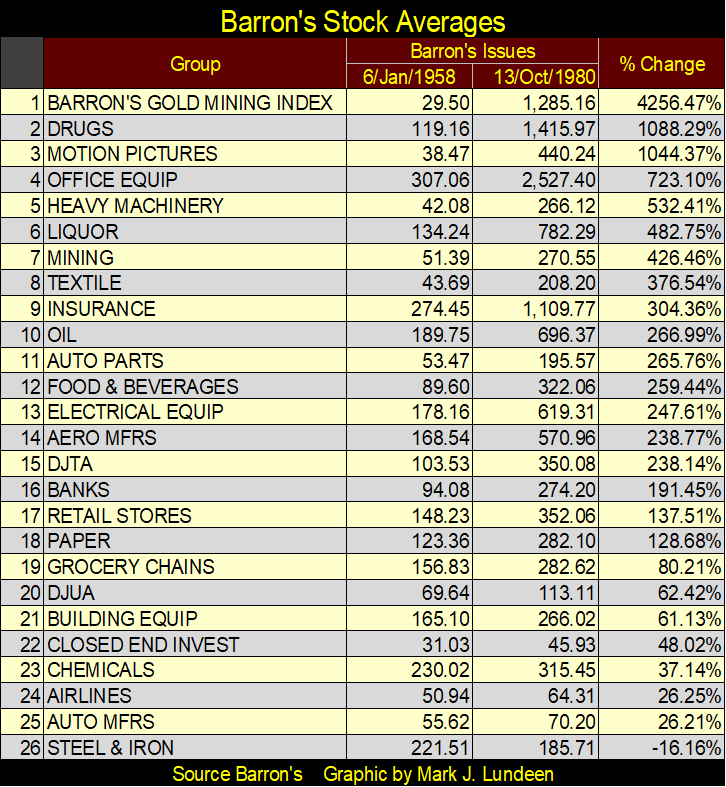
Over at the NYSE, what is, and what is not beloved by both the pubic and “market experts” changes with time, and the trends in interest rates and bond yields. Way back into the late 1950s, when bond yields and interest rates were single digits, to 1980 when rates increased to double-digits, the gold miners were the top group in the stock market, as seen in the Barron’s Stock Averages table below. During these twenty-two years of rising rates and yields in the debt market, nothing else came close to the advances seen by the gold miners.
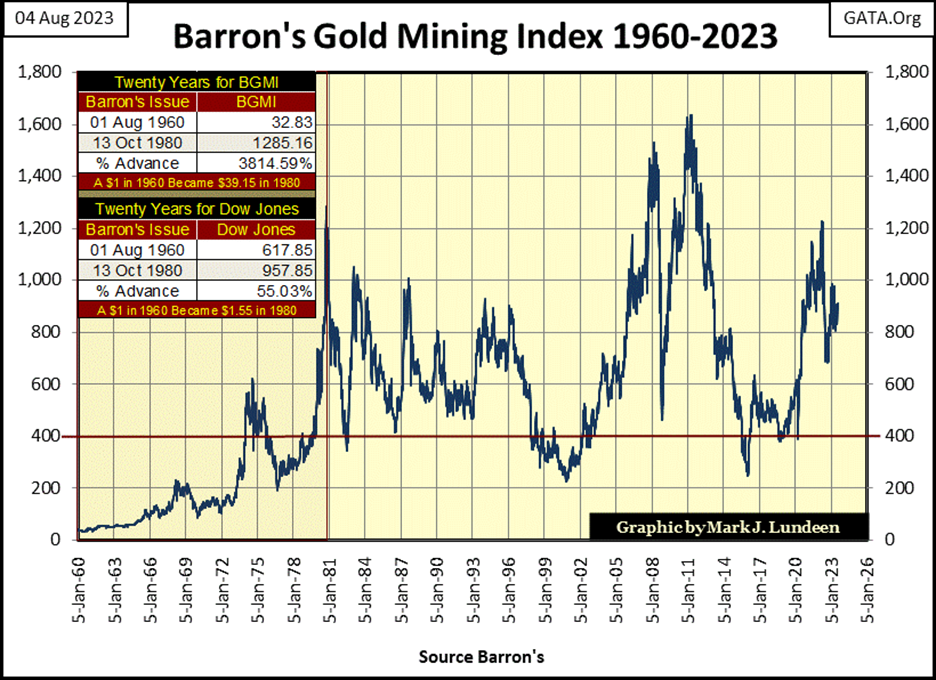
What happened after the BGMI topped in October 1980? The markets saw four decades of declining bond yields and interest rates. As seen below, since its October 1980 top, the BGMI has seen huge swings in valuation, but really hasn’t gone anywhere for the past forty-three years, closing this week below its high of October 1980.
We’re looking for a cheap sector in the stock market to risk our money in, a cheap sector that has the potential for above average gains in the years to come. But never forget, anytime you place your bets on a stock in the market, you do so expecting a reward, but with potential rewards comes risks.
Recently I spent some time on gauging risks and rewards in the market, and I noted at bull-market tops;
- risks are maximum,
- potential for rewards is minimum.
At bear-market bottoms;
- risks are minimum,
- potential for rewards is maximum.
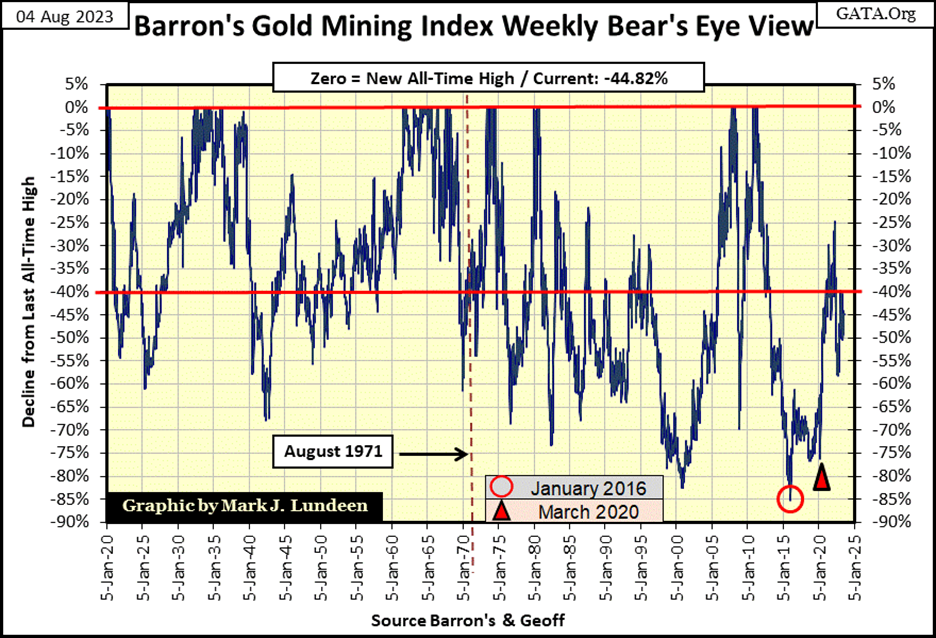
Keeping the above in mind, let’s look at the Bear’s Eye View (BEV) for the Barron’s Gold Mining Index (BGMI), from 1920 to this week’s close in the chart below. The BGMI is still coming off an 85% bear market bottom (Red Circle) from January 2016, advancing only to its BEV -25% line so far in its current rebound from a massive bear market bottom, closing this week with a BEV of -44.98%. After six years following an 85% bear market bottom, this isn’t much of a gain, making gold mining shares cheap.
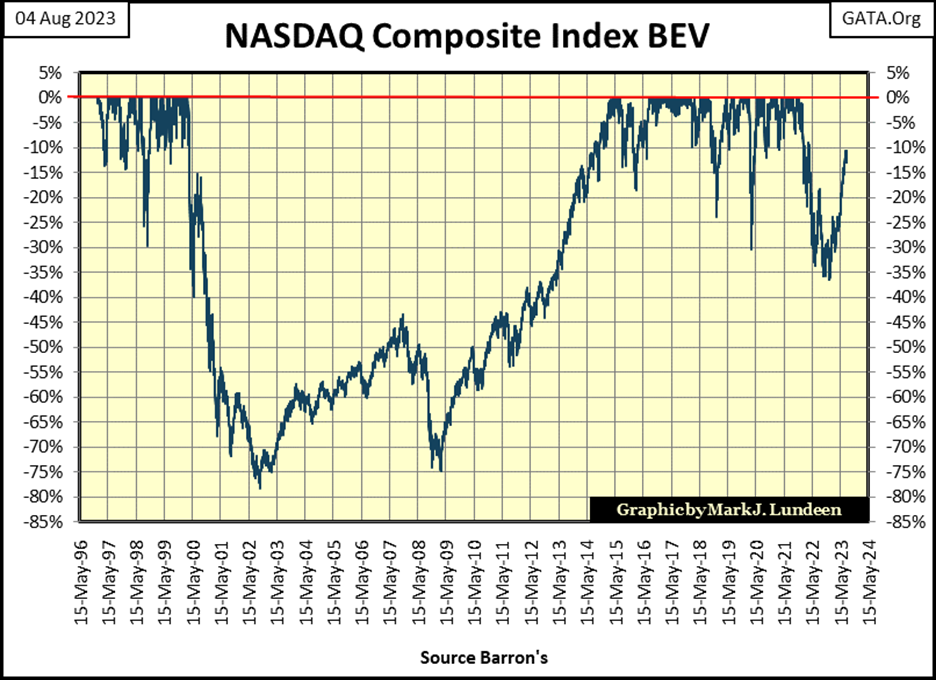
Let’s compare what we see above with the BGMI to the NASDAQ Composite Index’s BEV chart below. Coming off a massive BEV -75% decline in 2009, the NASDAQ Composite Index began making new BEV Zeros in 2015, and kept making them until late 2021; six-years of boom times in high-tech. An advance taking the NASDAQ Composite Index from 1293.75 on 09 March 2009, to 16,057.44 on 19 November 2021, an advance of 1241% in only twelve years.
Another way of looking at that 1241% advance is saying a $1.00 of NASDAQ Composite on 09 March 2009, became $13.41 on 19 November 2021, which to my way of thinking, makes the high-tech stocks now very expensive.
The BGMI hasn’t seen a new all-time high since April 2011, and has spent most of its weekly closings for the past twelve years below its BEV -40% line in its BEV chart above.
Why has the BGMI underperformed the NASDAQ Composite? That is simple; money has flowed to the market’s high-tech sector, while it avoided the gold miners.
Last autumn, the NASDAQ Composite declined to its BEV -35% line, and has since advanced just short of its BEV -10% line. But I note a big difference in the market since the NASDAQ Composite’s last all-time high in late 2021; bond yields and interest rates have increased significantly, and promise to continue trending higher for a long time to come. That’s a problem for the NASDAQ Composite, a big problem current “market experts” choose to ignore.
Taking that factor into consideration, there is reason to doubt the NASDAQ Composite Index will see a new BEV Zero anytime soon, making high-tech stocks expensive, and likely to see their valuations deflate in the future. Gold and silver miners have a proven record of thriving in rising interest-rate environments, making the BGMI and XAU cheap, with the potential for growth in today’s markets.
Today in August 2023, I believe the high-tech sectors, represented by the NASDAQ Composite, will prove to be a thing of the past as bond yields and interest rates continue climbing. But not so for the gold and silver miners who produce pure wealth, with zero-risk of default, assets that will benefit from rising yields and rates.
Volatility for the BGMI changed greatly following the decoupling of the US dollar from the Bretton Woods $35 gold peg in August 1971. As evident in the BGMI’s BEV chart above, the gold miners were always volatile. But volatility increased greatly following August 1971, when the US Government became free to issue as many dollars, paper and digital, as they wanted, unhindered by a $35 gold peg.
So, lets compare volatility in the BGMI before and after August 1971 in the two frequency distribution tables below, using data from the BGMI’s BEV plot seen above.
Using BEV data, when a data series is in a bull market in the tables below can be seen by the number of data points in the top two rows of these tables;
- 0%: New All-Time Highs,
- -0.000001%: closes in scoring position (-0.01% to -4.99% from a new all-time high).
From January 1920 to August 1971 (Left Table), the totals from these two rows equaled 13.1% of the total weekly closings for the BGMI during these fifty-one years, or the BGMI was in a bull market for 13.1% of the time during this half century.
Since August 1971, the totals for these two rows equaled only 3.18% of the total weekly closings. However, most of the hits in these two rows happened before November 1980; 32 of the 46 BEV Zeros in the 0% row, and 21 of the 40 hits in the -0.000001% row.
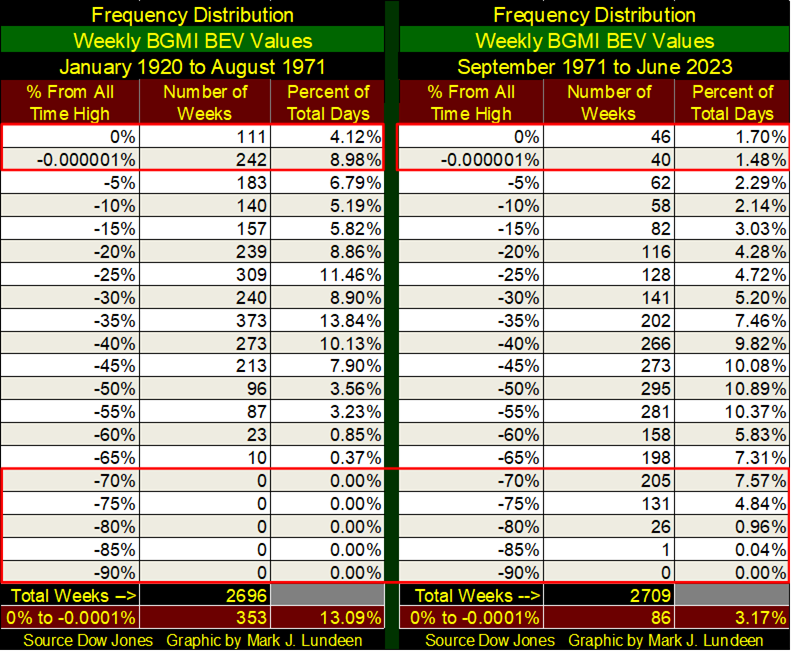
So, since November 1980, for the past forty-three years, the BGMI has closed at a new all-time high (BEV Zero; 0.0%) for only fourteen of its weekly closings, as bond yields and interest rates declined from double-digits to low single digits. From October 1981 to August 2020, gold mining shares had little to offer investors, making the gold and silver mining sector unloved and unwanted.
That doesn’t sound good, but it means as of now, the public and managed money has little to no exposure to gold and silver mining, something typically seen at market bottoms, which is when one wants to buy.
So hopefully, we are moving beyond those bad old days, and into much better times in gold mining. I expect the change will be dramatic when the financial markets are forced to face the reality that for the foreseeable future, bond yields, interest and mortgage rates have nowhere to go but up.
Exactly when the bear market in debt forces a reevaluation of the gold mining sector, I don’t know. I only know it will happen, and that patience is a real virtue when investing in the gold and silver miners, so just take a position, and go on with your life.
As the key to future success in gold and silver mining are rising bond yields, let’s look at bond yields rise in the charts below. This 30yr T-bond issued in February 2020 saw its yield bottom six months after it was issued; 1.19% in August 2020. It closed this week at 4.28%. In the past three years, this bond’s valuation (Blue Plot) has deflated by 47% from its highs of August 2020.
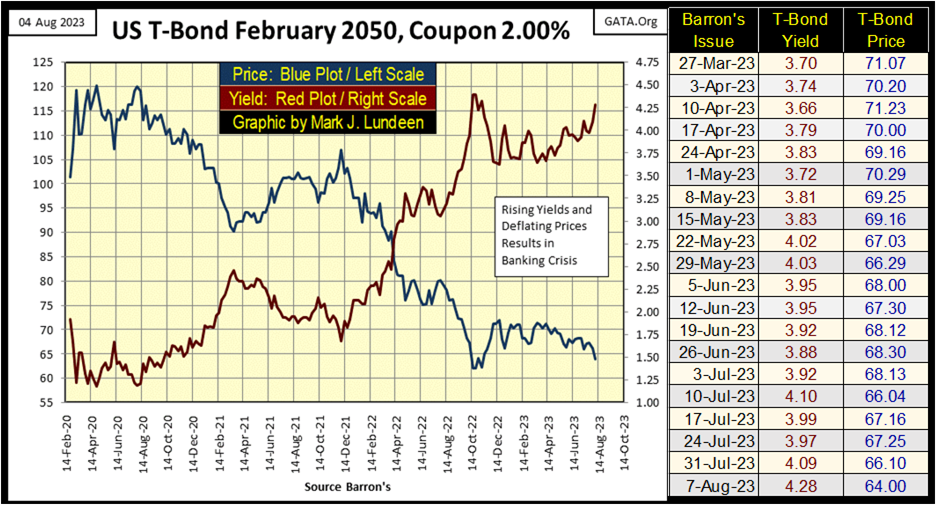
Had a widely-followed investment lost 47% of its valuation in only three years, like single-family homes, the Dow Jones or S&P500, it would be big news in the MSM. But when long-term Treasury debt sees a 47% collapse in market valuation, the MSM remains for the most part silent.
As bond yields continue to climb, market valuations in the bond market continue to deflate. How much higher can bond yields rise, and bond valuation deflate, before a selling panic strikes the US Treasury, and corporate bond markets, forcing the Financial Media to cover this historic bear market in debt?
When it happens, gold, silver and the precious metals mining shares will see historic market action as wealth flees debt, seeking the safety of precious metals.
Here is a chart for Barron’s Best & Intermediate Grade Bond Yields. Like all debt markets, corporate bonds have also seen yield spikes since 2021, as these bond’s valuation deflate. The corporate bond market is a multi-trillion-dollar market, but at some point won’t be, should yields continue to rise.
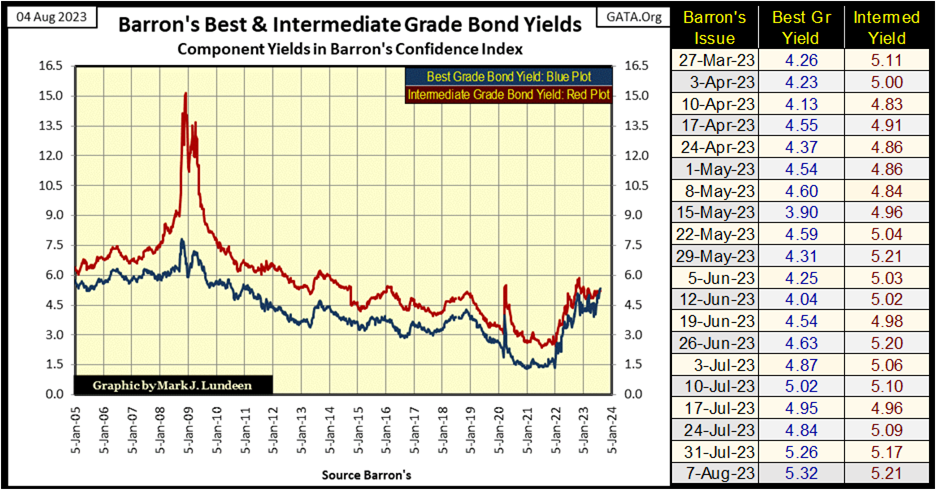
We don’t hear about the massive losses of wealth in the bond market in the financial media. But the losses are real, if not commented on, and those who are taking them are fully aware of the circumstances they now find themselves in.
There comes a threshold in pain, when crossed, when rising yields will force current holders to exit the bond market at great loss to themselves. You’ll finally see the bear market in debt covered in the news, and in the rising price of gold, silver, and the precious metal mining shares.
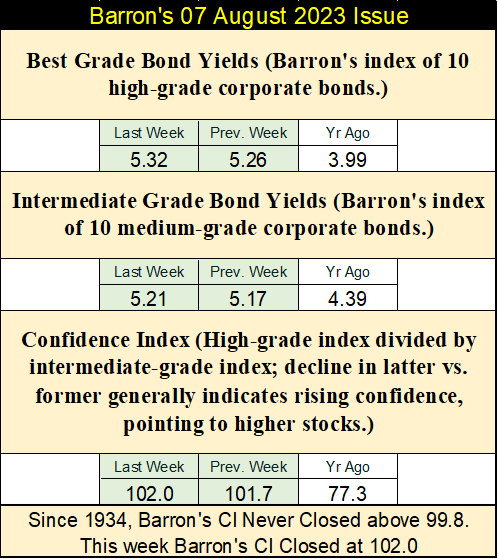
For the second week in a row, Barron’s Best-Grade Bond Yields closed above yields for Barron’s Intermediate-Grade Bonds. This should not be, and hasn’t been since 1934. Yet here it is for the second week in a row. I don’t know what is going on here, but it can’t be good.
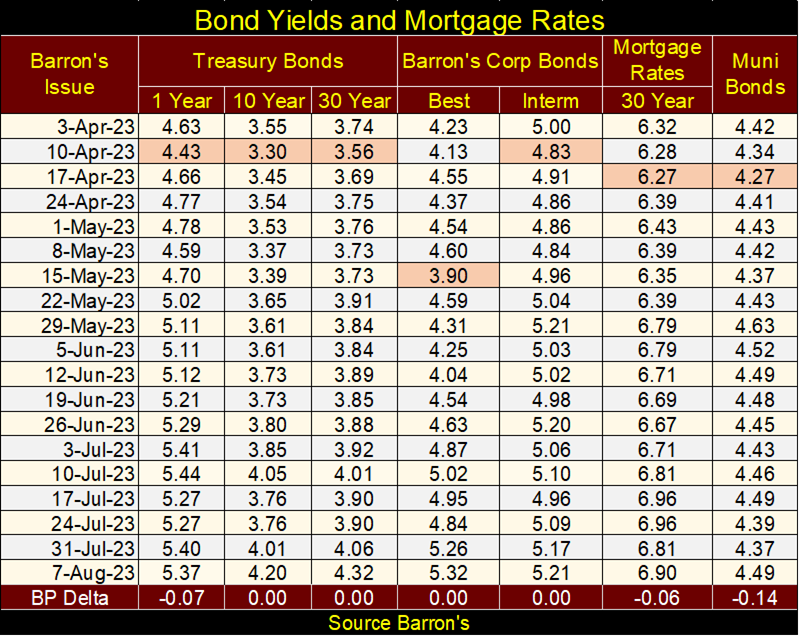
Below is a table listing yields and rates going back to last April. Mortgage rates are rising too, meaning valuations in real estate are also deflating.
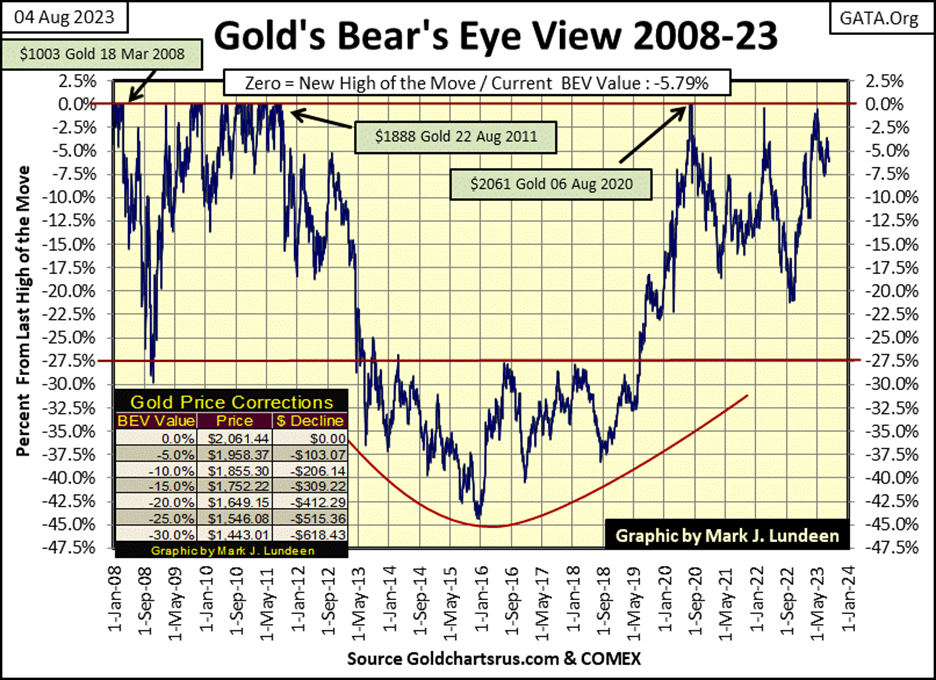
Gold this week closed outside of scoring position, but it looks to me like it is holding on to its gains since last autumn. It’s been three years since gold’s last all-time high. I’m all for seeing gold make a big move above $2061 in the months to come.
In gold’s step sum table below, gold saw a +7 15-count on July 19th. That made gold an overbought market, so I’m not surprised we’ve seen more down days than daily advances since then. But after all those down days, gold is only down about $44. I like that.
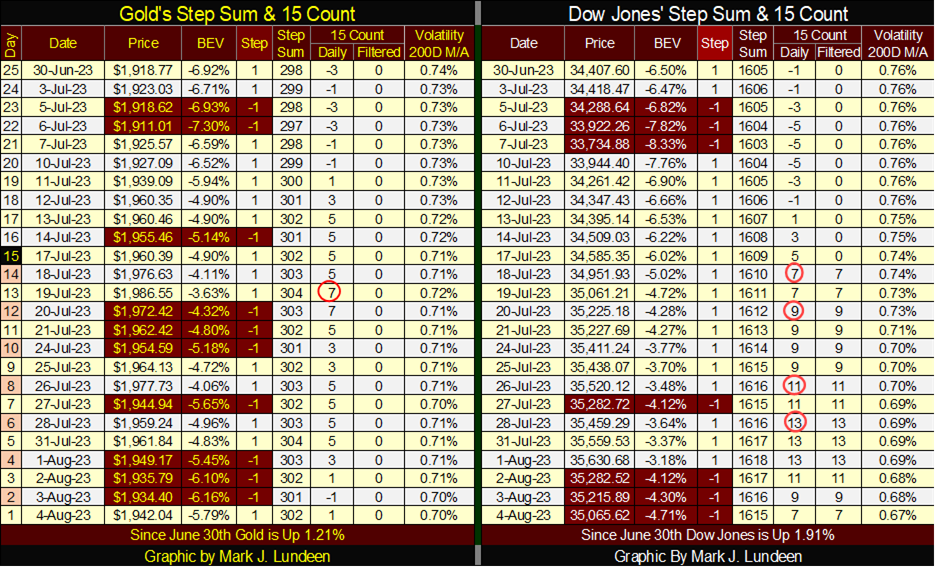
The Dow Jones became wildly overbought when its 15-count increased to an amazing +13 on July 28th, something rarely seen. The Dow Jones is due for a selloff after this +13 15-count. Can it hang tough, and keep its valuation near scoring position, a BEV value of something better than say a -7.00%, or will its valuation continue deflating to BEV values below -10.0%?
I expect that will all depend on what bond yields do in the weeks to come. If they continue rising as they have been so far in 2023, I’m thinking the 35,630 seen by the Dow Jones on August 1st will be a market top, to be followed by a market decline. As always, we’ll all know more next week.
What’s this? Senator Schumer wants to declassify secret UFO documents?

I’ve been following UFO phenomenon since I read Whitley Strieber’s book Communion in 1985. Since the 1940s, the Federal Government has denied anything, and everything concerning UFOs. If someone really dives into this topic, they will soon learn the government has been denying a humongous body of very strange stuff that goes far beyond UFOs. I believe they are real, but are they visitors from interstellar space paying us a visit, or demons from hell come to torment humanity? For those who are abducted by “the Greys,” and taken into a UFO, it’s never a pleasant experience.
Now senator Schumer is saying my government has been lying to me for decades concerning UFOs? Why admit the obvious now with President Trump running for office once again, as our current President, and his entire family is being exposed for profiting by selling Joe Biden’s influence to foreign interests, worldwide?
Maybe they want to have people stop talking about the Biden family, and start talking about something else – something like UFOs.
—
(Featured image by Brett Sayles via Pixabay)
DISCLAIMER: This article was written by a third party contributor and does not reflect the opinion of Born2Invest, its management, staff or its associates. Please review our disclaimer for more information.
This article may include forward-looking statements. These forward-looking statements generally are identified by the words “believe,” “project,” “estimate,” “become,” “plan,” “will,” and similar expressions. These forward-looking statements involve known and unknown risks as well as uncertainties, including those discussed in the following cautionary statements and elsewhere in this article and on this site. Although the Company may believe that its expectations are based on reasonable assumptions, the actual results that the Company may achieve may differ materially from any forward-looking statements, which reflect the opinions of the management of the Company only as of the date hereof. Additionally, please make sure to read these important disclosures.


Blockchain Evolves Toward AI, Finance and Quantum Security
Blockchain is evolving beyond crypto into finance, AI applications, and digital markets, while security and regulation remain challenges. Quantum threats...


The Italian Crowdinvesting Market Faces Sharp Decline in 2026
Italian crowdinvesting market continued to decline in 2026, with fundraising falling 36.8% year-on-year to €164.19 million. Platforms and active campaigns...


Sartorius Stedim Biotech Maintains Growth Momentum in H1 2026
Sartorius Stedim Biotech reported solid H1 2026 results, with revenue reaching €1.527 billion and EBITDA rising to €479 million. Growth...


Bank of Africa Launches BOA MDM Network to Boost Diaspora Investment in Morocco
Bank of Africa launched the BOA MDM Network to channel diaspora remittances into productive investment, aiming to raise their share...


Switzerland’s Medical Cannabis Reform Advances Access, But Barriers Remain
Switzerland’s 2022 medical cannabis reform improved patient access by removing federal approval requirements, but challenges remain. MEDCAN highlights barriers including...
 |
|
 |  |
 |
|
-

 Crypto6 days ago
Bitcoin, and Ethereum Rise, While Cardano Enters Transition
-

 Markets2 weeks ago
Dow Jones Pauses Near Record Highs as Precious Metals Lead
-

 Impact Investing3 days ago
Swisscanto Launches Catastrophe Bond Fund for Portfolio Diversification
-

 Fintech2 weeks ago
Advanced Blockchain Under Pressure Amid Crypto Market Shifts