Featured
Are the Markets Waiting for a Triggering Event?
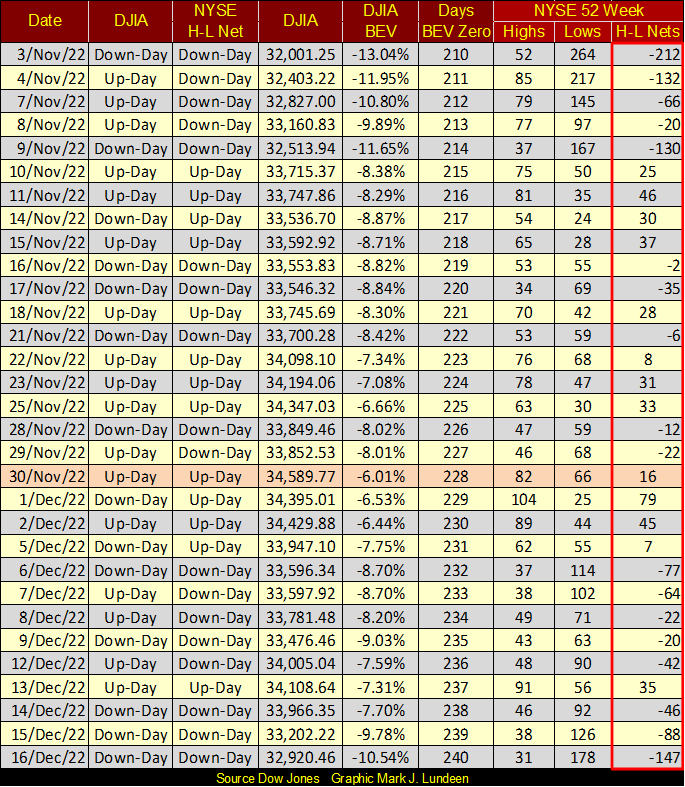
Since the market began bouncing off its September lows, every positive NYSE 52Wk H-L net failed to reach triple digits. Something the bears have had no problem doing during this market advance, generating NEGATIVE triple digit 52W H-L nets as seen in early November, and again at this week’s close. As far as market advances go, the one that began on September 30th and topped on November 30th wasn’t anything to be remembered in new NYSE 52Wk High terms.

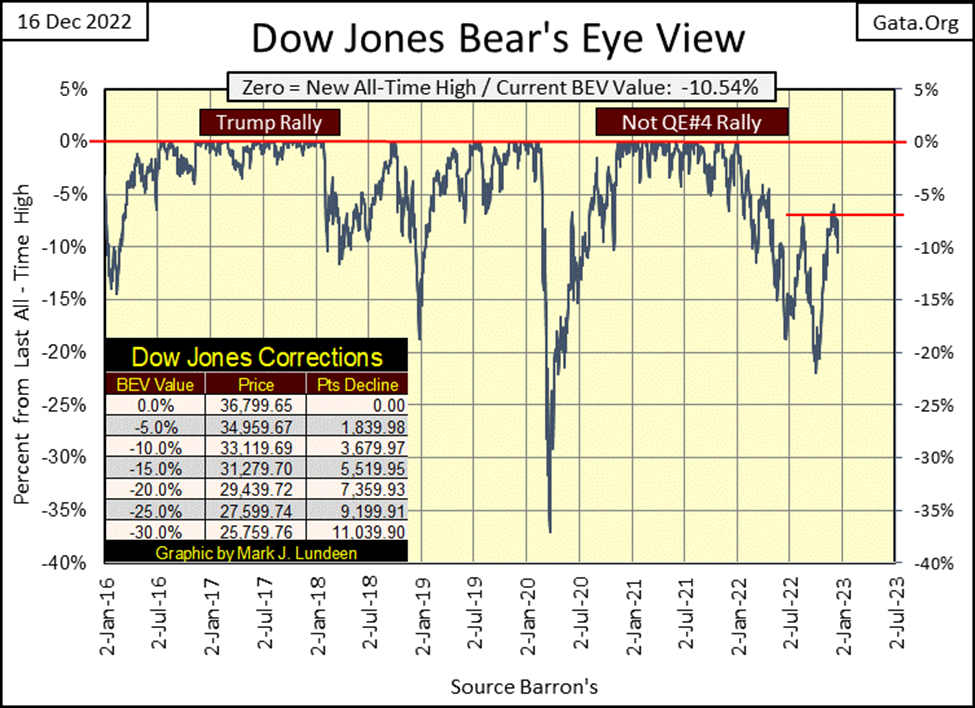
A couple of weeks ago, the Dow Jones broke above its highs of last August. It was looking really good – a few weeks ago. Now a week before Christmas it appears Mr Bear has the bulls running the wrong way, with the Dow Jones closing below its BEV -10% line. This could get serious, but until bond yields once again begin to rise ever higher, which so far up to this week they haven’t, I’m not going to worry too much about the Dow Jones or the stock market.
Just keep in mind this is coming from someone with no exposure to the broad stock market, and I like it that way. As I believe for you stock-market bulls out there, this is a market that at best promises pennies to the upside, and many dollars to the downside.
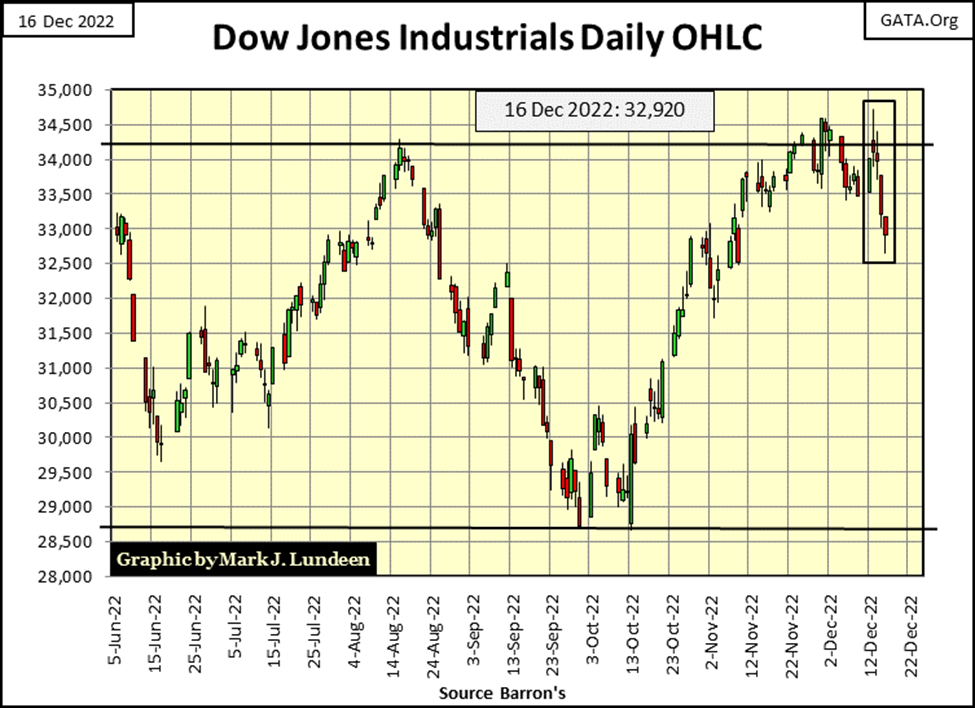
Here is the Dow Jones in daily bars. This chart perfectly illustrates why this week was a real stinker for the stock market. The Dow Jones twice in the past three weeks rose above its highs of last August, and twice failed to stay there. Then this week came the meltdown for the Dow Jones.
We may see a rebound in the next week or two in the market, but the 34,200 high from last August is beginning to look like a very difficult line of resistance for the bulls to break above, and then stay above.
The selloff this week wasn’t limited to the Dow Jones. This week, the major indexes below also saw their path of least resistance to the downside. On Monday, we started the week with five of the indexes below, closing above their BEV -5% lines. By Friday’s close, there was only one index closing above its BEV -5% line, but just barely.
It wasn’t any better at the bottom of the table either. I can’t say when, but I believe it’s only a matter of time, by February (?) before we see a handful of indexes competing with the XAU for the honor of finishing last on the list.
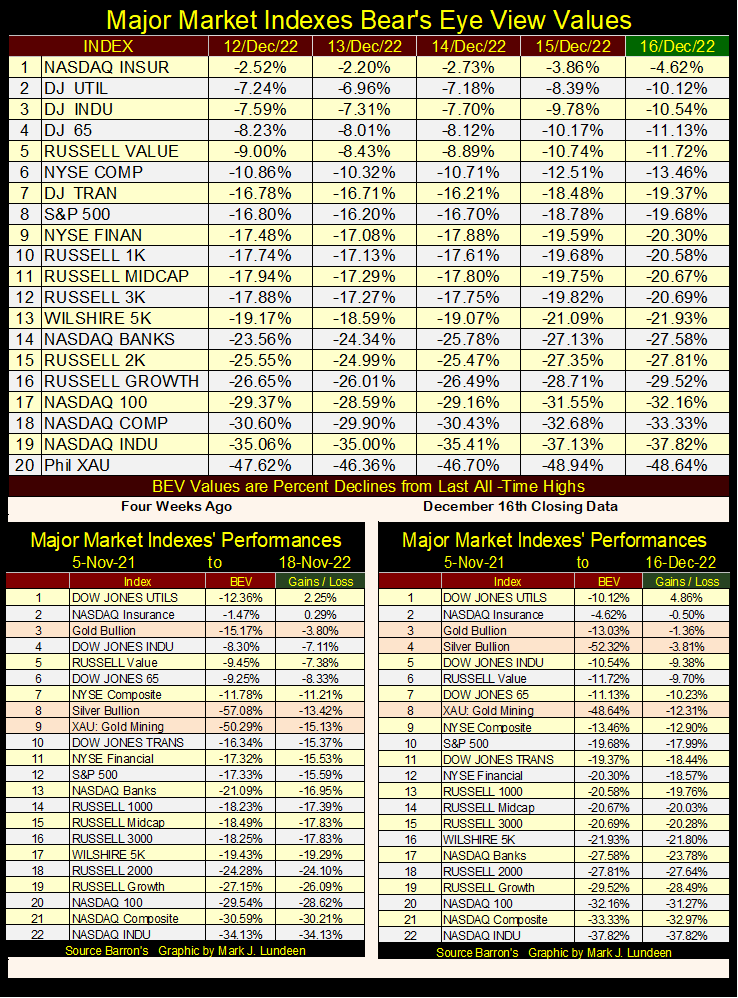
In the tables above, except for the DJ Utilities and precious metals assets, everything else is shedding market value. This doesn’t look good. The Dow Jones turned away from its 52Wk high line, and is headed back down towards its 52Wk low. What is to happen next? Will the Dow Jones next be making a new 52Wk high or low?
The idiot savants at the FOMC can always flood the market with dollars, to reinflate market valuations in the stock market. They trash the dollar by doing so. But like all bad habits, it’s a habit that so far, they’ve found difficult to break. What are the idiots going to do now?
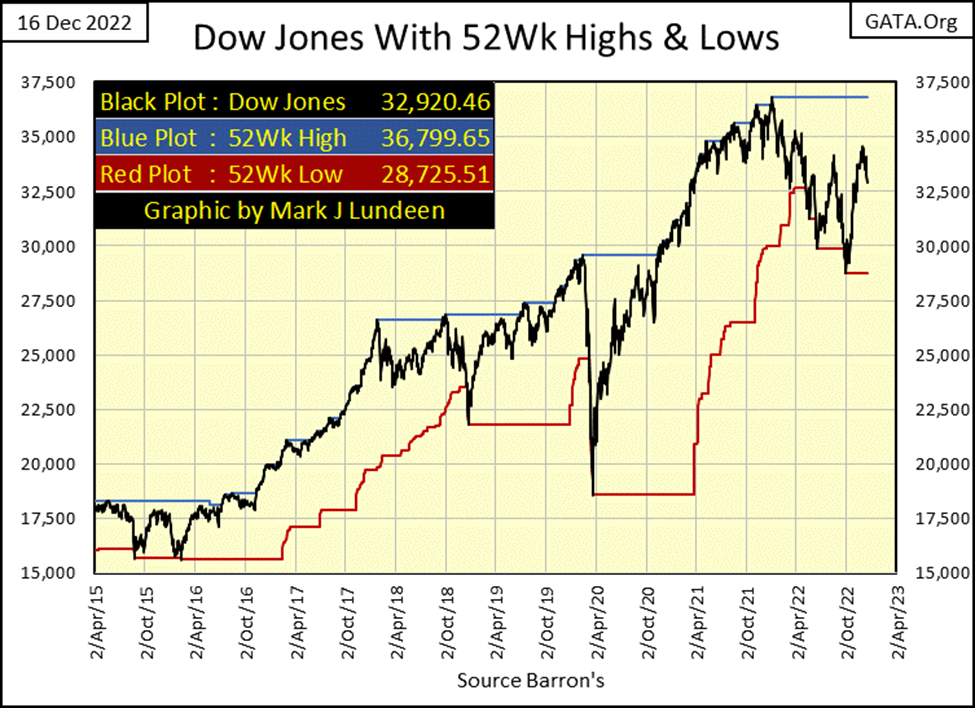
I haven’t a clue. But being a bear, I’m inclined to think the next big thing for the Dow Jones will be a new 52Wk low sometime in the first quarter of 2023, that is a close below 28,725.51. If that happens, it will become harder and harder for the investing public to accept that we’re in a bull market, which for now most people still do.
This is how bear markets are; there’re not so much a thing as a process; where bulls in the market are forced to accept certain unpleasant facts, such as the easy money and good times are over. Some bulls learn quickly, while others very slowly. At the bottom of a big-bear market, bulls as a species, like dinosaurs become extinct. Which oddly enough, is the perfect time for grizzled bears to come bullish.
At this week’s close, it’s way too soon to be thinking about buying.
NYSE 52Wk H-L nets in the table below continues to disappoint. Since the market began bouncing off its September lows, every positive NYSE 52Wk H-L net failed to reach triple digits. Something the bears have had no problem doing during this market advance, generating NEGATIVE triple digit 52W H-L nets as seen in early November, and again at this week’s close.
I centered all the positive 52W H-L nets in the table below to highlight them. As far as market advances go, the one that began on September 30th and topped on November 30th wasn’t anything to be remembered in new NYSE 52Wk High terms. The last positive triple digit NYSE 52Wk H-L Net was a year ago, on December 31st; a H-L net of +109, which isn’t much.
Mr Bear and his report card below continues being less than desired, as we continue seeing Dow Jones days of extreme volatility, Dow Jones 2% days, as on Thursday with a -2.25% decline from Wednesday’s close.
A point I’ve made frequently is that Positive Dow Jones 2% days are * NOT * necessarily bullish. This autumn’s advance in the Dow Jones topped on November 30th with a Dow Jones 2% day, taking the Dow Jones to a BEV of -6.01%. For the Dow Jones and the rest of the market, it’s been downhill ever since.
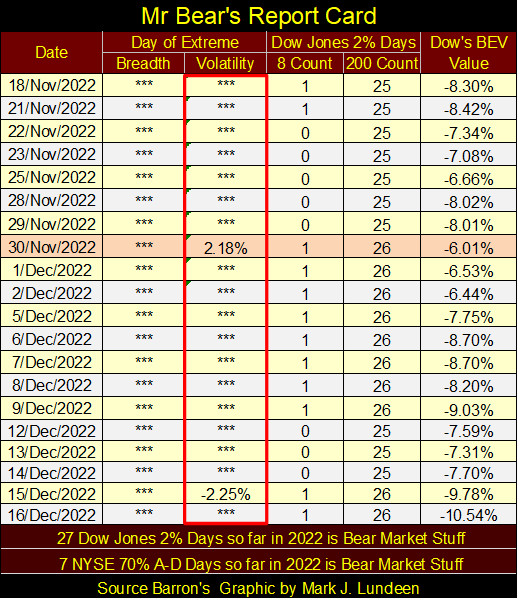
So far in 2022, the Dow Jones has seen 27 days of extreme volatility; the dreaded 2% days. That’s a lot, something that happens in bear markets. During bull markets, we’d see between zero to maybe one per year at the most. We shouldn’t be surprised the Dow Jones last all-time high was on January 4th of this year, a high that for some reason the bulls have so far failed to exceed.
Rising bond yields and interest rates were key events for 2022. Look at the yield spike in corporate bonds below – wow! That spike began in early January, but began coming down in October / November.
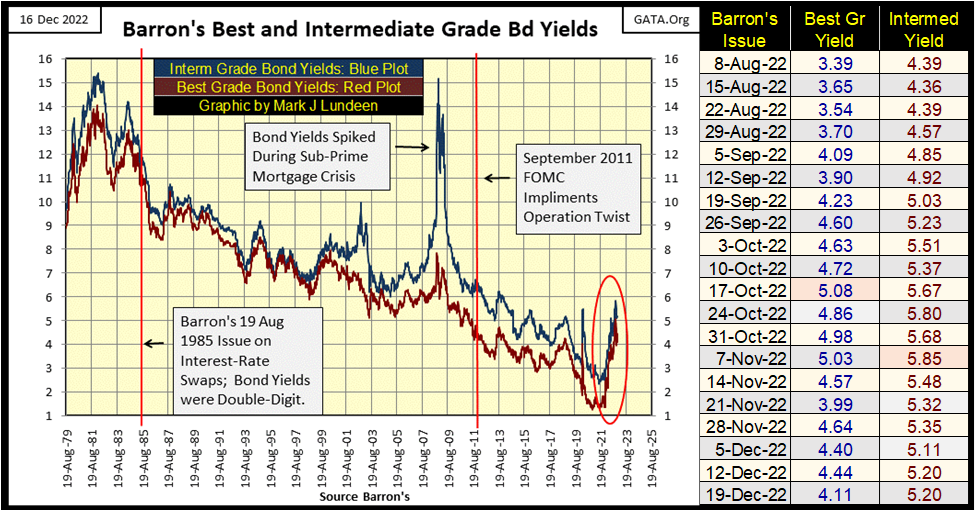
Most of my market commentary focuses on the stock market, or specifically the Dow Jones. But the bond market is the 800-pound gorilla in the room. And when the big ape in the bond market isn’t happy, the bulls on Wall Street won’t be either.
Here’s a 30Y T-Bond issued in February 2020. In two months, it will have been trading for three years; three years-of-woe for anyone who bought it in February 2020. In October of this year, its market valuation (Blue Plot) was cut in half from its highs of April & August 2020. What kind of AAA Rated Investment does that?
Keep in mind, if this T-bond is doing this, then so is every other T-bond. The T-bond market is basically the American national debt being traded daily in New York. This week, America’s national debt was reported to be 31,319 billion dollars. Someone with half that sum could possibly buy the entire national debt of the United States. Which I take it to mean there isn’t a premium on the “Full Faith and Credit of the US Treasury” anymore.
Well, when we have the best Congress money can buy; stuff like this happens.
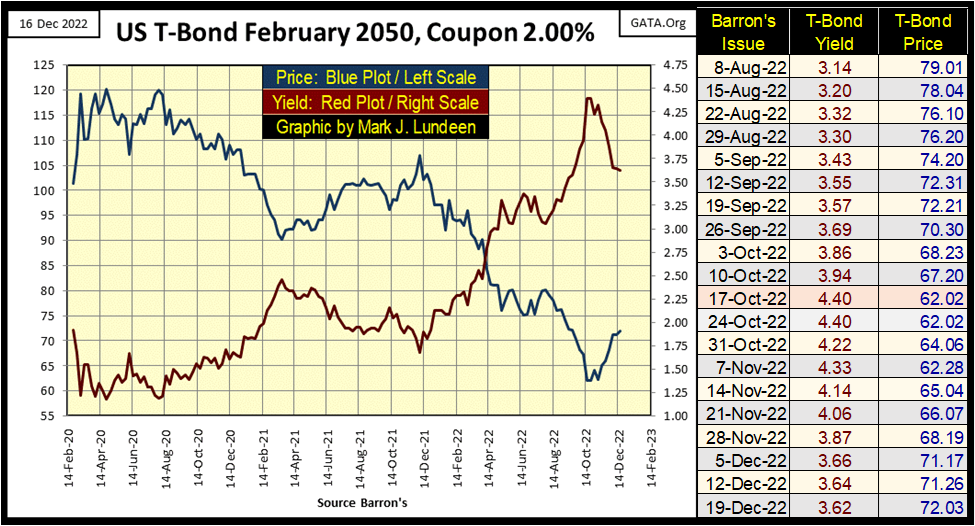
The bond market is coming off its lows of October, and have seen a nice rebound in valuations. But this rebound shouldn’t last much longer. I wouldn’t be shocked seeing this bond at new lows come this April or May 2023.
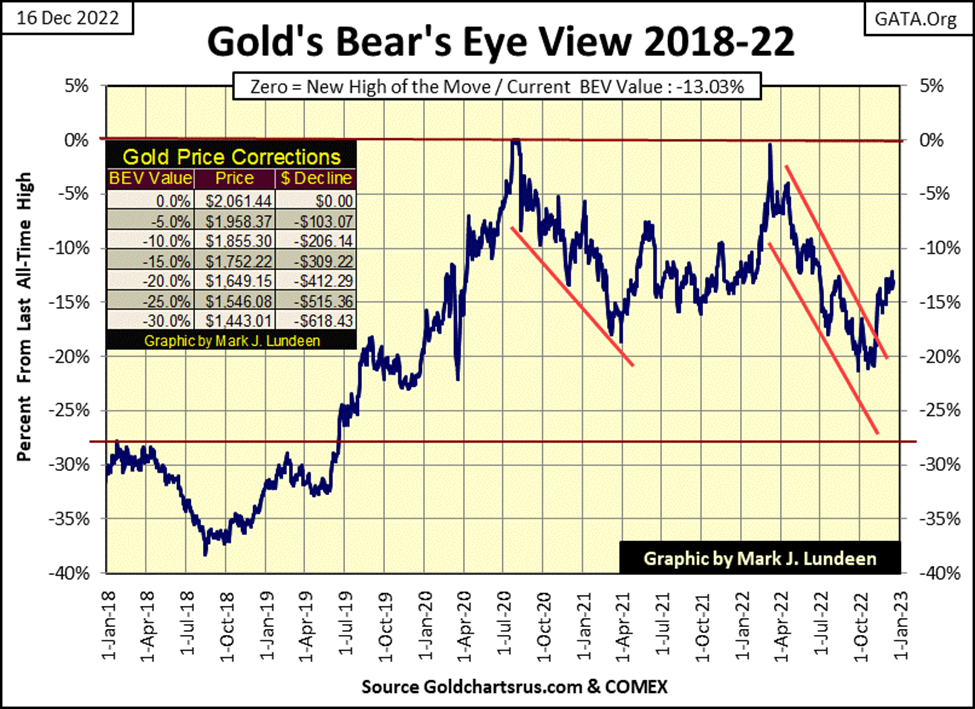
Let’s look at gold’s BEV chart below. What in the heck is going on here? Why does gold continue creeping towards its BEV -10% line, instead of fleeing for cover like a poltroon below its BEV -15% line? We’ve not seen a new all-time high for gold since August 2011. Are the bulls actually thinking they’ll make market history sometime in 2023?
I think there is a damn good chance gold will do exactly that. With the world in a damn mess;
- Politically,
- Economically,
- Military,
one day soon gold and silver might just catch a bid that will make market history. But like a whipped puppy, I still have my battered-bull syndrome, and most likely will until gold is a few hundred dollars above its highs of August 2011.
But look at where gold closed the week. With a BEV of -13.03%, its only 3% points from closing within 10% of its last all-time high of twelve years ago. It’s a pretty chart for gold below. One that suggests gold could see a big one-day surge in price in the not-too-distant future. Keep your fingers crossed!
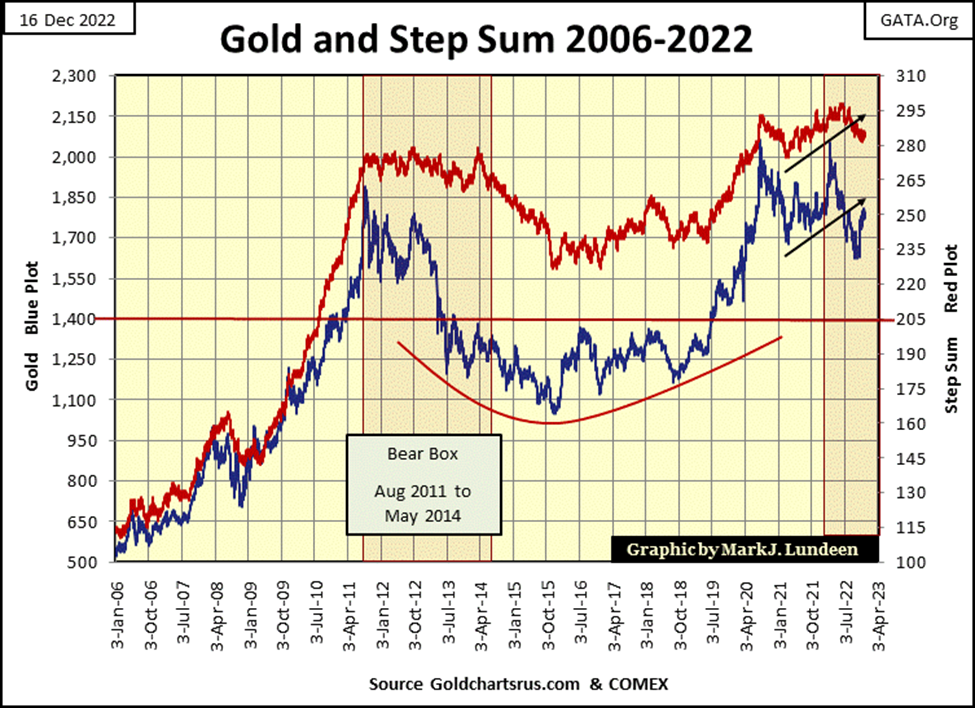
Here is gold’s step sum chart. With gold rising, and its step sum treading water around 285 since mid-October, there is an excellent chance that this bear box could be invalidated by seeing both gold and its step sum plots once again surge to the upside. That would be a very bullish development.
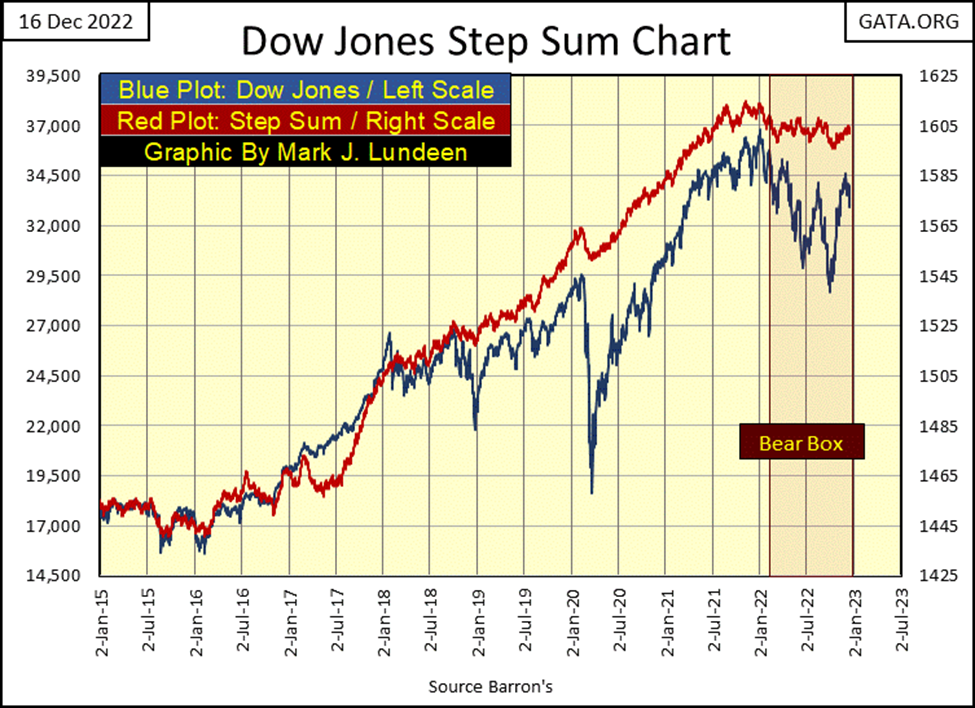
Here is the step sum chart for the Dow Jones. Like gold’s step sum chart above, a case can be made that the Dow Jones too could invalidate the bear box it now is in. And I’ve said exactly that a few times in the past. But after this week, I’m not so sure of that happening.
And if that doesn’t happen, but the bear box the Dow Jones is now in actually plays out as bear boxes typically do, that is a very bearish development for the stock market.
How do bear boxes typically play out? Look at the bear box gold found itself in from August 2011 to May 2014 in the chart above. When gold actually bottomed in December 2015, market sentiment was bleak. Of course, December 2015, when both gold and its step sum plots bottomed, was an excellent time to buy gold and silver, and the mining shares. But I got angry letters from my readers for saying that.
On gold’s side of the step sum table below, it’s the same old stuff I’ve been pointing out for the past two months. What we really need is a break out in the gold and silver market, one that gets gold’s step sum to once again advancing to something well over 300. But that may not happen until daily volatility in the gold market increases to something over 1% in the table below.
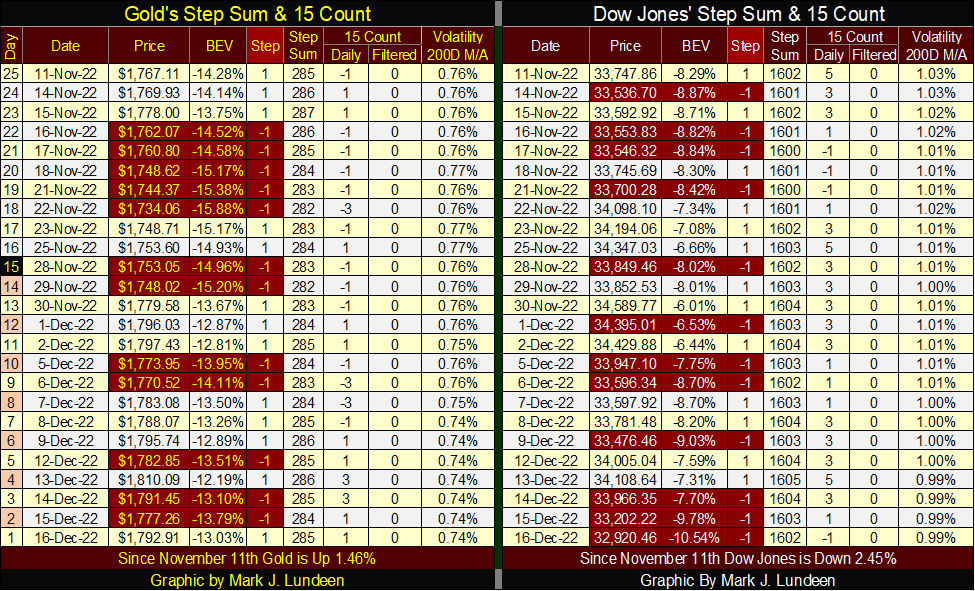
The Dow Jones almost became overbought (+7) on Tuesday’s close when its 15-count saw a +5. But the rest of the week took care of that, with the Dow Jones closing the week with a 15-count of -1.
The current market situation for both gold and the Dow Jones seems remarkably similar, as both are treading water, and have been for a while. It seems to me both markets are waiting for something to happen; a triggering event. And whenever that is, when that something happens, I expect to see precious metal assets to take off and the stock and bond markets to resume deflating.
__
(Featured image by Markus Spiske via Pexels)
DISCLAIMER: This article was written by a third party contributor and does not reflect the opinion of Born2Invest, its management, staff or its associates. Please review our disclaimer for more information.
This article may include forward-looking statements. These forward-looking statements generally are identified by the words “believe,” “project,” “estimate,” “become,” “plan,” “will,” and similar expressions. These forward-looking statements involve known and unknown risks as well as uncertainties, including those discussed in the following cautionary statements and elsewhere in this article and on this site. Although the Company may believe that its expectations are based on reasonable assumptions, the actual results that the Company may achieve may differ materially from any forward-looking statements, which reflect the opinions of the management of the Company only as of the date hereof. Additionally, please make sure to read these important disclosures.


Virginia Cannabis Market Could Reshape Regional Competition
Virginia’s planned recreational cannabis market could reshape the Washington region’s economic landscape. With nine million residents, it may draw consumers...


Bitcoin’s Price Drops as Investors Turn to Layer 2 Solutions
Bitcoin fell toward $63,000 after leveraged liquidations erased recent gains, while geopolitical tensions between the US and Iran pressured risk...


Emily.AI: Personalized Oxygen Therapy Earns Global AI Recognition
Emily.AI, Quirónsalud’s explainable AI medical device, became a global finalist at the AI for Good Summit 2026 after competing with...


Advanced Blockchain Under Pressure Amid Crypto Market Shifts
The crypto market shows diverging trends: Advanced Blockchain faces heavy pressure despite restructuring, weak finances, and ongoing transformation, though analysts...


Cannabis Regulation in Germany and Switzerland Shows Early Benefits of Legalization Models
Germany and Switzerland’s cannabis reforms suggest regulated access can reduce criminalization without increasing consumption. Germany saw fewer cannabis-related prosecutions, while...
 |
|
 |  |
 |
|
-

 Impact Investing1 week ago
ICSC Raises €500M Social Bond, Expanding Sustainable Investment Reach
-

 Fintech2 weeks ago
Swedish fintech Lysa is preparing to enter the European ETF market
-

 Fintech4 days ago
Withings Achieves Profitability in 2025 with 90% Growth Since 2018
-

 Biotech1 week ago
Circulating Tumor DNA Guides Chemotherapy Decisions in Colorectal Liver Metastases