Featured
Are we on the cusp of a runaway move?
Are we on the cusp of a runaway move? There is some evidence it is a distinct possibility. More and more the March 2020 pandemic collapse looks like October 1987. And if we are on the cusp of a runaway move then the March panic also looks like the collapse seen in 1998. Naturally the market still needs to break out to higher prices to give the possibility some credence.
It’s going to be the “Roaring Twenties” all over again. Party like its 1999. Yes, the stock market boom is coming! Wait. We thought it had already been booming since the pandemic panic of March 2020! After all, we are up 69% since that fateful low in March 2020 (S&P 500). And that has occurred against the backdrop of over 76 million cases of COVID-19 and almost 1.7 million dead. The U.S. alone accounts for over 18 million cases and over 320 thousand dead. Poverty has gone up, food lines have formed, evictions and the resultant homelessness have grown, tent cities proliferate, and stealing of food has gone up. But if you are in the stock market, it has been caviar and champagne.
What to make of all of this? Pundits have been calling it the K recovery. Wall Street up! Main Street down! How can that be? Even during the 1930s, both suffered. Main Street saw unemployment lines, train-hopping, shanty towns, a dustbowl, bank failures, foreclosures, and homelessness. Wall Street watched their stock portfolio evaporate, down 89% from 1929–1932. March 2020, despite taking out the previous year’s lows, is starting to look more and more like October 1987—rapid, severe, but short-lived. In 1987 the Dow Jones Industrials (DJI) fell 36.1% but it was all over in 55 days. March 2020 fell further (DJI down 38.4%) but was even shorter (39 days). The 1987 crash took two years until October 1989 before the DJI regained the August 1987 high. This time it took only eight months to regain the February 2020 high. Happy days are here again! The stock market has made a V recovery. As to the rest of the economy, it is an L recovery, a growing depression.

The 1987 crash was interesting because it was short and frightening. Everyone thought we were on the cusp of the next depression. Instead, it proved to be merely a pause in the context of a long bull market that started in 1982 and lasted until 2000, a period of 18 years. Between 1982 and 2000 there were only four corrections of note (DJI): 1984 (-15.6%), 1987 (-36.1%), 1990 (-21.2%), and 1998 (-19.3%). So far, this time around we have already had four corrections of note: 2011 (-16.8%), 2015/2016 (14.5%), 2018 (-19.1%), and 2020 (-38.4%).
The rise so far for the markets since 2009 has seen a steady climb. From 1982 to 2000 the DJI rose over 1,400%. So far, from 2009 the rise has only been 368%. In terms of bull markets this one has been slightly below average. The 1921–1929 bull saw the DJI rise about 500%. The 1949-1966 bull market saw a gain of 510%. It is only that 1982–2000 bull that has really stood out. The greatest bull market in history?
There is some evidence now that the stock market could move into overdrive. The stock market is anticipating the end of the COVID-19 as the vaccinations ramp up. Okay, maybe 2021 Q1 won’t be so good, but things could be better in Q2 and Q3 and Q4 could soar. By the latter part of the year people should be returning to the restaurants, the bars, the sports venues, concerts, and more. Interest rates are going to remain low forever and the Fed (central banks) is going to keep pumping liquidity into the financial system through QE and the Treasury (all governments) are going to keep pumping out the support payments so that the economy doesn’t completely collapse. The debt be damned.
Of course, not all sectors will benefit in a recovery. As David Rosenberg of Rosenberg Research (www.rosenbergresearch.com) wrote, the world will be different when we come out of this. Things look good for e-commerce, delivery services, cloud services, internet (high-tech) infrastructure, video conferencing, consumer staples, and health care, but they look negative for commercial real estate, auto industry, and travel. And the hospitality sector might not recover as everyone thinks it will. Will there be any restaurants and bars left after this devastation? Will we ever be able to go to a sports venue again? All of this is currently being priced into the market and that is a driver in sending this market to new heights. That low interest rates and oodles of liquidity help is beside the point.
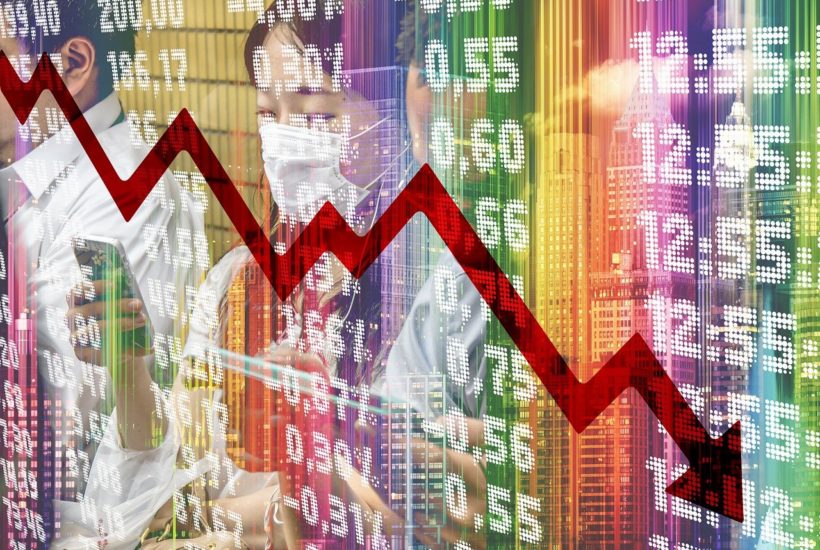
The new reality, however, is encapsulated in the pictures below. Not quite the dirty thirties. Note the older guy in the business suit. Older workers may have a much harder time recovering from this.
See images below


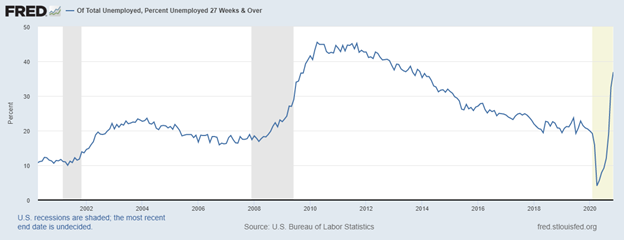
The problems on Main Street are probably going to get worse before they get better. Already we are seeing that. Initial employment claims rose again this past week to 885 thousand up from 862 thousand the previous week. Long-term unemployment (over 27 weeks) is rising. Retail sales fell 1.1% in November. Isn’t it supposed to be Christmas? They should be soaring. But that is only a part of it.
Besides the initial claims, there are also applications for unemployment assistance via temporary programs. The labour department reported there were an additional 455 thousand applying for Pandemic Unemployment Assistance (PUA). Overall, there are some 20.6 million Americans receiving some kind of unemployment benefits. A stimulus package is coming, but the push from the Democrats is more and from the Republicans less. Meanwhile, evictions and homelessness rise. The rising numbers bode ill for the December nonfarm payrolls and unemployment report due out January 8, 2021. The number of unemployed 27 weeks or longer keeps on rising. It probably hasn’t peaked yet. Will it take out the highs seen in 2010? A very good possibility. Against this background it is no surprise to discover the personal savings rate that soared following the initial round of stimulus cheques is plunging quickly.
Share of unemployed in U.S. that have been unemployed 27 weeks or longer
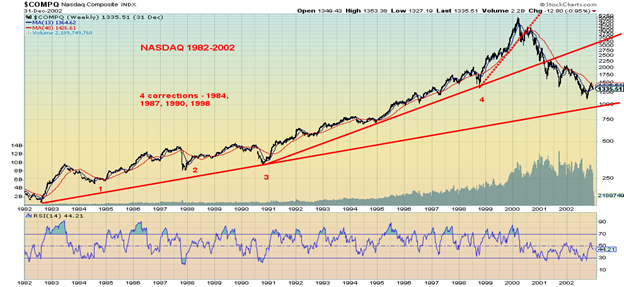
However, the stock market appears impervious to all of this. The stock market is looking post-vaccine. And they like what they see. But does it take into consideration things like—will the vaccine work, will there be no negative side effects, will the roll-out be as smooth as everyone would like to believe it will? What if the coronavirus morphs into a deadlier strain that the vaccine doesn’t combat? What then? We could have the zombie recovery. Sure, we have the vaccine, but everybody went bankrupt before we got there. We are showing two long-term charts below. The first chart is the NASDAQ from 1982-2002. The second chart covers the NASDAQ 2009 to present.
On both we have numbered 1–4 the corrections that were 15% or more. What stands out? After the 1990 correction the NASDAQ started to move higher at a steeper rate. Coming out of the 1998 collapse the NASDAQ accelerated, culminating in the bubble that topped in March 2000. That final thrust saw the NASDAQ gain 278% from 1998–2000. Note also how volume increased substantially during the final thrust. The entire period 1982–2000 was made on a sea of liquidity being provided by the monetary authorities. This was especially true after the 1987 stock market crash and the 1998 Russian/Long-Term Capital (LTCM) crash. Interest rates were also lowered. Sound familiar?
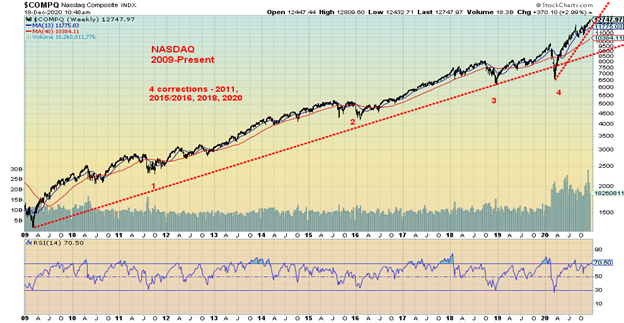
The markets have been on a steady upward trajectory from the final low of the 2007–2009 financial crisis crash. Again, we note the four corrections to date. Given that the markets have soared almost without interruption from the March pandemic crash, we are now wondering whether that crash was the previous period’s 1998 crash. Massive amounts of liquidity are being provided by the monetary authorities, while interest rates are being held artificially low and will remain that way for years. A 278% runup this time could take the NASDAQ to 25,000, a double from current levels. Note as well the increase in volume out of the March pandemic crash low, not unlike what happened coming out of the 1998 crash. At today’s levels the market is at only about June/July 1999, just before the market really accelerated into the March 2000 top.
We can’t help but notice that the S&P 500 is trying to push through 3,700, a level we have considered crucial to successfully breach if we were to go higher. It is not conclusive yet. Similarly, the NASDAQ is trying to push through 12,750. Again, there are no conclusions we can make. We could be at a make-or-break level. Volumes remain unusually higher than normal through the holiday period. Next week, we are also moving into the period that sparks the “Santa Claus Rally” and the beginning of the “January Effect.” The DJI remains short of a breakthrough similar to the S&P 500 and NASDAQ. This past week the Dow Jones Transportations (DJT) did not make new highs. But it is only one week. The TSX is getting closer to new highs and the TSX Venture Exchange (CDNX) makes regular new 52-week highs as does the S&P 600 (small cap) and Russell 2000 (small cap). Those are all positive signs that to support our suggestion that we could embark on a runaway move. But just in case, keep raising stops. Nothing is guaranteed.
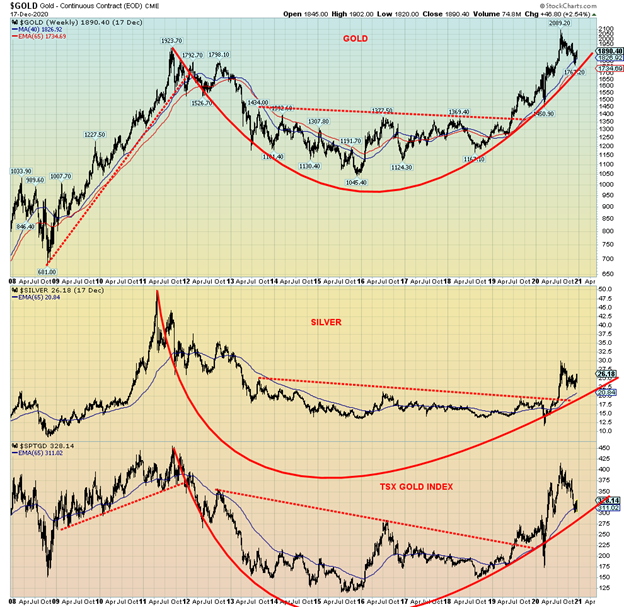
What about gold, silver, and the gold stocks? As we have previously noted, they all broke out of multi-year consolidation patterns. Gold broke out in June 2019, the gold stocks (represented here by the TSX Gold Index (TGD)) broke out in July 2019, and silver the laggard finally broke out in July 2020. The rounding patterns they broke out from all have measuring implications. Gold could rise to $2,200 (high so far $2,089), silver to at least $32 (high so far was $29.92) but the ultimate target could be $65, and the TGD to at least 475 (high so far has been 417). Higher targets could be seen, especially if the initial targets were taken out.
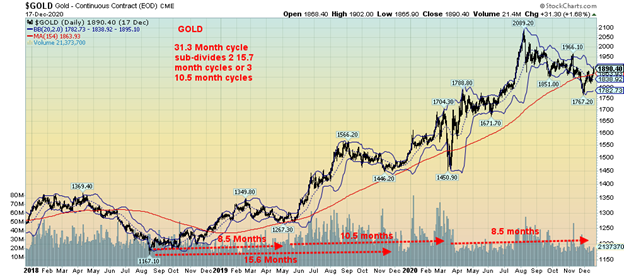
We have often noted Gold’s cycles. These cycles are reasonably predictable. One of the shorter cycles we have noted is a reasonably good 31.3 monthly cycle. The August 2018 low for gold was the first 31.3-month cycle low following the 7.83-year cycle low of December 2015. That low came 32 months after the December 2015 low. The 31.3-month cycle breaks down further into either three 10.4-month cycles or two 15.7-month cycles, often both. One has to give the 10.4-month cycle at least two months either side and the 15.6-month cycle at least three months either side. So, what have we seen? 8.5 months following the August 2018 low we had good low that could be attributed to either April or May 2019. The low came 8.5 months after the August 2018 low. 10.5 months later we had the March 2020 low and 8.5 months later we may be making an important low in December 2020. This one is not yet confirmed. A firm breakout above $1,925/$1,950 would go a long way to confirming a low.
We also saw an important low 15.6 months following the August 2018 low in November/December 2019. This gives rise to the thought that both the 10.4-month and 15.7-month cycles are at work. December 2020 is only 13 months from the November 2019 low but it is within range for the 15.7-month cycle low. If that’s correct, then a significant rally could get underway now for gold. However, we could see a low sometime into March or April 2021 and a low in September/November 2021. Following that low the third and final phase of the 31.3-month cycle could get underway. The next 7.83-year cycle low is due to bottom in February 2023–June 2024. That would most likely also coincide with the 23–25-year cycle low last seen in 2001.
If we are correct about gold’s cycles, this next phase could see a runaway move in conjunction with the stock market. This is a presumption until gold (and silver) take out key points to the upside. For gold, the first points are $1,925/$1,950 but the final point that would tell us new highs lie ahead is at $2,015. For silver, they broke through one key point this past week at $25. But more important is breaking above $27. Above $28 new highs are probable. All of this is premised on the basis we do not see any new lows below $1,767 gold or $21.82 silver.
We can’t help but note that the U.S. dollar is falling. The US$ Index has targets down to 88 (currently 89.95). What is ailing the U.S. dollar? Record pandemic numbers with negative effects on the economy and a political system in turmoil appear to be two key elements. That’s why it seems odd that the U.S. stock market could be soaring. But the positive effects of massive amounts of liquidity and ultra-low interest rates are the fuel that sparks the stock market—plus, money fleeing other jurisdictions where the political situation may be even more tenuous. Massive hacks on the U.S. computer networks are also disturbing, although major powers spying and hacking each other is not unusual as all partake in what is effectively a modern version of Game of Thrones.
Main Street is beginning to feel like 1930. Wall Street feels like 1999. One goes down; the other goes up. Overvaluation is merely a state of mind. A depression is for the little people. Will Main Street begin to resent Wall Street and revolt? Massive income and wealth inequality have a way of triggering revolutions or civil wars. The stock market may go into a 1999–2000 NASDAQ blow-off. But what happens when the hangover hits? The 2020s may not be so roaring after all.

MARKETS AND TRENDS
| % Gains (Losses) Trends | ||||||||
| Close Dec 31/19 | Close Dec 18/20 | Week | YTD | Daily (Short Term) | Weekly (Intermediate) | Monthly (Long Term) | ||
| Stock Market Indices | ||||||||
| S&P 500 | 3,230.78 | 3,709.45 (new highs) | 1.3% | 14.8% | up | up | up | |
| Dow Jones Industrials | 28,645.26 | 30,179.05 (new highs) | 0.4% | 5.8% | up | up | up | |
| Dow Jones Transports | 10,936.70 | 12,566.07 | (0.8)% | 15.3% | up | up | up | |
| NASDAQ | 9,006.62 | 12,755.64 (new highs) | 3.1% | 42.1% | up | up | up | |
| S&P/TSX Composite | 17,063.53 | 17,534.63 | (0.1)% | 2.8% | up | up | up | |
| S&P/TSX Venture (CDNX) | 577.54 | 816.20 (new highs) | 4.6% | 41.3% | up | up | up | |
| S&P 600 | 1,021.18 | 1,108.16 (new highs) | 2.0% | 8.5% | up | up | up | |
| MSCI World Index | 2,033.60 | 2,127.09 (new highs) | 1.8% | 4.6% | up | up | up | |
| NYSE Bitcoin Index | 7,255.46 | 22,470.87 (new highs) | 24.4% | 209.7% | up | up | up | |
| Gold Mining Stock Indices | ||||||||
| Gold Bugs Index (HUI) | 241.94 | 303.38 | 4.0% | 25.4% | neutral | neutral | up | |
| TSX Gold Index (TGD) | 261.30 | 322.36 | 3.7% | 23.4% | neutral | down (weak) | up | |
| Fixed Income Yields/Spreads | ||||||||
| U.S. 10-Year Treasury yield | 1.92 | 0.94 | 4.4% | (51.0)% | ||||
| Cdn. 10-Year Bond yield | 1.70 | 0.75 | 5.6% | (55.9)% | ||||
| Recession Watch Spreads | ||||||||
| U.S. 2-year 10-year Treasury spread | 0.34 | 0.82 | 5.1% | 141.2% | ||||
| Cdn 2-year 10-year CGB spread | 0 | 0.50 | 11.1% | 5,000.0% | ||||
| Currencies | ||||||||
| US$ Index | 96.06 | 89.95 (new lows) | (1.1)% | (6.4)% | down | down | down | |
| Canadian $ | 0.7710 | 0.7820 (new highs) | (0.2)% | 1.6% | up | up | up | |
| Euro | 112.12 | 122.61 (new highs) | 1.2% | 9.3% | up | up | up | |
| Swiss Franc | 103.44 | 113.24 (new highs) | 0.8% | 9.5% | up | up | up | |
| British Pound | 132.59 | 135.22 (new highs) | 2.3% | 2.1% | up | up | up | |
| Japanese Yen | 92.02 | 96.79 | 0.7% | 5.2% | up | up | up | |
| Precious Metals | ||||||||
| Gold | 1,523.10 | 1,888.90 | 2.5% | 24.0% | up | up (weak) | up | |
| Silver | 17.92 | 26.03 | 8.1% | 45.3% | up | up | up | |
| Platinum | 977.80 | 1,043.10 | 2.1% | 6.7% | up | up | up | |
| Base Metals | ||||||||
| Palladium | 1,909.30 | 2,372.0 | 1.7% | 24.2% | up | up | up | |
| Copper | 2.797 | 3.63 (new highs) | 2.9% | 29.8% | up | up | up | |
| Energy | ||||||||
| WTI Oil | 61.06 | 49.24 | 5.7% | (19.4)% | up | up | down (weak) | |
| Natural Gas | 2.19 | 2.70 | 4.3% | 23.3% | down | up | neutral |
__
(Featured image by geralt via Pixabay)
DISCLAIMER: This article was written by a third party contributor and does not reflect the opinion of Born2Invest, its management, staff or its associates. Please review our disclaimer for more information.
This article may include forward-looking statements. These forward-looking statements generally are identified by the words “believe,” “project,” “estimate,” “become,” “plan,” “will,” and similar expressions. These forward-looking statements involve known and unknown risks as well as uncertainties, including those discussed in the following cautionary statements and elsewhere in this article and on this site. Although the Company may believe that its expectations are based on reasonable assumptions, the actual results that the Company may achieve may differ materially from any forward-looking statements, which reflect the opinions of the management of the Company only as of the date hereof. Additionally, please make sure to read these important disclosures.


Abivax Shares Surge as New Trial Data Eases Safety Concerns Over Ulcerative Colitis Drug
Abivax shares surged nearly 36% after positive updated trial results for its ulcerative colitis drug obefazimod reassured investors following earlier...


El Dorado Raises $9M to Expand Cross-Border Fintech Platform
El Dorado, a Latin American fintech improving cross-border financial services, raised a $9 million Series A led by Paradigm with...


Bitcoin Stalls Near $60K as Strategy Moves, ETFs Outflow, and EU MiCA Rules Take Effect
Bitcoin hovers near $60,000 with ETF outflows, while Strategy boosts reserves, sells BTC, and raises dividends to reassure investors. Ethereum...


Cannabis Dominates Global Drug Use: Trends, Risks, and Shifting Markets
Cannabis remains the world’s most widely used illicit drug, with 256 million users in 2024, surpassing all others combined. Growth...


Italy Approves First Hydrogen-Powered Train for National Rail Network
ANSFISA has approved Italy’s first hydrogen-powered train, the Alstom HMU214, for use on the Brescia–Iseo–Edolo line. Capable of 140 km/h,...
 |
|
 |  |
 |
|
-

 Markets1 week ago
Cocoa Market Faces Mixed Trends Amid Rising Supply and Weak Demand
-

 Africa6 days ago
Bank of Africa Expands Sino-African Trade Partnerships in Beijing
-
 Biotech2 weeks ago
Bavarian Biotech Sector Expands with Record Funding and Startup Growth in 2025
-

 Africa2 days ago
BOAD Approves Major Funding Boost to Drive West African Development