Business
At This Week’s Close, the Dow Jones Was Much Closer to its 52Wk Low Than its 52Wk High Line
It’s been nine months since the Dow Jones made its last 52Wk high, which was also its last all-time high. So, is the Dow Jones fated to once again push its 52Wk line upwards again, which as a bull one must be expecting. Or, in early January of next year, is the Dow Jones 52Wk line destined to once again begin falling down towards the deflating Dow Jones, which is the bear’s view of the market.
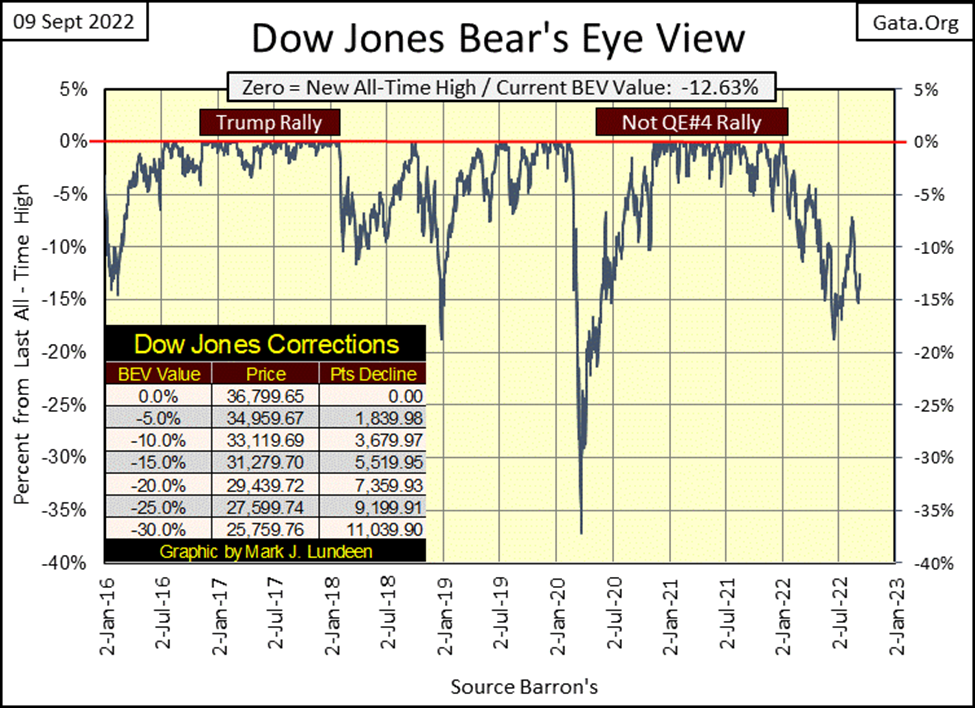
This week the Dow Jones lifted up a bit from its BEV -15% line, closing with a BEV of -12.63%. What exactly does that mean? In a BEV plot, all new all-time highs are reduced to 0.00%, and never more at the Red BEV Zero (0.0%) line. Any daily closing in the BEV chart below, that are not a new all-time high, registers as a percent claw-back from their last BEV Zero (last all-time high). So, this week, the Dow Jones closed 12.63% from its last all-time high, which occurred last January 4th.
Just eyeballing the BEV plot, this week the Dow Jones closed halfway between its low of June 17th, and high of August 16th. It goes without saying how in the weeks to come, the Dow Jones will eventually break above or below one of these two important levels.
I’m no longer of the opinion that the FOMC plans to inflate the Dow Jones’ valuation to a new all-time high before the November election, so right now I’m feeling bearish. Therefore, I’m expecting the Dow Jones will next break below its low of last June. But even if the Dow Jones breaks above its recent highs of August, and goes on to new all-time highs, I’m still a long-term grizzly bear on the stock market.
Why that is can best be seen below, where I’ve plotted the Dow Jones daily values from January 1900 to this week’s close. Since August 1971 (Red Star), when the US Government took the dollar off the Bretton Woods’ $35 gold peg, the FOMC, with its unrelenting monetary inflation, has inflated a historic bubble in the stock market, as seen in the Dow Jones below. Market history tells us with every boom, comes a bust. So, you have been warned.
The large Red Oval encloses the 2007-09 sub-prime mortgage bear market, which since 1885, was the second largest bear market, a 54% decline in the Dow Jones, exceeded only by the Great Depression Crash, an 89% decline in the Dow Jones. That the 2007-09 54% market crash appears below as only a market correction in a larger bull market advance, and the Great Depression’s 89% bear market bottom doesn’t even show up on the chart, tells us just how out of control the FOMC has been in “injecting” their “liquidity” into the financial markets for the past fifty years.
The smaller Red Circle marks the bottom of the March 2020 flash crash. The rebound in the Dow Jones off that bottom tells us how radical Fed Chairman Powell’s Not QE #4 was, pushing the Dow Jones to its last all-time high of 36,799 seen on January 4th of this year. In March 2020, had the Not QE #4 not been implemented, where would the Dow Jones be today? I’m thinking far below where it was in March 2020!
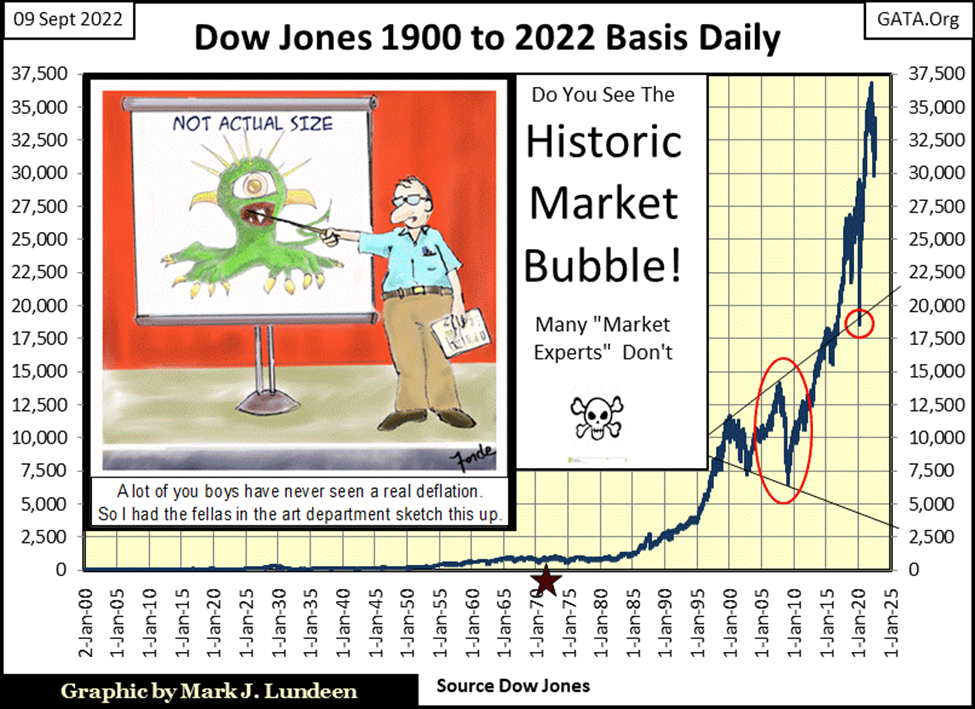
Powell, with his Not QE #4, was a solution to the market’s collapse in March 2020, but a short-term solution at best. The day is coming when either the Dow Jones above closes well below 5000, at best an 86% bear market bottom from last January’s close of 36,799, or the US dollar will become worthless from yet another QE from the FOMC. Either case is unattractive to investors. So, that is why I’m bullish on precious metals assets.
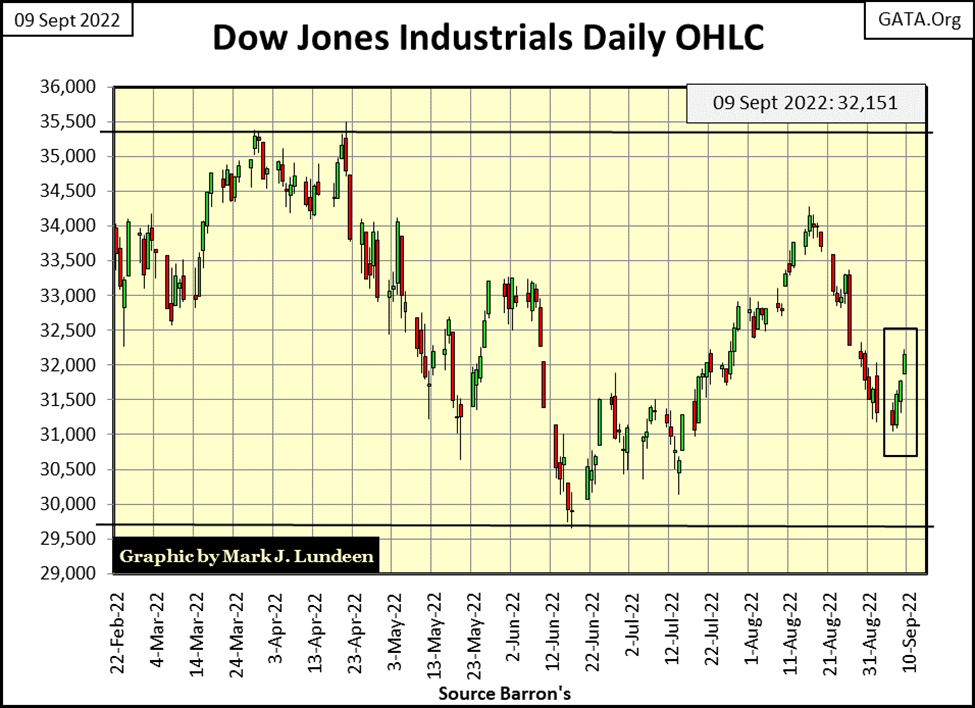
I have some more charts for the Dow Jones; in daily bars below. As in the BEV chart above, we see the important levels the Dow Jones will break above or below in the weeks to come, but in dollars, not BEV values. Should the Dow Jones close above its 34,000 level, that would be bullish. The level to watch on the downside would be 30,000.
I’ll be watching these levels closely, but like a horserace, I haven’t bet any money on. Like any market top; this is a market where being bullish offers massive risks to the downside while offering little in rewards to the upside.
One last chart for the Dow Jones, with its 52Wk high and low lines. At this week’s close, the Dow Jones was much closer to its 52Wk low than its 52Wk high line.
That plus, it’s been nine months since the Dow Jones made its last 52Wk high, which was also its last all-time high. So, is the Dow Jones fated to once again push its 52Wk line upwards again, which as a bull one must be expecting. Or, in early January of next year, is the Dow Jones 52Wk line destined to once again begin falling down towards the deflating Dow Jones, which is the bear’s view of the market.
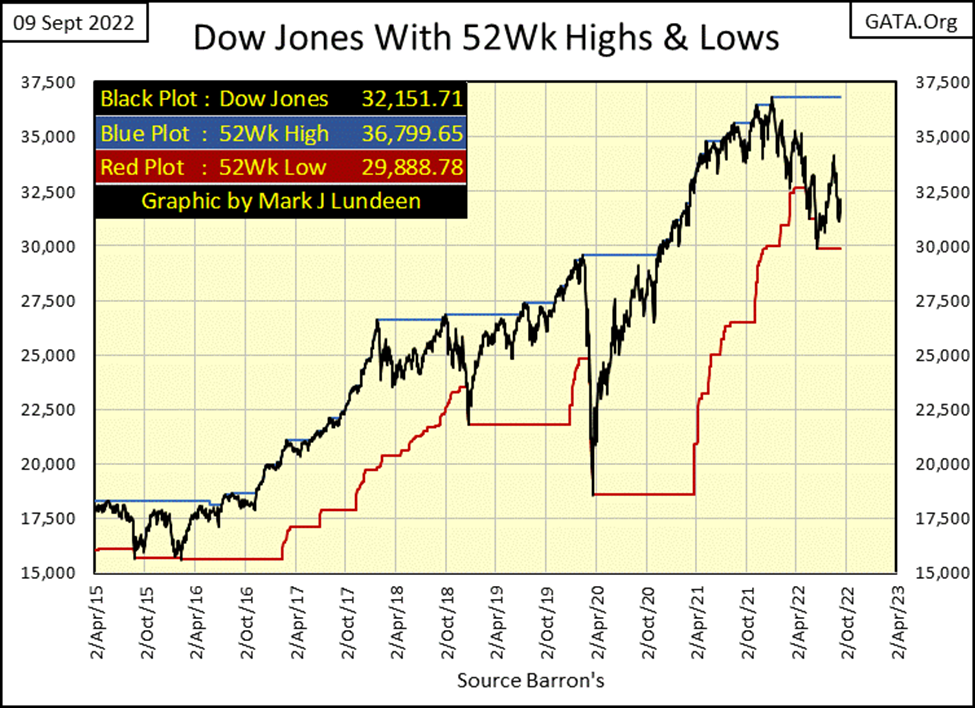
That’s a good question, a question that right now I don’t have a good answer to. But if the massive “injections of liquidity” from the FOMC’s Not QE#4 almost doubled the Dow Jones valuation since March 2020, what is going to happen when the FOMC drains “liquidity” from the financial system?
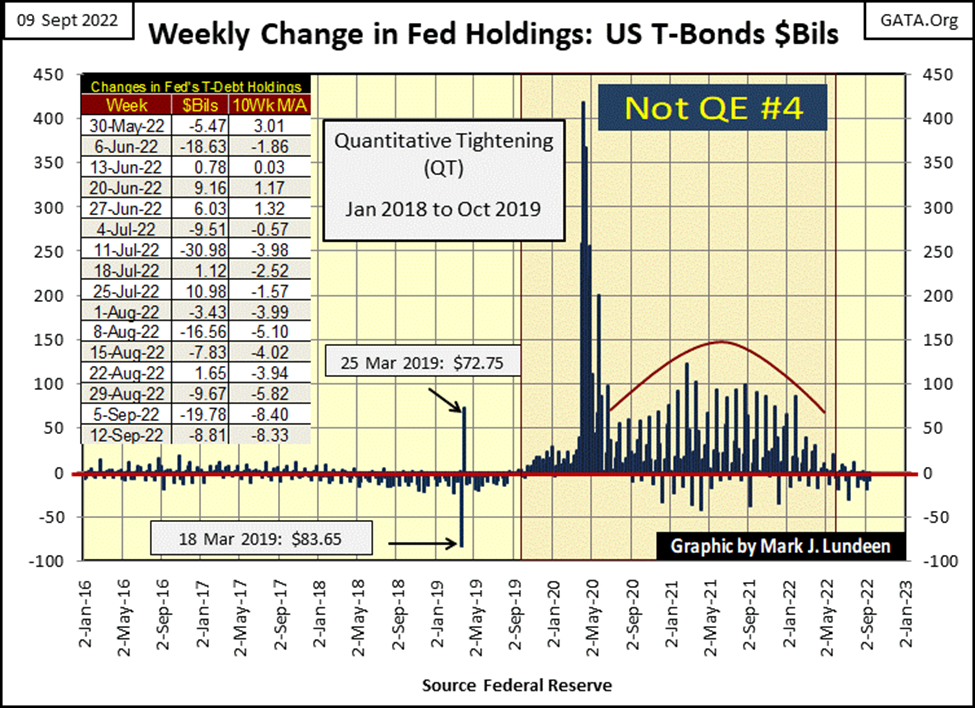
We’re going to find out, as that is exactly what they are doing right now. If you look at the table on the chart below, since Barron’s July 4th issue, the 10Wk M/A has been negative, meaning they are withdrawing “liquidity” from the financial system. Looking at the chart itself, the massive weekly “injections of liquidity” from the FOMC’s Not QE #4 are on display, and obviously a thing of the past. This rocket fuel for the bulls stopped last April. For the bulls, how could this be good?
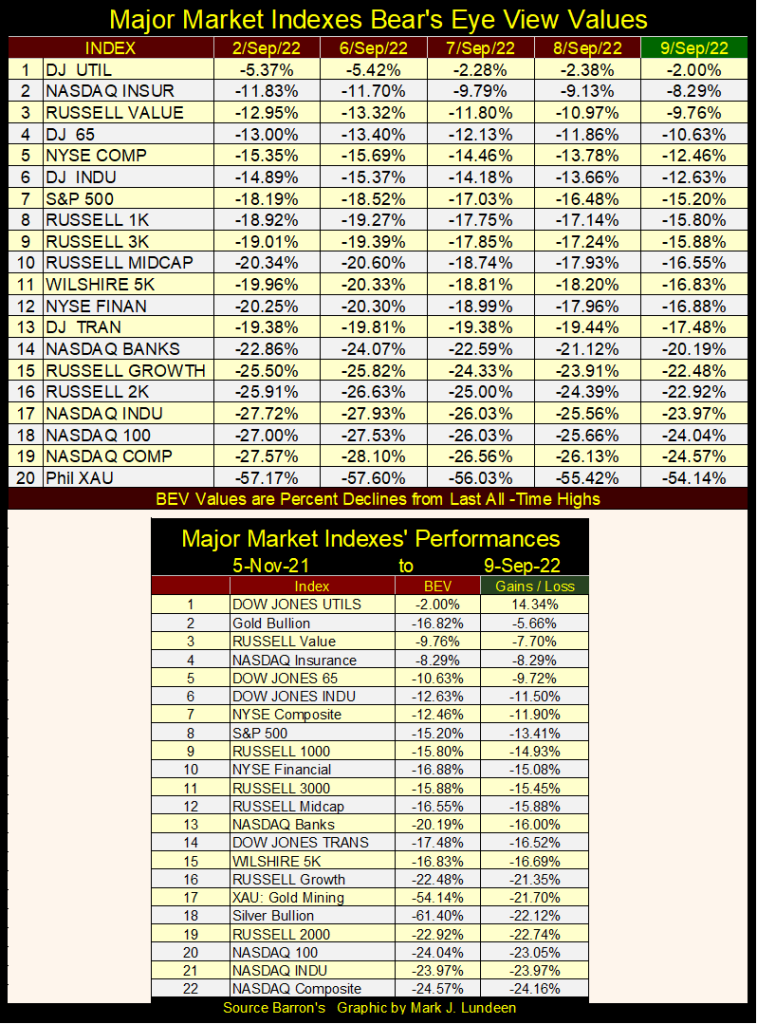
Here is my table listing the BEV values for the major market indexes I follow. All in all, it was a good week for the stock market, with many of the indexes below advancing 3%, or more from last week’s close.
But looking at the Dow Jones Utility Average (#1) how much more time must we wait until it sees a BEV Zero, a new all-time high? For much of last month, the DJ Util Ave daily closed in scoring position; less than 5% from its all-time high more times than not, teasing us that it would soon make a new all-time high. But somehow, the Utils just couldn’t make that happen.
This week the Utils closed with a BEV of -2.00%. There is nothing stopping it from making a BEV Zero sometime next week. It could happen, but I’m not holding my breath until it does.
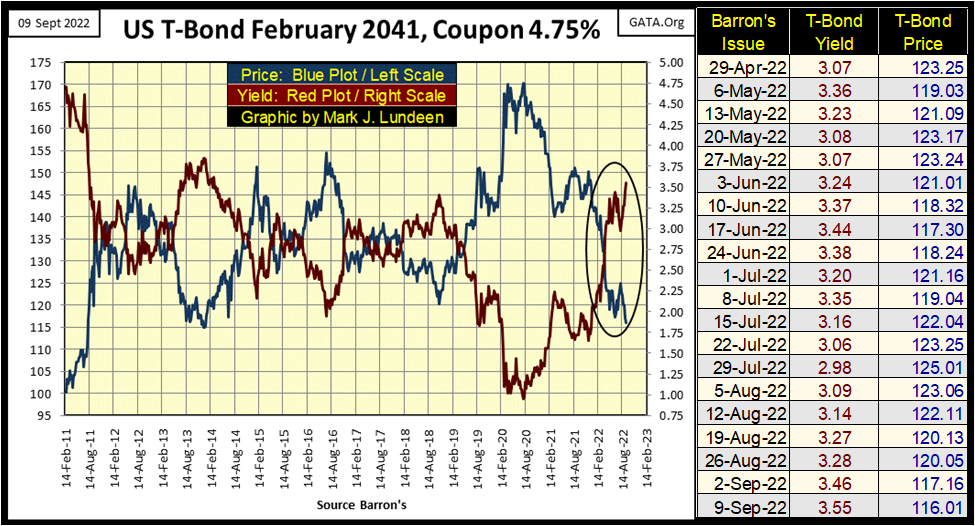
Bond yields continue rising, bond prices continue deflating, as seen in the chart below of a 30Yr T-bond issued in February 2011. Today, this 30Yr T-bond is actually a 19-year bond, as eleven years has passed since it was issued.
We have to go back to 2014 to see this bond’s yield and price at these levels. But back then, yields were falling as prices were rising. Since August 2020, when this bond’s price peaked, and yield bottomed, there have been Big Changes, painful changes in the Treasury bond market.
For someone who purchased this bond two years ago at 170, as it yielded 0.98%, they’ve taken a 32% loss in valuation on this T-bond in the past two years, as it returned less than 2% in coupon income. T-bonds; the investment of choice of widows and orphans aren’t supposed to do that. But there it is.
It’s only going to get worse as the idiot savants at the FOMC continue raising interest rates, and dumping their bonds held for reserves on the Federal Reserves’ balance sheet into the bond market.
Now tell me again you “market experts”, how rising yields make bonds more attractive.
Mortgage rates too continue rising, the chart below. Since January 2021, when mortgage rates saw a forty-year low (2.65%), this week they increased to 5.89%, a thirteen-year high. What’s next? Are mortgage rates at the top, or will they continue rising from these levels?
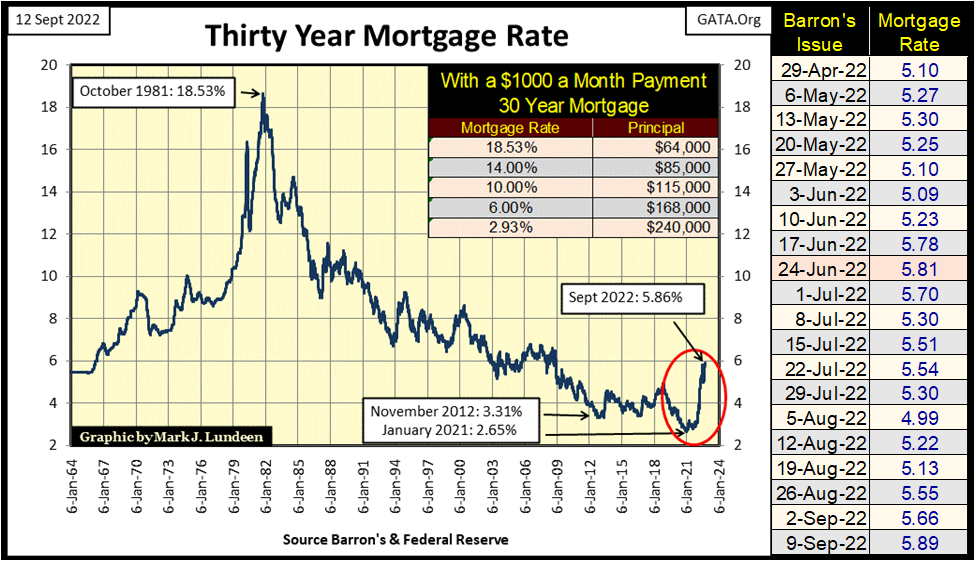
As a market enthusiast, I don’t understand this market. Like any other market, even markets being actively manipulated, prices are fixed by supply and demand fundamentals. I understand where the supply of mortgages come from; from “liquidity injected” into the housing market by the FOMC. But where is the market’s demand for these mortgages coming from?
Once, before the sub-prime mortgage market crashed in 2007-2008, there was an active secondary market for mortgages, where pension funds and insurance companies, as well as mutual funds retired people purchased for income bought and sold mortgage they held in their reserves.
Mortgages were very attractive, as their collateral was a single-family home. The vast majority of homeowners took great care in servicing their mortgage, if for no other reason than to keep themselves and their family from becoming homeless.
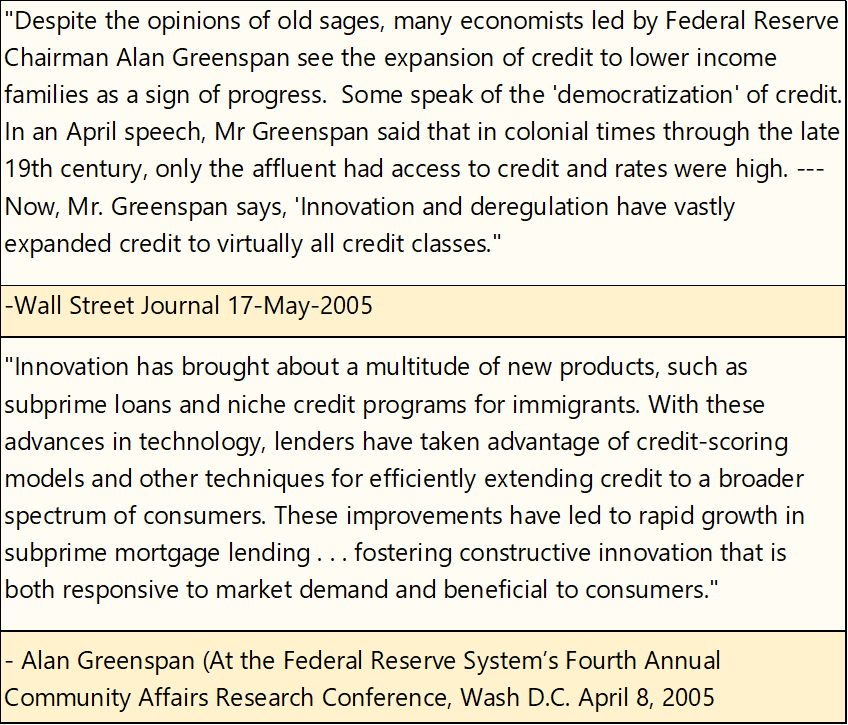
But then Wall Street began finding ways to maximize their profits in the mortgage market, and “politically correct” (aka Woke) politicians began decrying how the poor in America’s inner cities were being left out of the then housing bull-market. As the housing market is a heavily “government-regulated” market, and Wall Street discovered ways to “spread market risks to those best able to bare them”, via the then newly devised derivatives, it was decided by the powers-that-be, that allowing the chronically unemployed access to a $250K mortgage was an acceptable risk.
Then in 2008, the day came when the global financial system began gagging on American single-family mortgages, and their secondary market became extinct overnight, as demand for American mortgages went to zero.
Maybe I missed something, that in the years since the sub-prime mortgage market debacle of 2007-09, demand by pension funds and insurance companies for mortgages has once again arisen. But I don’t think so. So, where is the demand for American mortgages coming from?
Most likely from the Federal Reserve. In their weekly Factors Affecting Reserves Balances Report (H.4.1), there’s a line item for mortgages, which this week reported $2.71 trillion in mortgages on the Fed’s Balance Sheet. If the FOMC wanted to sell a portion of their portfolio of mortgages, who would they sell them too? So, is the American mortgage market today, a market where both it’s supply and demand fundamentals are 100% dependent on a central bank; the Federal Reserve?
As best as I can tell, that seems to be the case. Such are the ways of haute financing in 2022, and nothing good will come from it.
Here is my chart plotting the averaged indexed values to the nineteen commodities I follow weekly. It’s obvious Fed Chairman Powell’s Not QE#4 in March 2020 instigated the latest bout of consumer price inflation. This surge in consumer prices peaked last February, and in the last seven months has seen a retracement.
In the table we see the drivers of this surge in consumer prices. Ignoring the stock indexes, which are not part of this commodity average (#1,3,4 & 24), energy and metals are driving our current consumer price inflation, as per the nineteen commodity prices I follow, which I admit is a small sample of possible inputs.
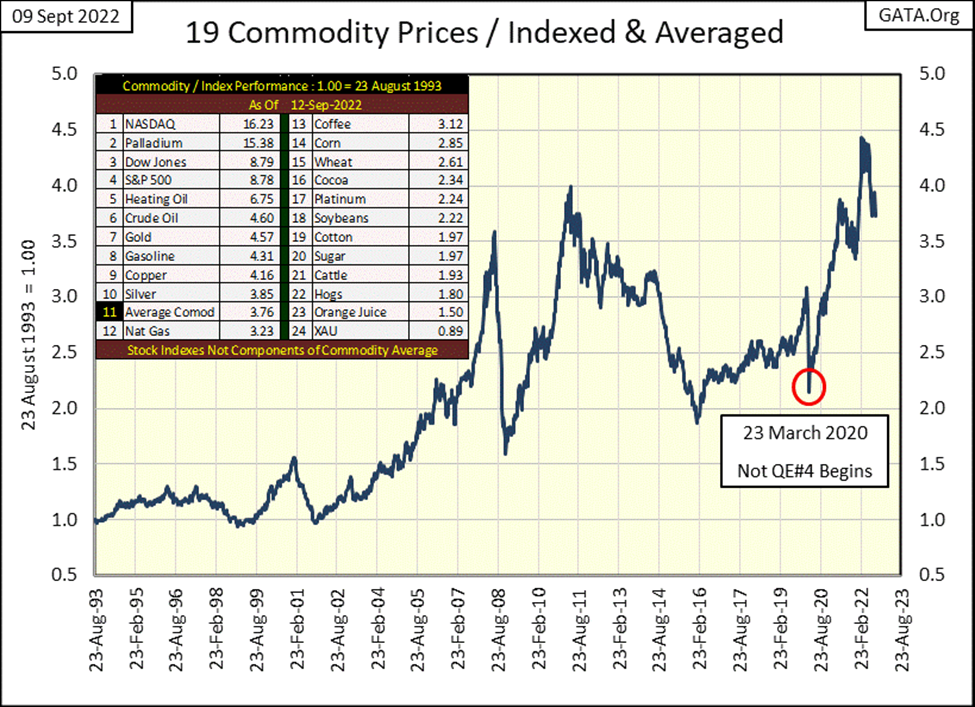
I expect the rise in commodity prices seen above will continue to be subdued until sometime after the November election. Just a guess. Though the long term, rising consumer prices will become a fact of life accepted by all. That isn’t good for the stock or debt markets, but will be for speculators in commodities.
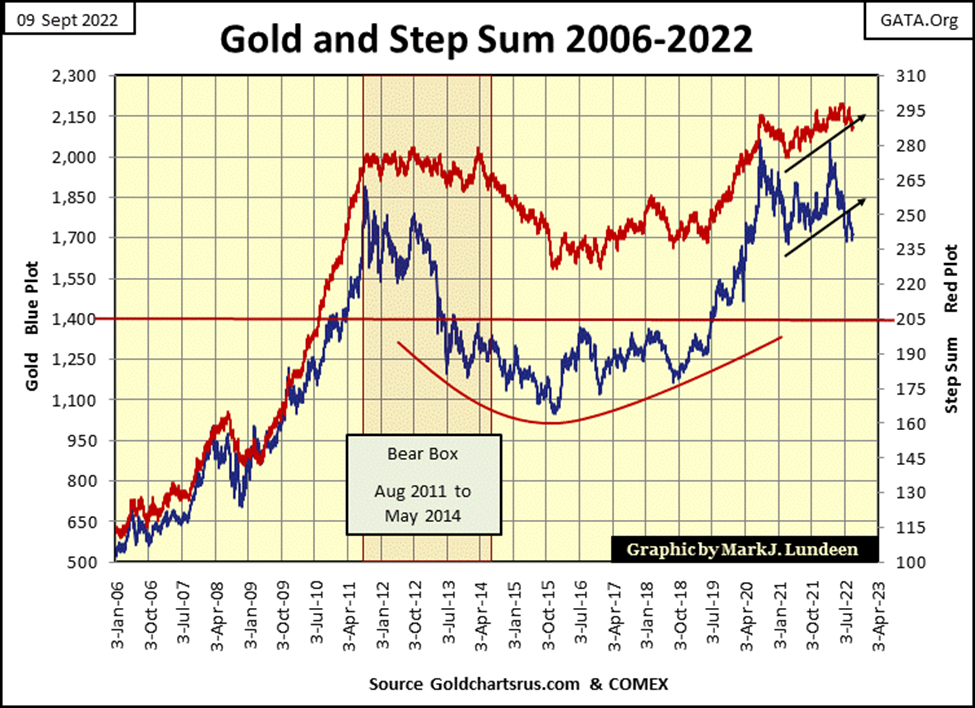
Making this a good time for looking at gold’s BEV chart below. This week I used a BEV chart going back to 1999, which displays more nuance for the advance in gold since July 1999.
Gold is a volatile market. When gold began its current advance in July 1999, it regularly saw 20% plus corrections up to its BEV Zero of August 2011. Just before the bottom fell out of the gold market in September 2011; gold had increased from $253.70 on 19 July 1999, to $1888.70 on 22 August 2011. A twelve-year, 644% advance, during which were seen corrections as deep as 30% in October 2008.
Then came a nasty four-year market correction, one that took gold down to its BEV -45% line in December 2015. At this December 2015 bottom, gold (silver too) became just another dirty four-letter words as far as most investors were concerned. As is so typical, most retail-gold bulls purchased gold near its 2011 top, and sold before its 2015, 45% bottom, and I’d bet most have yet come back into the gold market.
Gold then resumed it bullish ways in 2016, but at the time didn’t feel like it. During the next two years, twice it attempted to break above its BEV -27.5% line, but failed. Then in the summer of 2019, on gold’s third attempt at breaking above its -27.5% BEV line, it succeeded. A year later, in August 2020 gold was once again making new all-time highs in the BEV chart below.
Note: Gold appears to have made a new BEV Zero last March. But on March 8th gold’s BEV was -0.45%, just short of a 0.00%. Close, but no cigar.
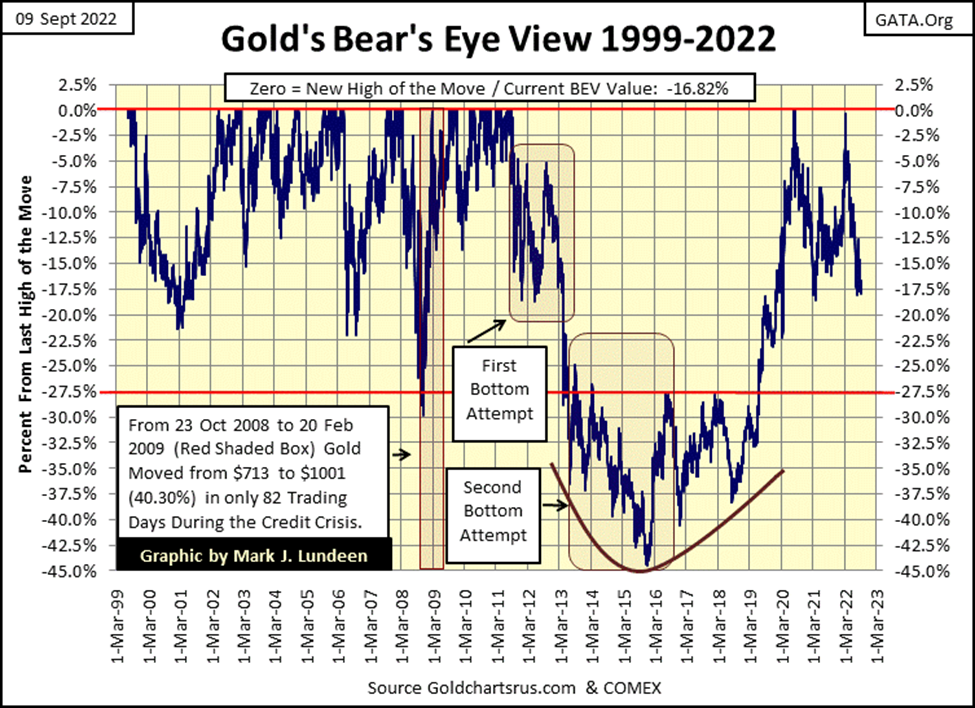
What I like about using a Bear’s Eye View (BEV) chart, a charting technique that compresses historic price data into a percentage range of only 100%, with 0.00% (BEV Zero) being a new all-time high, and -100% a total wipeout in valuation, is it often displays trends and patterns not obvious when looking at a market’s raw price data.
The thing I find outstanding about the post-August 2020 gold market in the BEV chart above, is its lack of volatility. In the past two years, gold has seen two corrections, neither of them breaking below its BEV -20% line.
Take a moment to look at gold’s BEV chart above, to compare the volatility of the past two years with the volatility gold has seen since 1999.
That may change in the future, but right now, I believe this fact tells us something important about the gold market; anytime gold sells off below $1700 (a BEV of -17.40%), the gold market has more buyers than sellers. Buyers with deep pockets who are willing to buy gold in any size, ounces or tons the sellers are willing to offer them.
I also get the feeling gold is near a bottom in terms of price. Timewise, when gold will once again attempt to make a new all-time high, I can’t say. Hopefully sometime in 2023, or even in 2022. Like it or not, these things keep to their own schedule, not to yours or mine.
In gold’s step sum chart below, both gold and its step sum closed the week below their trend lines. Not good, but not fatal either for as long as gold closing below $1700 brings in those buyers mentioned previously.
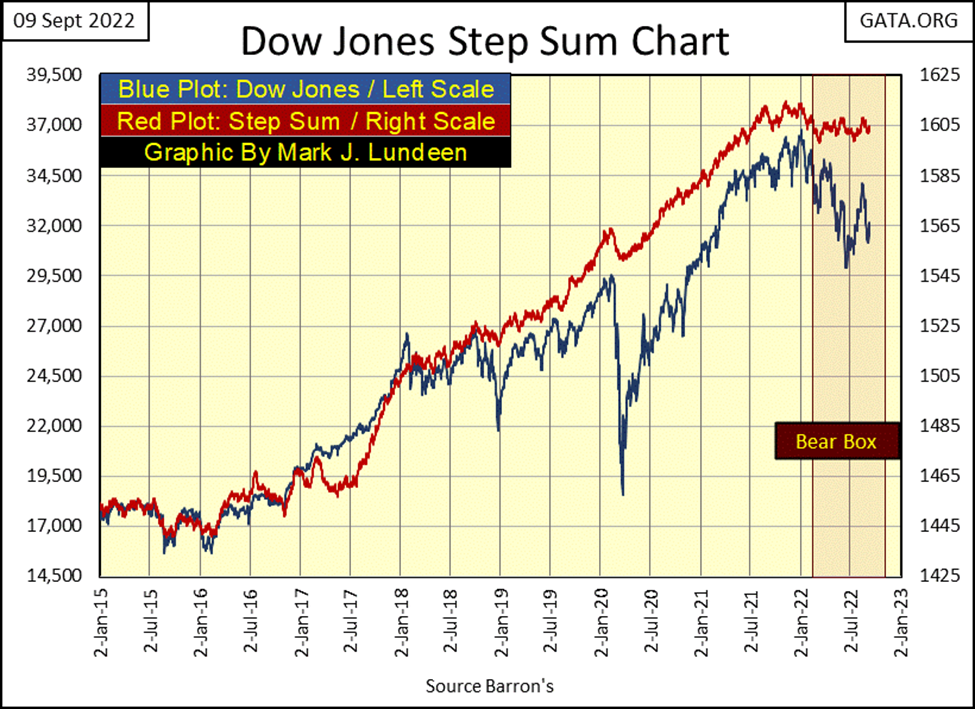
As for the Dow Jones’ step-sum chart below, the fact a bear-box has developed, and has endured since last January is bearish. From here, the Dow Jones could rise, breaking above its 34,500 line and keep going up until it makes a new all-time high, as its step sum plot rises with the price plot. That could happen. But that isn’t how most bear-boxes resolve themselves.
These step sum chart formations are called bear-boxes, as they are places where bulls get punished for being wrong on the market. We’ll know if that is to be should the Dow Jones’ price plot resume its bearish ways, as the bulls pent-up selling results in the step sum plot recoupling with the price plot to the downside in the chart below.
So, in early September, it could go either way for the Dow Jones. But the smart money up here in the market’s peanut gallery is betting on Mr Bear.
Last week gold’s 15-count hit a -7, or in a fifteen-day sample of daily advances and declines, there were only four advances, with eleven declines. A 15-count of -7 is an oversold market, and markets don’t like being oversold.
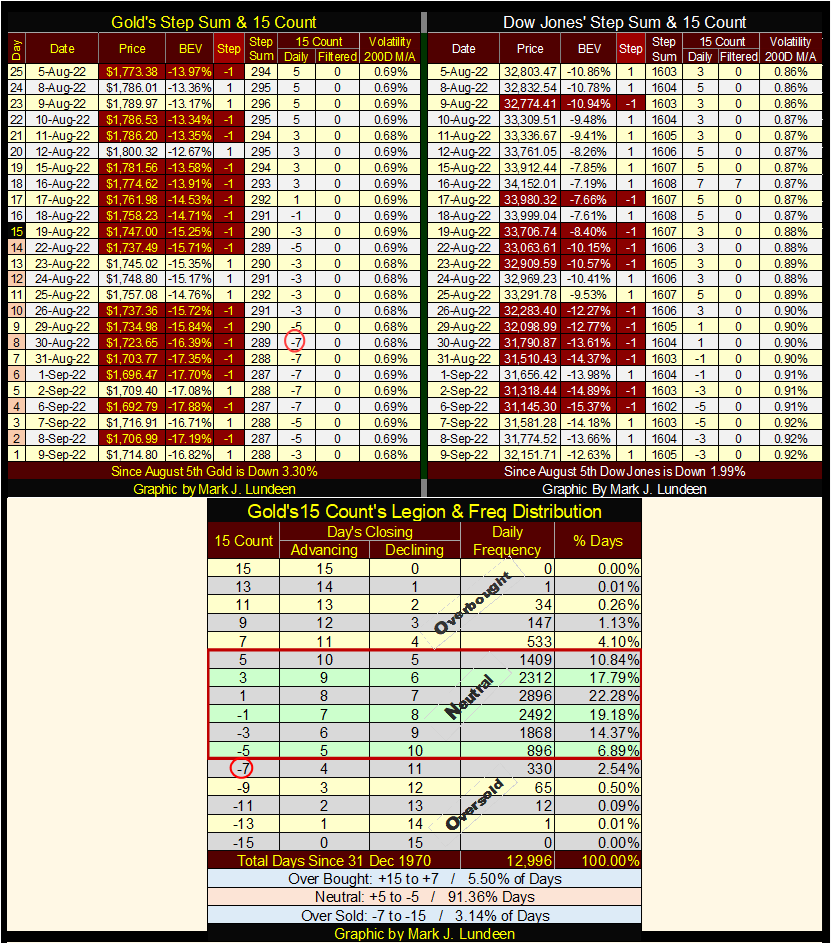
In the frequency table above, showing the daily frequency of gold’s 15-count closing between a range spanning from +15 to -15, gold closed with a 15-count of -7 for only 330 days of its 12,996 daily closings since 31 December 1970. Gold could now sell off until its 15-count decreases to a -9, but since 1970, that hasn’t happened too many times. And as we see, this week the gold market closed with a 15-count of -3.
We may be in the early stages of an advance in the gold market. But keep in mind gold is a manipulated market, a place where goons are allowed to roam on the floor of the COMEX gold exchange, to market worthless promises to sell phantom gold by the ton to their heart’s content.
But as I’ve said earlier, the COMEX goons are having no success in getting gold below, and keeping gold below $1700. No more success than the bulls are having in driving gold up to a new all-time high, though the bulls came close last March.
__
(Featured image by coloringcuties via Pixabay)
This article may include forward-looking statements. These forward-looking statements generally are identified by the words “believe,” “project,” “estimate,” “become,” “plan,” “will,” and similar expressions. These forward-looking statements involve known and unknown risks as well as uncertainties, including those discussed in the following cautionary statements and elsewhere in this article and on this site. Although the Company may believe that its expectations are based on reasonable assumptions, the actual results that the Company may achieve may differ materially from any forward-looking statements, which reflect the opinions of the management of the Company only as of the date hereof. Additionally, please make sure to read these important disclosures.


Blockchain Evolves Toward AI, Finance and Quantum Security
Blockchain is evolving beyond crypto into finance, AI applications, and digital markets, while security and regulation remain challenges. Quantum threats...


The Italian Crowdinvesting Market Faces Sharp Decline in 2026
Italian crowdinvesting market continued to decline in 2026, with fundraising falling 36.8% year-on-year to €164.19 million. Platforms and active campaigns...


Sartorius Stedim Biotech Maintains Growth Momentum in H1 2026
Sartorius Stedim Biotech reported solid H1 2026 results, with revenue reaching €1.527 billion and EBITDA rising to €479 million. Growth...


Bank of Africa Launches BOA MDM Network to Boost Diaspora Investment in Morocco
Bank of Africa launched the BOA MDM Network to channel diaspora remittances into productive investment, aiming to raise their share...


Switzerland’s Medical Cannabis Reform Advances Access, But Barriers Remain
Switzerland’s 2022 medical cannabis reform improved patient access by removing federal approval requirements, but challenges remain. MEDCAN highlights barriers including...
 |
|
 |  |
 |
|
-

 Biotech1 week ago
Emily.AI: Personalized Oxygen Therapy Earns Global AI Recognition
-

 Business3 days ago
The $40 Trillion Trap: Disinflation Is Not Deliverance
-

 Cannabis2 weeks ago
Germany Tightens Cannabis Reimbursement Rules: Approved Medicines Must Come First
-
 Africa5 hours ago
Bank of Africa Launches BOA MDM Network to Boost Diaspora Investment in Morocco