Business
Bear Market Deception: Dow Volatility and Lessons from Silver’s 2011 Collapse
The bear market dragged on, with major indexes stuck below their BEV -10% lines. New 52-week lows stayed flat, but risks loom. The Dow Jones oscillated between BEV -10% and -15%, showing instability. Skepticism remains strong, given bear markets’ deceptive starts. A sharp silver collapse in 2011 hints at suspicious market forces suppressing prices.

The bear market continued this week. A week that saw bearish extreme market events, as per Mr Bear’s report card below. A week where the major market indexes I follow, in the main refused to once again, close above their BEV -10% lines. One plus for this week, these major market indexes, and the 2,800 issues trading at the NYSE, didn’t see a pickup in new 52Week Lows. But, then there is always next week, and then the week thereafter.
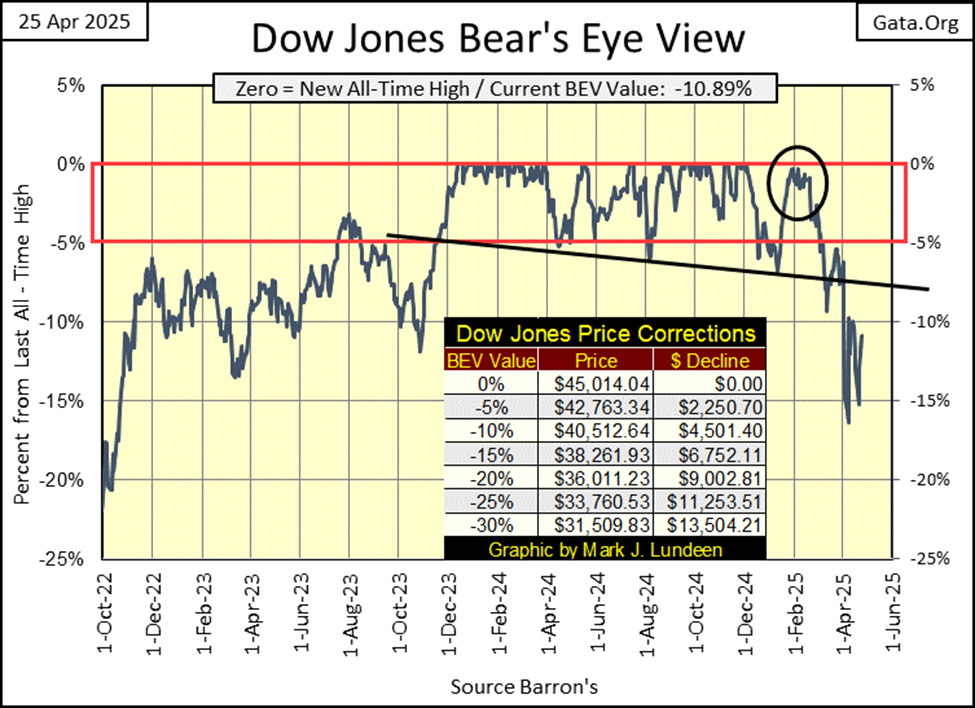
For a visual of what is happening with valuations in the stock market, the Dow Jones, in its Bear’s Eye View chart below, provides a good view of this week’s market action. On Monday, the Dow Jones broke below its BEV -15% line, and for the rest of the week, oscillated between it, and its BEV -10% line, ringing like a bell.
That won’t go on forever, so the first thing that comes to my mind is, will the Dow Jones next break above its BEV -10% line, or below its BEV -15% line, and what happens after that?
Should it spike above its BEV -10% line, that wouldn’t make me bullish, even should it then advance from there, closing above its BEV -5% line. It might help should the other major market indexes follow the lead of the Dow Jones, advancing towards a new all-time high, and then in my mind, maybe not.
The problem I have turning bullish on this market, I know how sneaky these bear markets are when they first begin deflating. As every bear market begins following the absolute top of a bull market, Mr Bear knows most investors remains bullish. So, he encourages people to put their money where their mouths are, back into the market.
Nope, not for me! I like it here, high above the playing field, sitting in the bleachers of the market’s peanut gallery, eating hotdogs and drinking beer.
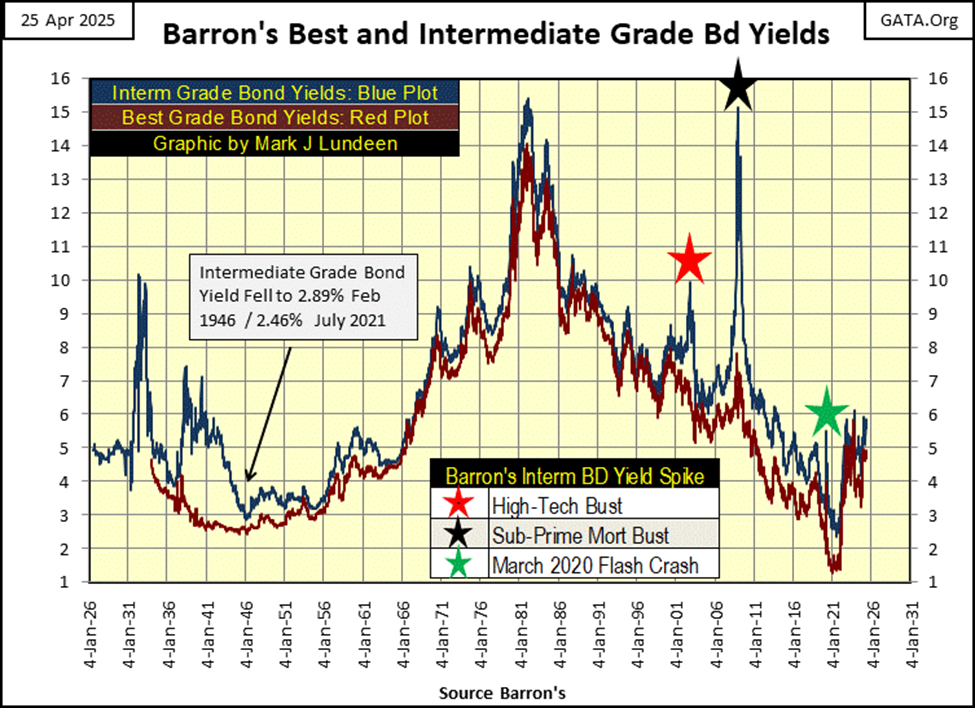
Next is a chart I last used in 2015, comparing the April / May 2011 collapse in the price of silver (Black Plot) with other notable Dow Jones Bull-Market tops. From the Dow Jones’ Terminal Zeros (TZ = last all-time high of a bull-market), and the first 200 days of the following bear market.
In the spring of 2011, just days following its first attempt to make a new all-time high since January 1980, silver fell off a cliff, face first, collapsing 30% in only twelve trading days. This is called “suspicious-market action,” very much so! Obviously someone in April 2011, don’t ask me who, said no to silver’s rising above its highs of January 1980. Spanked anyone foolish enough to risk their money thinking silver could possibly rise to a new all-time high.
Next we look at the Dow Jones during the first days of the market crash of 1929 (Blue Plot), the deepest bear-market in the history of the Dow Jones, an 89% market decline in July 1932. But in the autumn of 1929, Dow Jones took 56 NYSE trading sessions before it first broke below its BEV -45% line, an extremely aggressive market decline, with more, much more to follow in the years to come.
The second deepest Dow Jones’ bear-market decline, happened during the Sub-Prime Mortgage Crash (Green Plot), a 54% market decline by March 9th 2009. But note for the Sub-Prime market crash, the 200 NYSE trading sessions following its October 2008 top, it had deflated only to its BEV -20% line. From there, investors were still expecting the Dow Jones to rebound to new all-time highs. They were wrong.
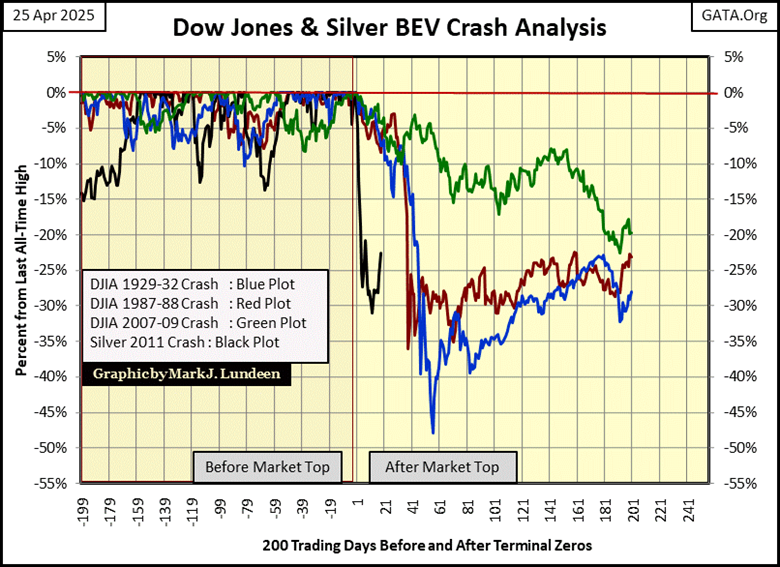
What will our TZ of 04 December 2024, see following its 200th NYSE trading session? That would be 01 July 2025, two months from now. That so far, this bear-market has seen the Dow Jones break below only to its BEV -15% line, means nothing. Bear markets are not a thing, a noun. Bear markets are an action, a verb. And verbs like bear-markets, take time to fully express themselves.
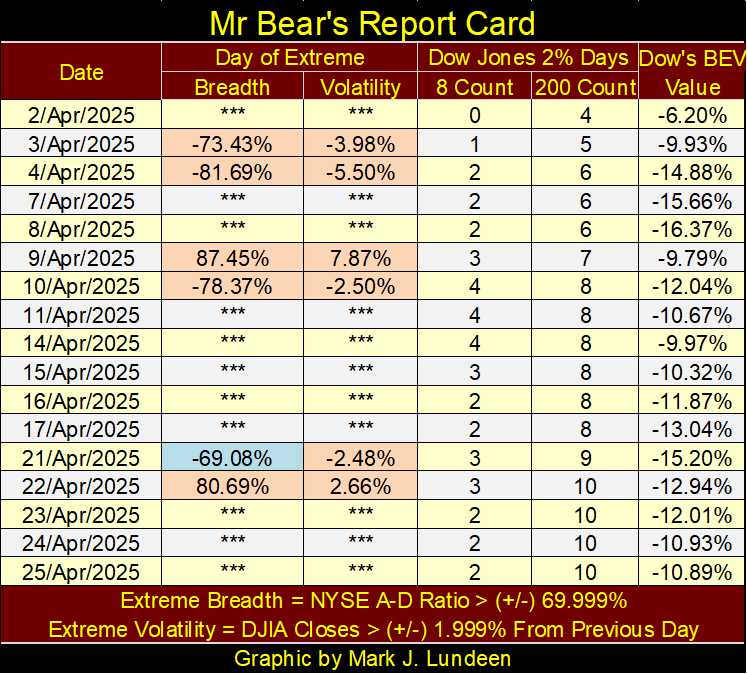
One item arguing our current market’s decline is the early stage of a bear-market, is the Dow Jones is once again seeing days of extreme volatility; Dow Jones 2% days. Where the Dow Jones moves +/- 2%, or more, from a previous day’s close. That, plus the NYSE is also seeing days of extreme market breadth, or NYSE 70% A-D days.
This week in Mr Bear’s Report Card below, on Monday and Tuesday, the Dow Jones saw 2% days. The NYSE saw a 70% A-D Day on Tuesday, and came within 1% of doing the same on Monday (-69.08%).
These extreme market events, are rare market events, during bull-market advances. Years can pass from one to the next. However, since the start of April, the fact we see twelve of them, in less than a month, argues strongly we are in the early stages of a bear market. Making this a time for selling, not buying what Wall Street is offering to the public.
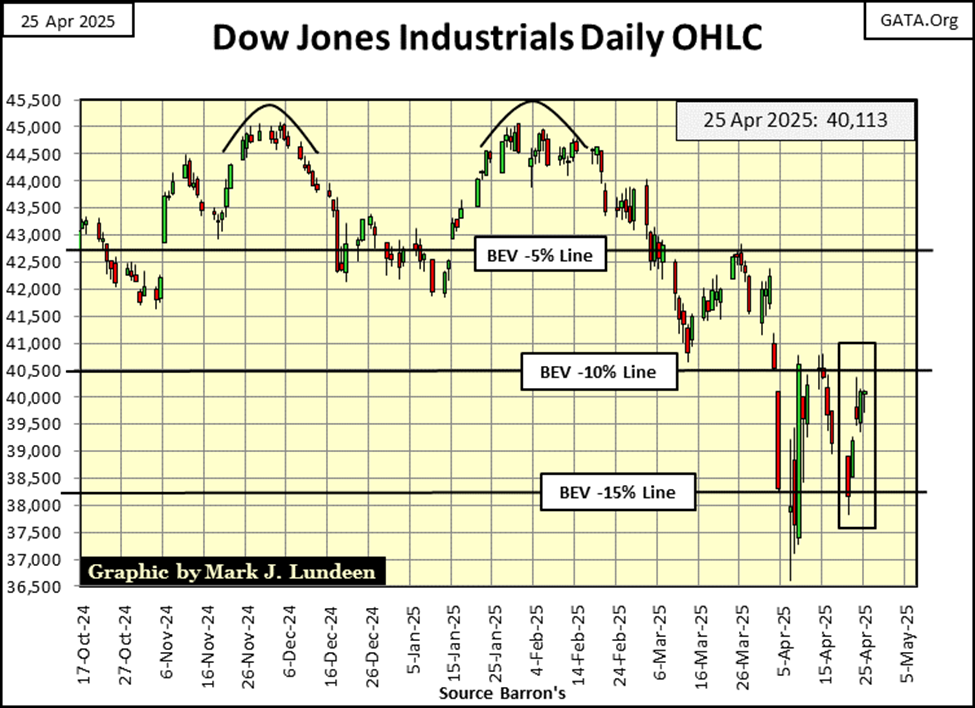
Looking at the Dow Jones in daily bars below, compare the daily bars before and after the Dow Jones last all-time high on 04 December 2024. Beginning in late March, the size of the Dow Jones’ daily bars has increased. That is what happens to the Dow Jones in bear markets. That this week, daily volatility for the Dow Jones was subdued means nothing.
In the table below, listing the Bear Eye View values for the major market indexes I follow, this week closed with only five of them above their BEV -10% lines. Who knows? Maybe next week there will be ten of them above their BEV -10% lines, with a few indexes closing above their BEV -5% lines. However, early in a bear-market, it’s easy believing the previous bull market is still the market’s primary trend, whether or not that is actually true. Me? I’m a big bear on this market.
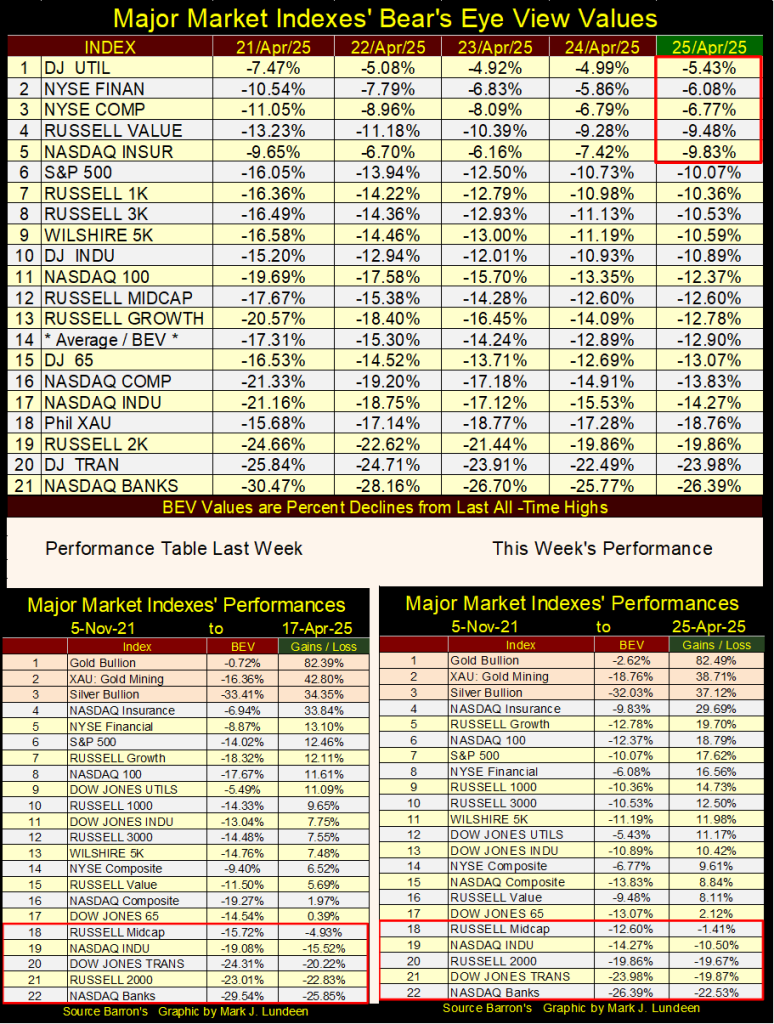
In this week’s performance table above, gold, the XAU, and silver remain in the top three positions, though they were down slightly for the week. In the coming months, should the financial markets continue to deflate, I expect these precious metal assets, will begin advancing in a very aggressive manner.
One of the things I find very attractive with President Trump is; he never leaves you wondering what he really thinks about any topic important to him. I don’t always agree with him, but I know where he stands. For instance, his opinion about Federal Reserve’s Idiot Primate, Powell, as seen below in the article from CNBC last Monday.
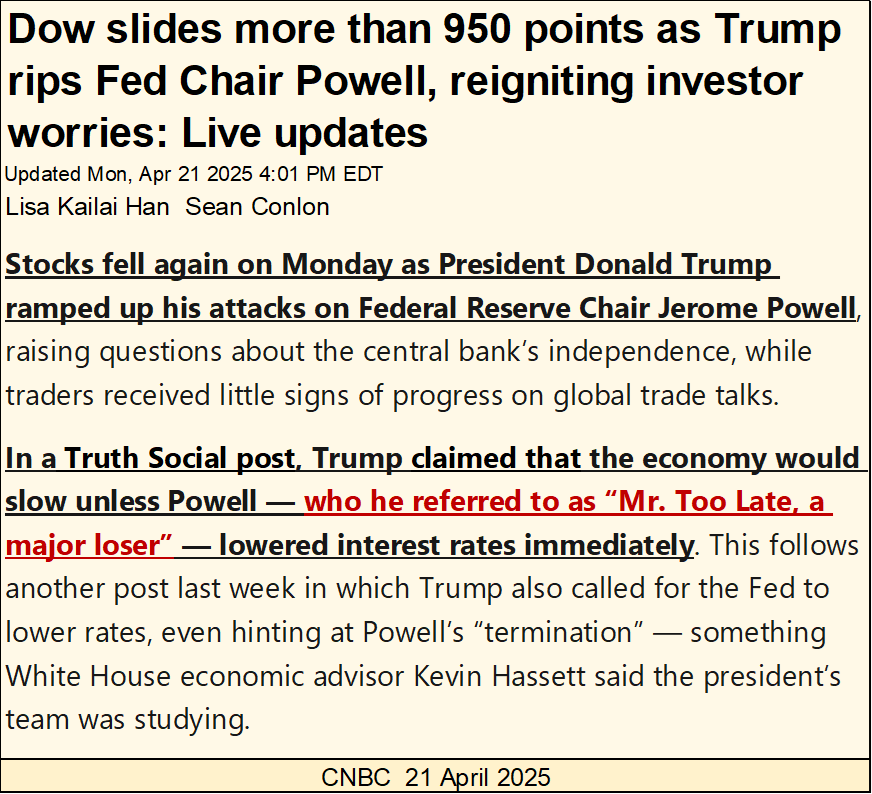
I believe Trump is positioning himself, so that the FOMC’s Idiot Primate, Powell, for failing to lower rates now as Trump now rudely urges him to, will take the blame when the bottom falls out of the economy. And in truth, the Federal Reserve should take full blame for any economic disaster that follows.
They are the ones who pushed people, and corporations to fall deeply into debt. Without the Federal Reserve, the United States’ national debt wouldn’t be over 36 trillion dollars at the close of this week. It’s what central banks do; they ensnare all they can with debt.
If I had my way, I’d just roll up the entire Federal Reserve System. Shut it down tonight. That would result in chaos, as so many bubbles currently inflated in the financial markets would immediately go bust, as the only thing keeping these bubbles inflated, is the Federal Reserve’s constant attention to keep their market values bloated.
With no Federal Reserve, bubbles in the stock market, real estate and the bond markets would go bust, which would bring the global banking system to the brink, and then slip into the abyss. As these banks’ tainted reserves would finally do, what they should have done decades before; be marked-to-market, down to values far from where they currently are.
The FOMC would cease being the “buyer of last recourse,” aka; the greatest fool, buying dubious assets in volume, at prices everyone else refuses to pay, thus propping up the inter-banking system’s liquidity, with its monetary inflation.
What benefit would this have on the economy, and for people now struggling to make ends meet in it? Well initially, as with the Great Depression, it wouldn’t have any positive results, quite the contrary. But the economic pain from the Depressing 1930s, came about from the unviable debt, and bloated market valuations, created by the Federal Reserve during the bull-market of the Roaring 1920s, being purged from the balance sheets of corporations and individuals, ultimately had positive results.
At the end of this process, as was the case for the United States, from the 1940s to the 1970s, prosperity became widespread, enjoyed by most people and businesses, throughout the United States, and the world in general.
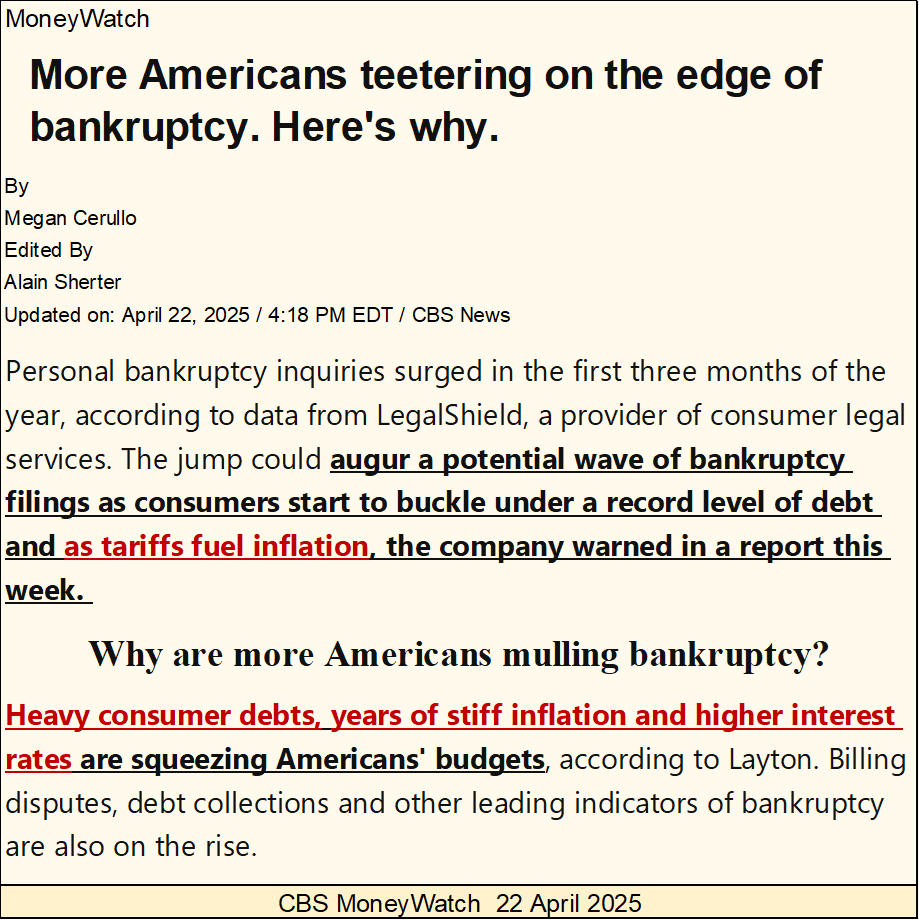
From 1950 to August 1971, when gold still held some check on the Federal Reserve’s ability to create unlimited bank credit, and currency from out of thin air, few, if any financial news articles, as seen below, were ever published. Now in 2025, we see such news articles all too often.
https://www.cbsnews.com/news/chapter-7-bankuptcy-file-consumer-debt
As seen above, again it’s Trump’s damn tariffs causing all this human misery. Though this article also notes inflation has been “stiff” for years, long before Trump came back into office. The mainstream financial media doesn’t know how to stop lying to the public.
Are “high interest rate now squeezing Americans’ budgets?” You better believe they are! But back in the late 1970s, and early 1980s, the financial media was in the main, free from such stories, when interest rates soared into the double-digits.
Why? Because back then, for wage earners and businesses, banks were primarily for saving money, not places to burden themselves with debt. In 1980, if you had money in the bank, and most people did, would you prefer interest rates at 5%, or 15%? In 1980, most people and businesses saw interest rates at 15%, more a blessing than a curse, for the interest income it generated for them.
So, who wanted interest rates to decline? One institution did; the big spenders in the U.S. Federal Government, who at the time had a massive national debt of – one, just one trillion dollars.
Below are some past quotes on debt. The top quote from the Wall Street Journal, explains why so many people today, are now having problems with debt; “innovation and deregulation have vastly expanded credit to virtually all credit classes.” Thankyou Alan Greenspan.
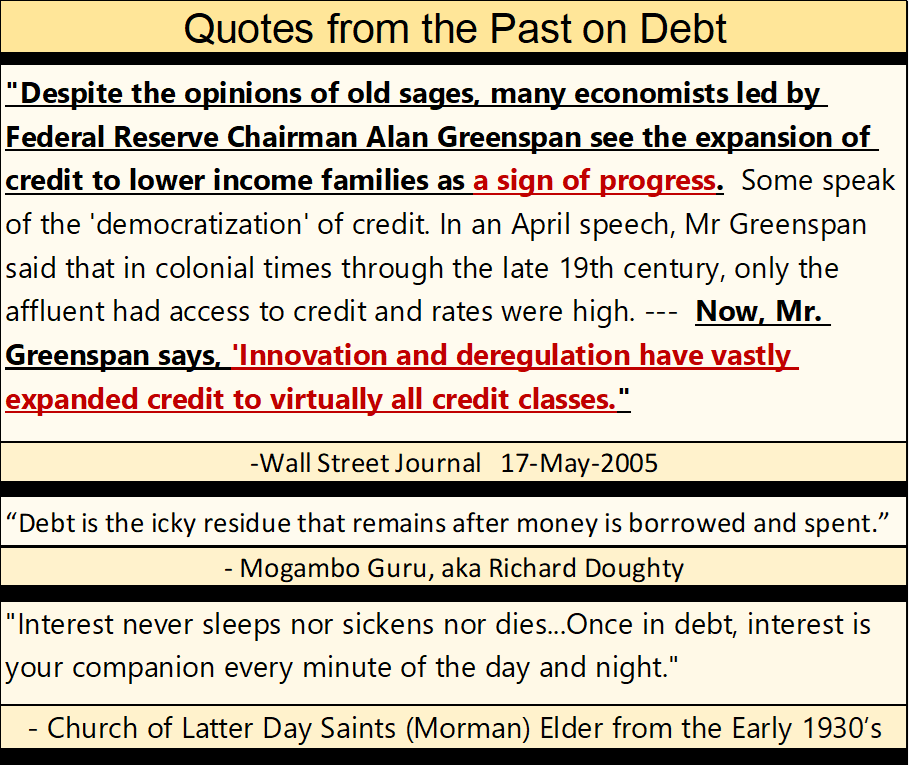
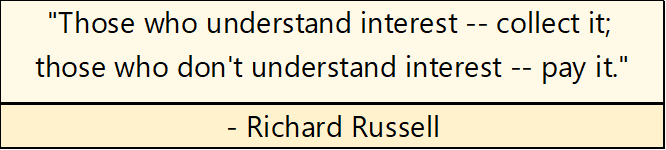
Before the 1990s, most Americans really did understand credit, and thrift: a penny saved, was a penny earned. So, they collected interest from their savings, and to the best of their ability, shunned debt. Mr. Russell below, said it best.
Then in the 1980s, came Master Card and Visa, second mortgages, and who knows what else to lure people into ensnaring themselves in debt. For sure, “innovation and deregulation” in the credit markets had a large part in our current problems with debt
Young people, especially those with college degrees, financed with school loans, got stupid about borrowing money. Borrowing several hundred thousand dollars to finance a degree in LGBT Critical Studies at Harvard, or Yale is stupid.
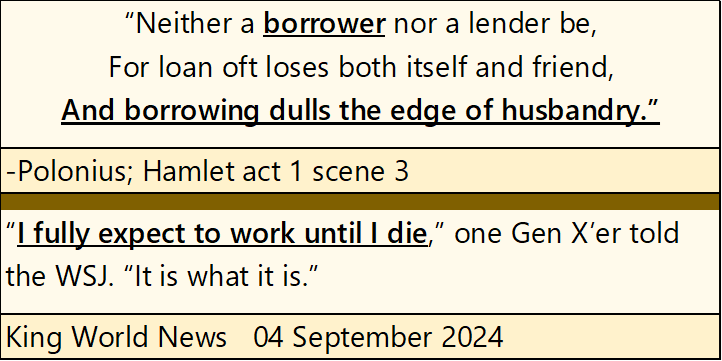
The second quote from the Wall Street Journal below, is from a Gen Xer, about their debt burden. This is slavery by debt; where people rise in the morning to go to work, to serve their master, their bank. This is no accident. So sad we are a nation that would do something like this, to its children.
The Federal Reserve, with its “injections of liquidity” has so transformed the landscape of the credit market in the past five decades, that today’s rising rates, places families and businesses at risk of financial ruin. What is there to like about the Federal Reserve, or its Idiot Primate, Powell? Absolutely nothing.
Now on to gold, and its BEV chart below. As you remember, the Dow Jones’ BEV chart above, once looked much like gold’s BEV chart below. Then came January for the Dow Jones. But note, gold has in the main, remained in scoring position, within its BEV 0.00% and -5% lines since November 2023. Just this Monday, gold made its 65th new all-time high of this advance, as the stock market was “struggling with Trump’s tariffs.”
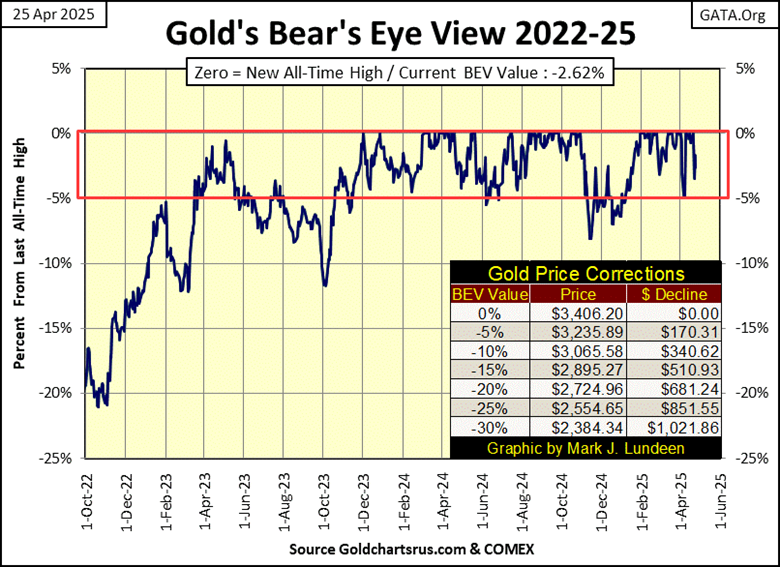
Gold looks good. Expect to see additional BEV Zeros in its BEV chart in the weeks to come.
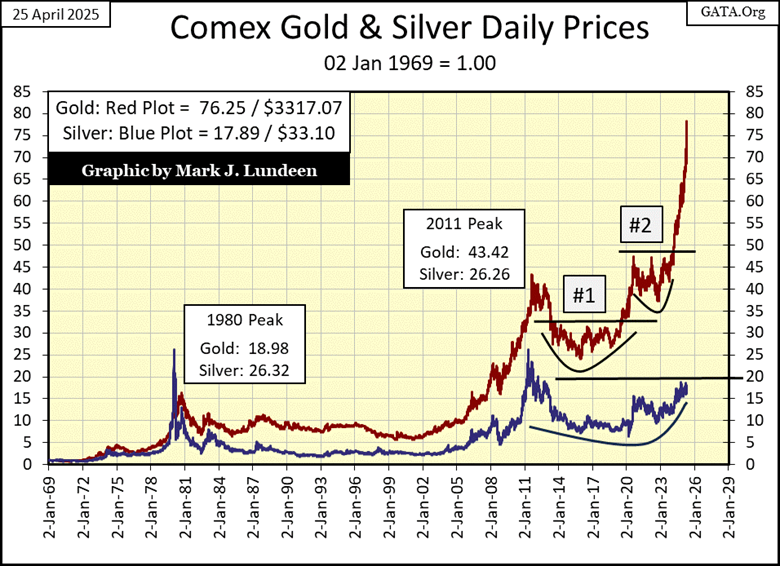
And then there is silver (chart below), sitting at the edge of a bowl that began in April 2011, when it last attempted to breakout to its first new all-time since January 1980. Geeze Louise, the bowl silver is sitting in has lasted for the past fourteen years. I could also make the case this bowl has lasted since January 1980. Study the chart for a moment, and you’ll see what I’m talking about.
When silver does finally break out of this bowl, whether you see it as a fourteen-year bowl, or a forty-five-year bowl, something spectacular just might happen. But before something spectacular happens, silver must first close above its 20-factor line. Something it has tried, but so far has failed to do for months now.
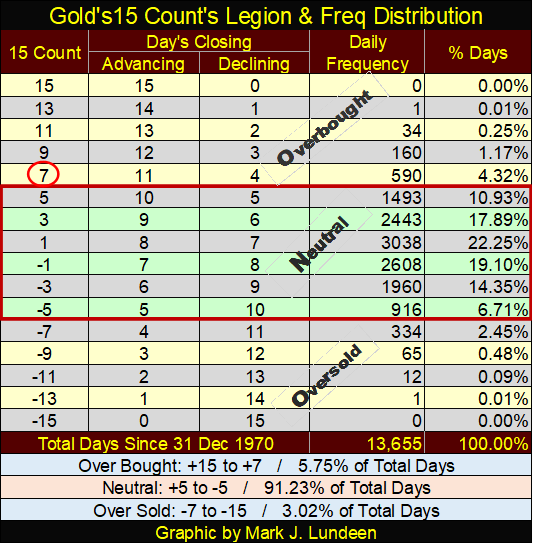
Gold’s 15-count closed the week at a -1 (see gold’s step sum table below). The step sum 15-count is an indicator of whether, or not a market is overbought or oversold. A 15-count of -1 is a neutral count, leaning, just a tad towards gold being an oversold market. I like that, as it suggests the current advance in gold, still has plenty of headroom to continue advancing to new all-time highs.
In gold’s step sum table below, there are eight BEV Zeros, new all-time highs to be seen. If you’re a bull, there is nothing wrong with that.
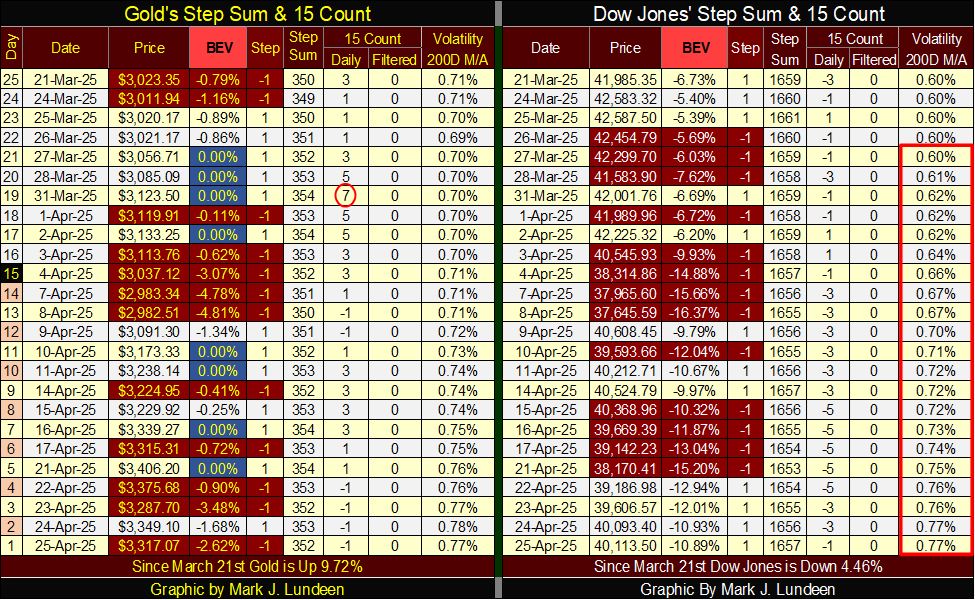
On the Dow Jones’ side of the above step sum table, between March 26th and April 21st, there are plenty of red down days in the market, though we should note, the Dow Jones’ 15-count never declined to a -7, thus becoming an oversold market.
Markets, during both bull and bear markets, see about as many daily advances, as they see daily declines. But for short periods of time, daily declines may overwhelm daily advances, to then see daily advances overwhelm daily declines.
I’m pointing this out, as looking at all those red down days for the Dow Jones in the table above, it seems we are due for a period where the Dow Jones will see more daily advances than declines. If we are in a bull market, the Dow Jones will see a nice advance in its valuation. If we are in a bear market, having daily advances overwhelm daily declines, won’t make much of a difference in the valuation in the Dow Jones.
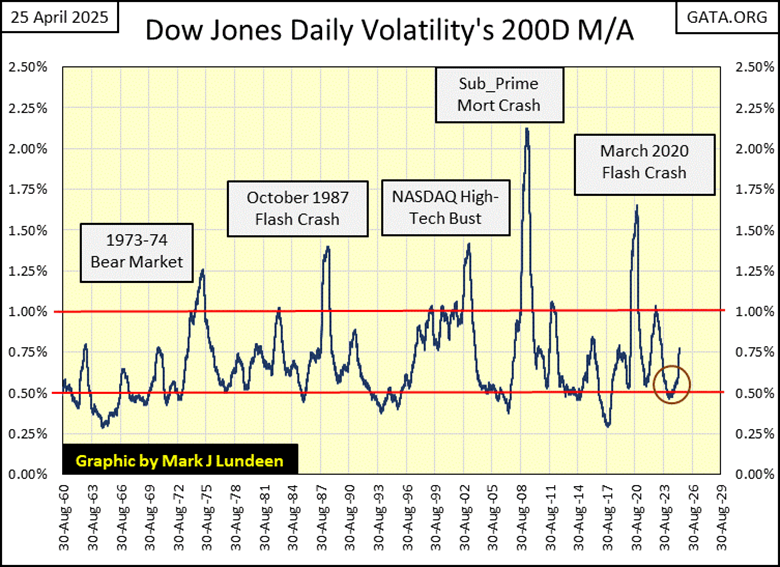
So, is the Dow Jones in a bull or bear market? Looking at the Dow Jones daily volatility’s 200D M/A (table above / chart below), daily volatility has been rising since the beginning of 2025. Having this metric increase from 0.60%, to 0.77% in only twenty-one trading days (Red Box Above), and the chart below, does not auger well for the bulls out there.
__
(Featured image by chris panas via Unsplash)
DISCLAIMER: This article was written by a third party contributor and does not reflect the opinion of Born2Invest, its management, staff or its associates. Please review our disclaimer for more information.
This article may include forward-looking statements. These forward-looking statements generally are identified by the words “believe,” “project,” “estimate,” “become,” “plan,” “will,” and similar expressions, including with regards to potential earnings in the Empire Flippers affiliate program. These forward-looking statements involve known and unknown risks as well as uncertainties, including those discussed in the following cautionary statements and elsewhere in this article and on this site. Although the Company may believe that its expectations are based on reasonable assumptions, the actual results that the Company may achieve may differ materially from any forward-looking statements, which reflect the opinions of the management of the Company only as of the date hereof. Additionally, please make sure to read these important disclosures.


The TopRanked.io Weekly Digest: What’s Hot in Affiliate Marketing [LiveChat Affiliates Review]
Quick Disclosure: We’re about to tell you how LiveChat Affiliates run a top-notch affiliate program. And we really mean it....


German SMEs Face Tighter Bank Lending, Turn to Alternatives
Access to bank loans for German SMEs is tightening despite strong financing needs. About 37.8 percent face restrictive lending, driven...


Bitcoin Stalls as Geopolitical Risks and Crypto Industry Tensions Persist
Bitcoin is moving sideways near $72,000 amid ongoing Iran tensions, while ETF inflows remain strong. Quantum security debates continue. Ethereum...


Geopolitical Tensions and Trade Disruptions Reshape Global Commodities Markets
Geopolitical tensions and disrupted trade routes, especially around the Strait of Hormuz, are reshaping global commodities markets. Agriculture faces supply...


Germany Sees 413 Cannabis Cultivation Clubs Two Years After Partial Legalization
Two years after partial cannabis legalization in Germany, 413 cultivation clubs have been established nationwide. Lower Saxony leads in clubs...
 |
|
 |  |
 |
|
-

 Biotech4 days ago
Gilead’s $5 Billion Tubulis Deal Boosts Evotec Stake
-

 Crypto2 weeks ago
Crypto Markets Edge Up as Caution Persists and April Fools’ Scams Loom
-

 Markets6 days ago
Global Coffee Market Faces Price Drops Amid Strong Supply and Export Challenges
-

 Markets2 weeks ago
Dow Jones Tests Correction Zone Amid Bullish Momentum and Bubble Concerns