Business
Bull and Bear Markets Can Take a Long Time
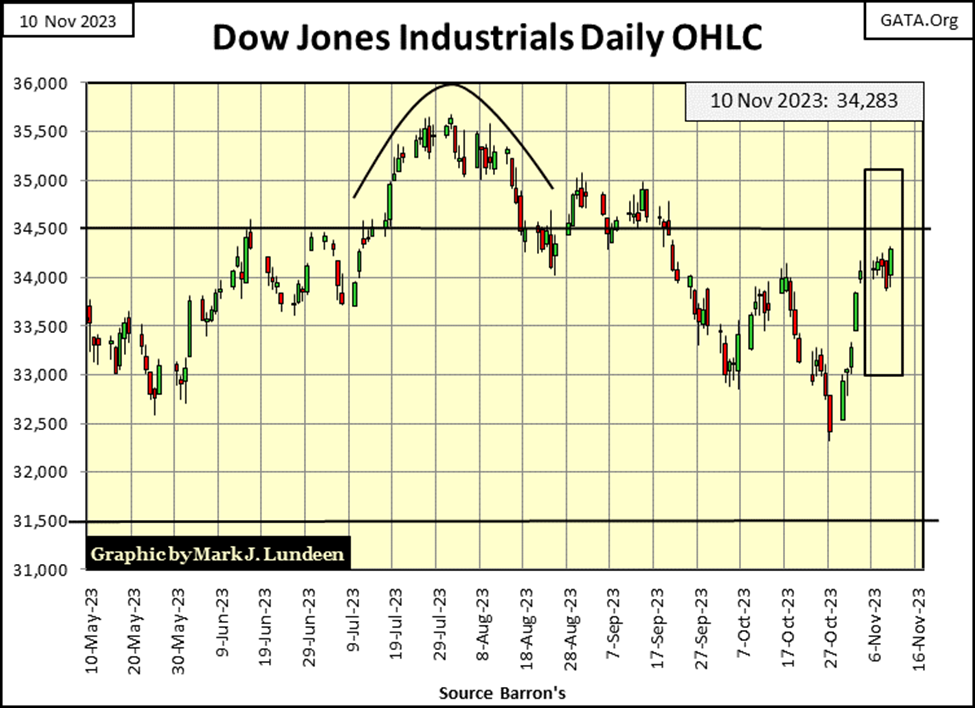
Big bear markets can take a long time. Looking at the Dow Jones in daily bars, this is a market that isn’t in a hurry to go up, or down. This week, the Dow Jones 34,500 line proved to be a hard ceiling to the market. Should it break above it this coming week, what then; 35,000? What it failed to do last September; I doubt it will do in November.
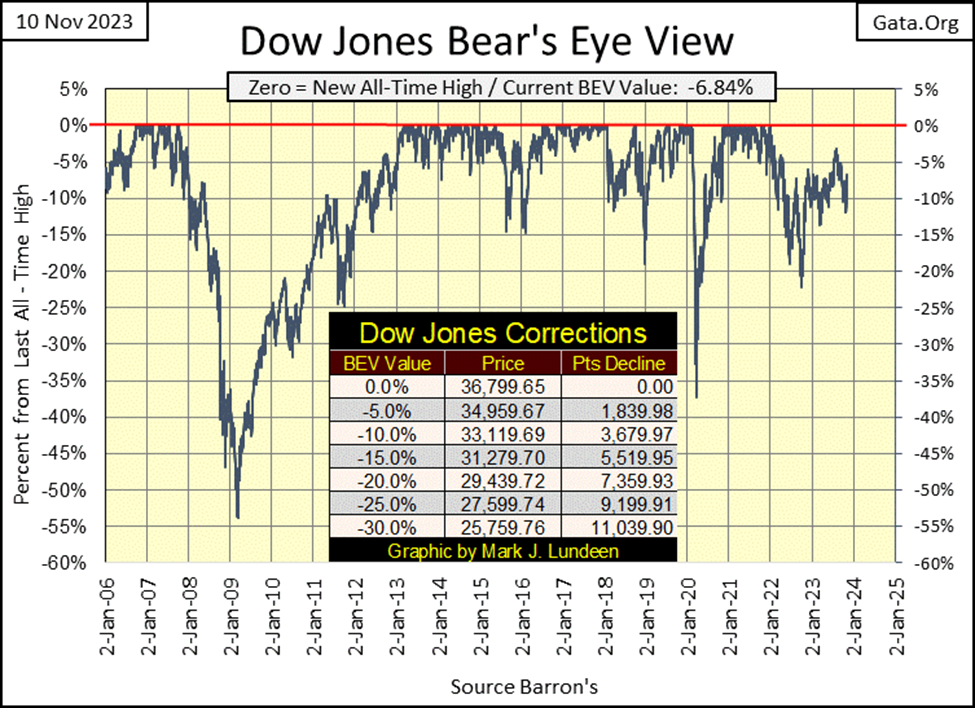
The last time the Dow Jones closed in scoring position, was in mid-August. With this week’s BEV close of -6.84%, the Dow Jones isn’t far from closing in scoring position again. Will it do so again? To answer that question, I’m going to look at the Dow Jones BEV chart below. Since its last all-time high of 04 January 2022 (its Terminal Zero / TZ), every time the Dow Jones closes in scoring position (-0.01% to -4.99%), it invites selling that soon drives the Dow Jones back down below its BEV -5.00% line.
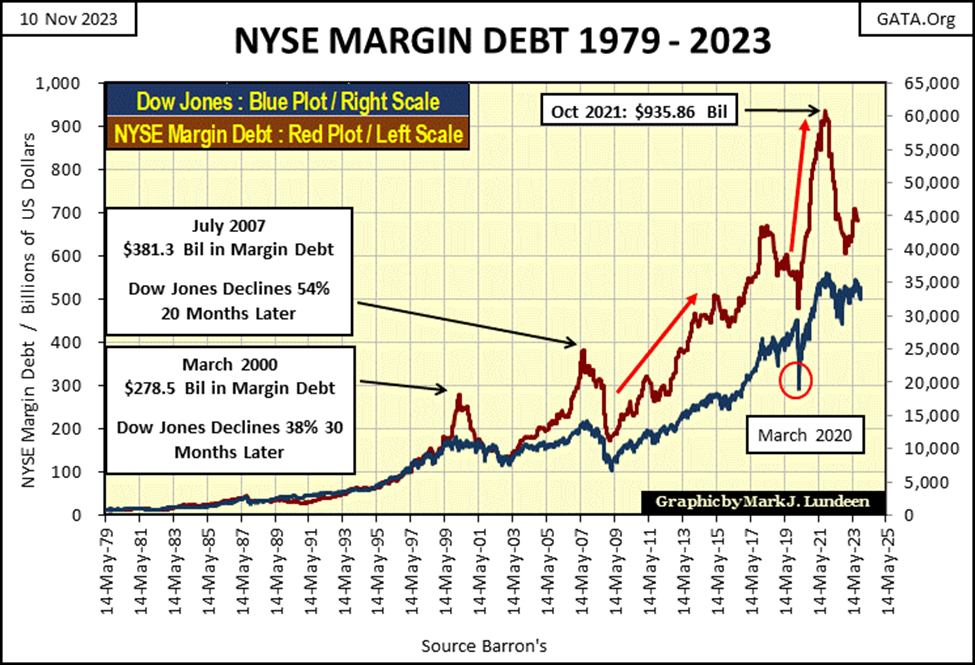
Maybe a third attempt to close in scoring position, which the Dow Jones will then go on to make another new all-time high, will be the charm. Then maybe not. The idiots at the FOMC continue draining “liquidity” from the financial system; $27.27 billion last week. NYSE Margin Debt is still far from its highs of two years ago (Red Plot / chart below).
As buying is what makes the Dow Jones advance upward, and buying takes money, looking at the Federal Reserve’s shrinking balance sheet (three charts below) and the meek advance in margin debt at the NYSE (next chart), I’m doubtful the Dow Jones’ BEV will close in scoring position anytime soon. But if it does, seeing it then close at a new BEV Zero in its BEV chart above isn’t something I’d want to risk my money on. So, a bear I was, and a bear I remain.
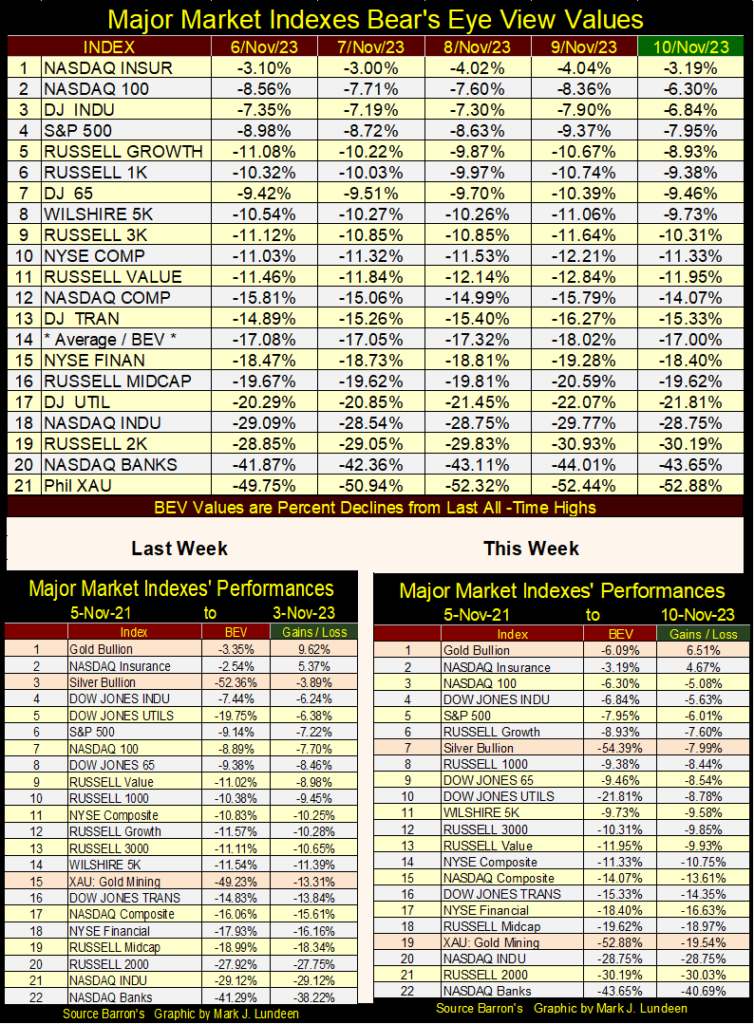
Moving to my major indexes BEV table below, NASDAQ Insurance Index (#1) closed in scoring position every day this week. That is good, but it has done this frequently since its last all-time high of 07 February 2023, nine months ago, and still no new all-time high (BEV Zero / 0.00%) since.
And the NASDAQ Insurance Index is the best of the sorry bunch seen below. Some of these indexes haven’t seen a new all-time high for two years. The XAU’s last all-time high was in April 2011. What will it take to get these indexes moving up once again? That is what bulls in this market must be wondering.
For myself, a bear, I’m wondering when this market will resume it bear market decline. How deep a percentage decline the Dow Jones, and other indexes seen below will have to descend before a new bull market even becomes possible?
There is a huge gulf between the bulls and the bears in this market, forming a dichotomy on the “policy makers’ monetary policy.” The bulls see the inflation flooding out of the FOMC’s “monetary policy” as something normal, a “monetary policy” of wealth creation. Bears see the “monetary policy” of the FOMC as something horrible, the inflation flooding from the FOMC will ultimately result in the destruction of the economy, and the lives of people depending on that economy.
Keeping it simple; at its most basic level, market bulls believe the market must go up once again, because for the past four decades, it always has.
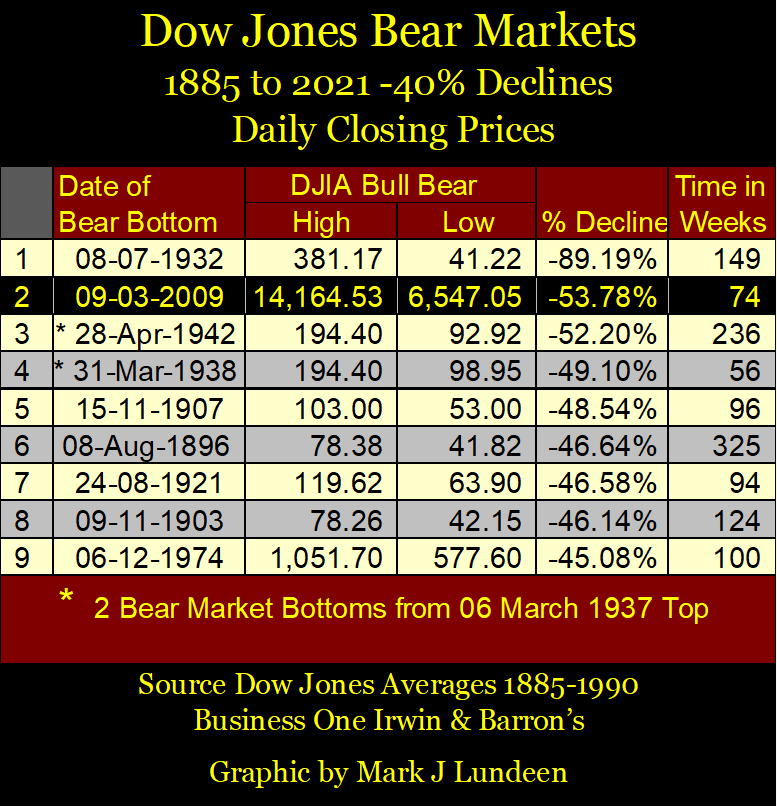
The 54% Dow Jones bear-market bottom of the subprime mortgage debacle (October 2007 – March 2009) was the second deepest, bear-market percentage decline since 1885. Exceeded only by the Dow Jones’ 89% market collapse seen during the Great Depression Crash.
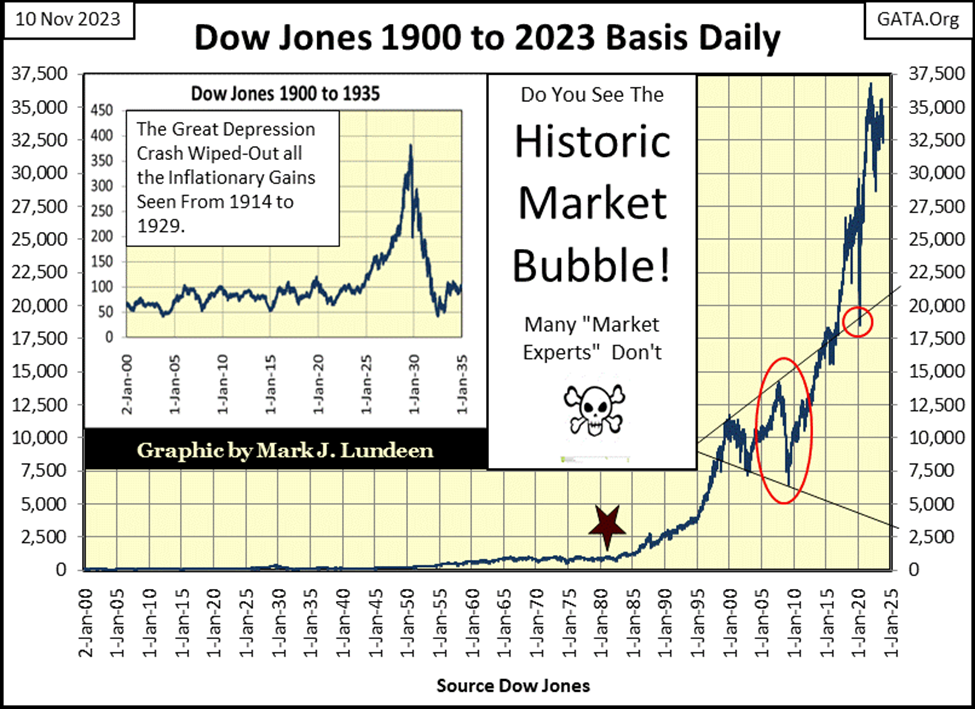
Yet, this second deepest bear market decline is only a simple correction, within the context of the 1982 to 2022 bull market advance, as seen in the chart below.
Then there was the March 2020 flash crash (Right Red Circle below). That decline had a floor placed beneath it by FOMC idiot primate Powell’s Not QE#4, which propelled major-market index valuations to their current all-time highs of two years ago.
As you may have noticed, I’ve taken some liberties with the members of the Federal Reserve Open Market Committee (FOMC), calling them idiots for accepting these excellent employment opportunities at America’s central bank. Plus, I call their leader; Powell, the FOMC’s idiot primate.
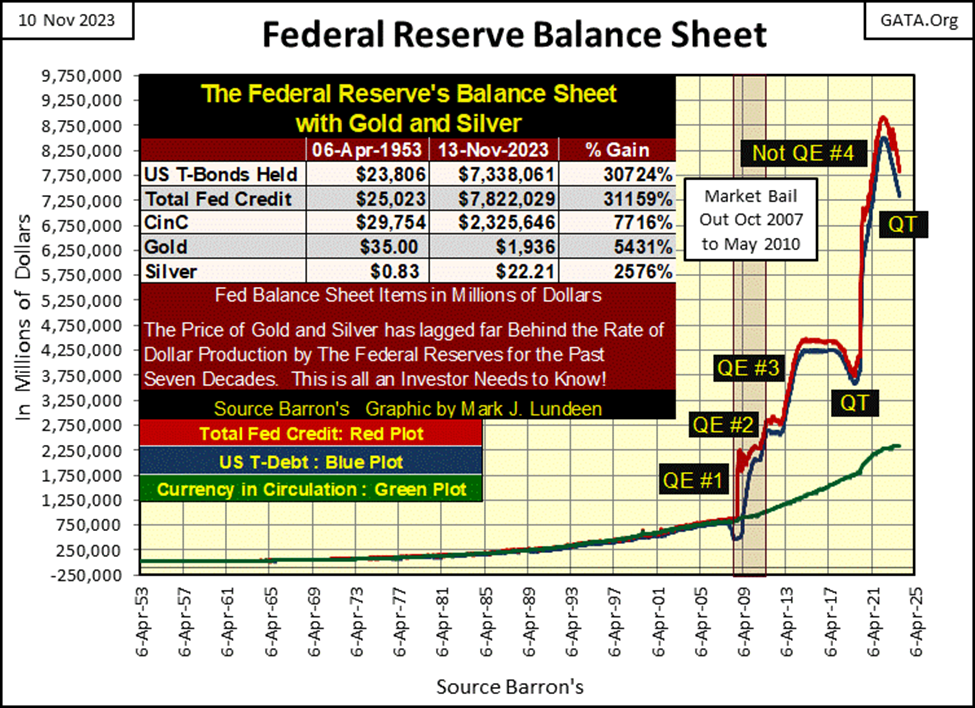
I’m just having a little innocent fun at their expense. And why not? Looking at what these idiots, and their idiot primate have done to the Federal Reserve’s balance sheet below, they’ll be called many things a whole lot worse when they finally blow up the entire dollar-based global economy. Looking at the chart below, it’s impossible for me to be bullish in the stock and bond markets, but I do like gold, silver, and precious metal mining companies.
The actual problem with “monetary policy,” is the US Congress. It was them, who in 1913, created the Federal Reserve via legislation, and Congress has never properly supervised this monster they created. Though they are willing to sit for hours listening to the FOMC idiot primate lie to them about their “monetary policy.”
When Alan Greenspan was FOMC idiot primate, the discussion between him and Congress once degenerated to the point of whether oxen could be used as a basis for a monetary system. As per Alan Greenspan’s quote below, why yes it could, as for these people, anything, including hamburger on the hoof, is better than monetizing gold and silver.
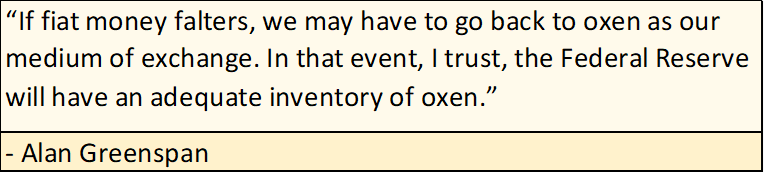
Oh, come on Mark! Greenspan was most likely only making a quick quip about monetary reserves before Congress, that even in duress, anything other than gold or silver was preferred by central bankers. He wasn’t advocating using cattle as cash. Okay, that is most likely correct, as is that most of the members of Congress listening to him totally missed the joke, and took his comments at face value.
To this day, 110 years after they legislated this monstrosity into our current reality, Congress has never demanded a public audit of the books of the Federal Reserve. That plus, when was the last time there was a public audit of the US gold reserves? No one really knows. So, I believe we can question whether the US gold reserves even exists anymore, other than as a stack of paper IOUs owed to the US Treasury, by persons and entities unknown, and untraceable.
Do I sound like I’m in a foul mood? Well, I guess I am. But with Thanksgiving just two weeks away, for the sake of all the turkeys that will soon be consumed by America, I’m going to tone it down, and talk about market stuff for the rest of this article.
Buying and selling pressure in the stock market can be gauged by following the NYSE 52Wk H-L nets seen in the table below. During a buying orgy, 52Wk H-L Nets can rise to over +500. The largest positive 52Wk H-L Net at the NYSE since August 1982, when the current bull market began, was +661 on May 10th 2021. This isn’t surprising, with the “liquidity” flowing from FOMC idiot primate Powell’s massive Not QE#4 (chart above) still surging into the financial system.
During a selling panic, seeing NYSE 52Wk H-L nets falling below 1,000 is typical. On 10 October 2008, during the sub-prime mortgage selling panic, on the day the Dow Jones deflated 40% from its last all-time high, for the first time since April 1942, the NYSE saw a massive negative 52Wk H-L net spike of -2,891. Of the 3,306 issues trading that day at the NYSE, on 10 October 2008, 87.75% of them hit a 52Wk Low that day. Wow! The Dow Jones, and most market indexes didn’t bottom for another five months. But on a 52Wk Low basis, the sub-prime mortgage bear market bottomed on October 10th 2008.
Note on the chart below: It plots the ratio of NYSE 52Wk H-L Nets to the total issues trading at the NYSE that day. Not the same, but close enough.
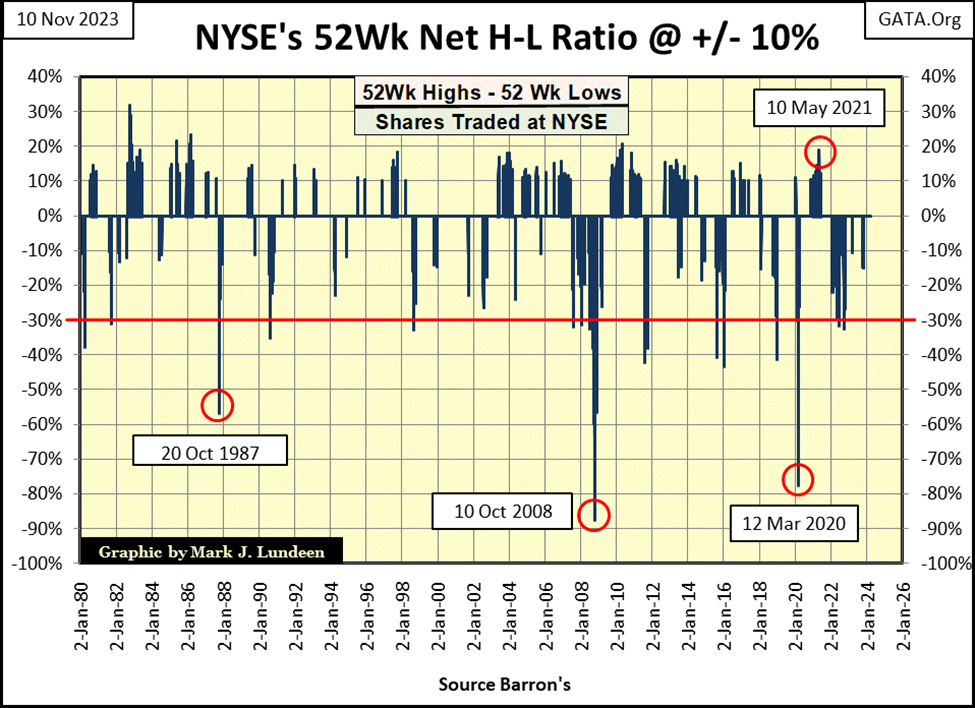
Bear that I am, I’m thinking the 52Wk Low extreme of 10 October 2008 is a record that will be broken sometime in the pending bear market, when the house-of-cards the idiots at the FOMC have reduced the financial system into, comes tumbling down.
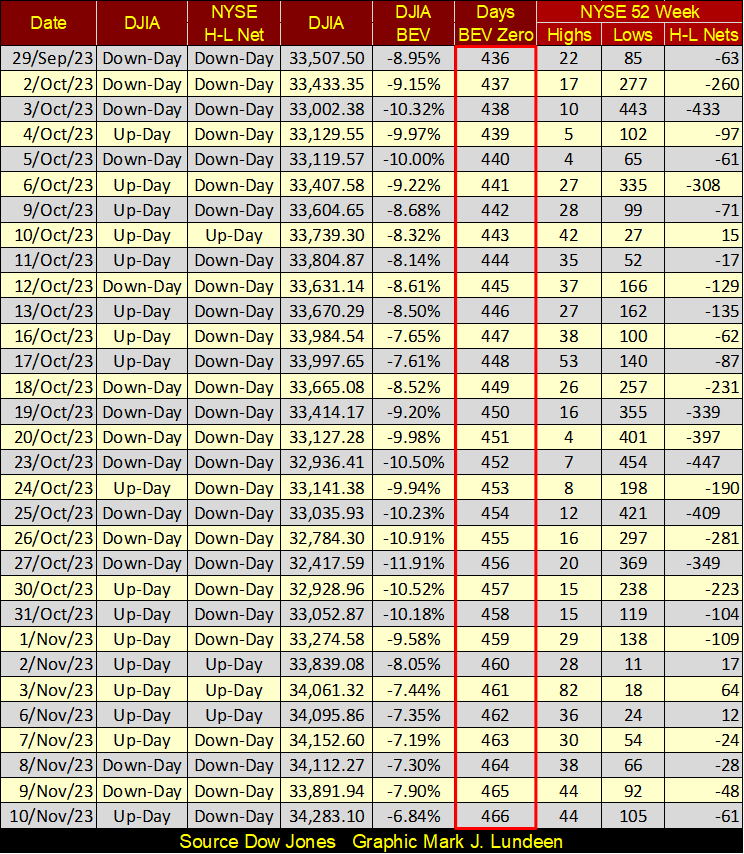
Back to looking at the 52Wk H-L Nets of the past month (above), triple-digit negative nets are common, but far below -1000 nets. Meaning, no selling panic in the past month. We also see a handful of positive nets, but all are below +100, so the bulls aren’t happy either with the trading since September.
There is a column in the table above, the Days BEV Zero I highlighted in red. This is the number of NYSE trading sessions since the Dow Jones’s last all-time high, which was 04 January 2022. So far, the NYSE has seen 466 trading sessions since the Dow Jones’s last all-time high.
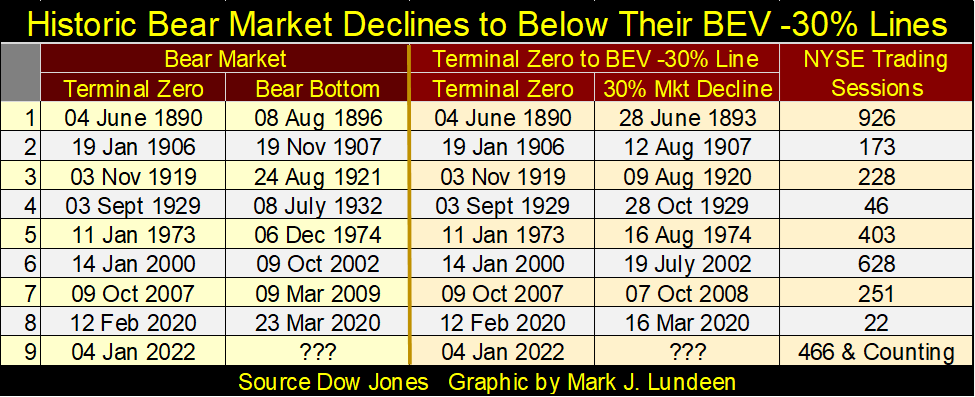
Okay, so what? It’s something to be aware of, that following the last all-time high of a bull market, or Terminal Zero (TZ) in a BEV chart, it takes so many days before the market reaches its ultimate bear market low. This brings us to the table below looking at historical bear markets; how many NYSE trading sessions it took these bear markets to first deflate below their BEV -30% lines? Something our current bear market has yet to do (see Dow Jones BEV chart above).
Having 466 NYSE trading sessions since the Dow Jones last all-time high is a long time for a bear market to * NOT * break below its BEV -30% line. So, why believe we’re in a bear market? I do for many reasons, pathic dividend yields and low daily volatility for the Dow Jones for two of my reasons, situations found at market tops, prior to a bear market decline.
But historically, seeing more than 466 NYSE trading sessions prior to a massive bear market breaking below its BEV -30% line for the first time have happened. In the 1890s, back when horses pulled taxi cabs on Wall Street, the Dow Jones was in a bear market (#1 in table below) that bottomed with a 47% market decline. But it took 926 NYSE trading sessions before this big-bear market first deflated by 30%.
Then during the NASDAQ High-Tech bear market for the Dow Jones, #6 in the table, it took 628 NYSE trading session before the Dow Jones finally deflated 30% from its last all-time high.
The point made in the table above, is some things, like big bear markets can take a long time. Looking at the Dow Jones in daily bars below, this is a market that isn’t in a hurry to go up, or down. This week, the Dow Jones 34,500 line proved to be a hard ceiling to the market. Should it break above it this coming week, what then; 35,000? What it failed to do last September; I doubt it will do in November.
I’m thinking the next big thing, whenever that big thing comes about, will be to the downside, towards the Dow Jones BEV -30% line, or 25,759 in points. Obviously Mr Bear is taking his time, and there is nothing anyone can do to hurry him up.
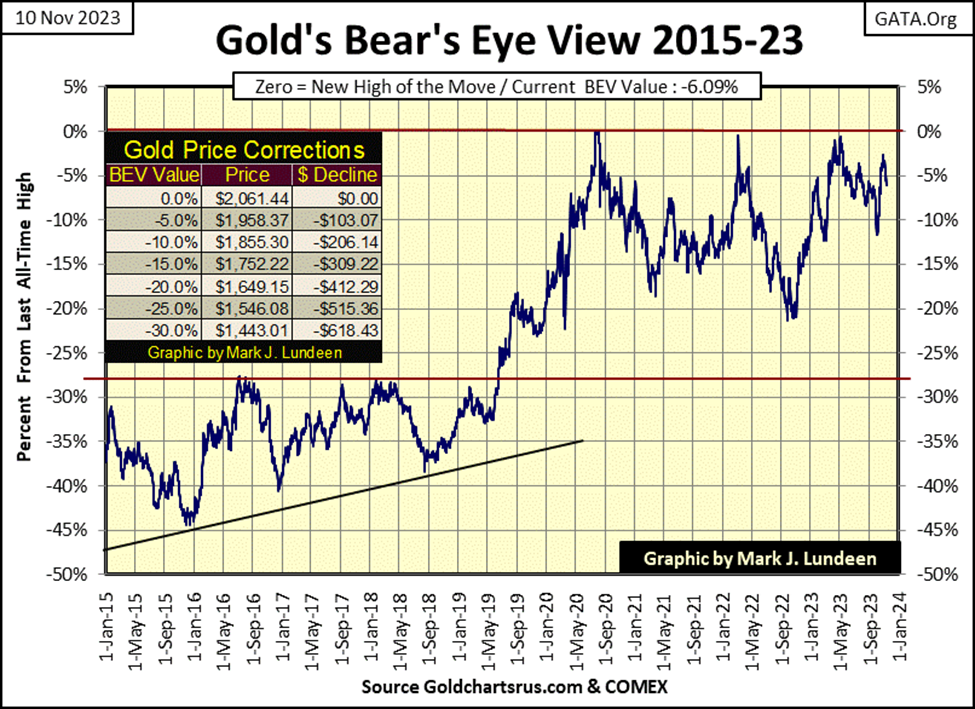
Let’s look at gold’s BEV chart. Sorry to say it, but closing the week with a BEV of -6.09%, gold failed to remain in scoring position. For gold to stay in scoring position is important, as that is what an advancing market does; repetitive daily closes at new all-time highs (BEV Zero), or in scoring position.
This isn’t very clear in gold’s BEV chart below, but go back to the Dow Jones’ BEV chart at the top of this article, and see what a big-market advance looks like in a BEV chart; lots of BEV Zeros and many, many daily closes in scoring position. This is the distinctive market pattern of a massive bull market advance, noticeable absent in gold’s BEV chart below.
Like bear markets, as noted above, where they can take their own time in going down, to the frustration of both bulls and bears alike. Obviously the same is true for the current bull market in gold, silver, and precious metals mining companies. For those who are having difficulties dealing with the frustration of this bull market in gold and silver, and I’m one of this group, maybe here is some advice that could prove to be helpful.
I had a very good friend who passed away in 2002. We met washing dishes on the USS Mobile, an LKA, or combat-cargo ship for the Marine Corps. Ed’s journey to the Mobile’s scullery was unusual but interesting; he was an electrical engineer, whose education was paid for by the Naval ROTC Officers program. He had some personal problems with relations with the fairer sex that resulted in him not completing the program, so he wasn’t an officer.
Still, he was an electrical engineer, and he felt he owed something to the Navy for his education. So, he enlisted and met me washing dishes for 600 sailors and marines, for breakfast, lunch and dinner, seven days a week as our ship traveled from Hawaii to the land of the Rising Sun, Japan.
Ed was damn good with computers, and wrote his own programs in C language at his work after he finished his naval service. When I got involved with computers around 1988, he shared with me some computer advice he first learned at the University of Texas, advice I never forgot.
Ed said when my damn computer is creating maximum frustration, take a piece of paper and draw a bull’s eye on it, write “Bang Head Here” on it, and tape it to a brick wall. The way this market is going in November 2023, both the bear market in stocks and the bull market in gold and silver, that nugget of high-tech advice seems very appropriate.
Looking below on gold’s side of the step sum table below, was enough for me to execute the Bang-Head-Here sub-routine described above. Look at all that red. But when I noticed it took all that red seen below, to finally force gold out of scoring position with this Friday’s close of BEV -6.09%, after sixteen days of the COMEX goons doing their best to drive gold out of it, I decided to abort the above sub routine, which I was glad to do.
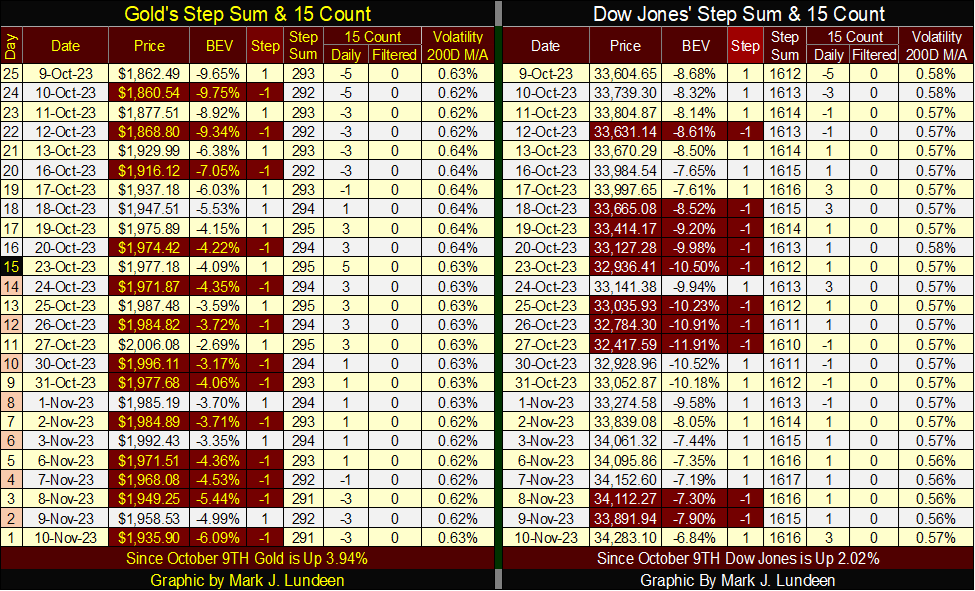
On the Dow Jones side of the step sum table, look at all those daily advances. Yet as seen in the Dow Jones charts above, it’s not roaring upward in a strong bull market advance. For both gold’s, and the Dow Jones’ step sum tables above, one’s first impressions of each is a bit deceiving. Gold is stronger than it at first appears, and the Dow Jones is weaker. Exactly what that will mean in the weeks ahead, I haven’t a clue.
__
(Featured image by nosheep via Pixabay)
DISCLAIMER: This article was written by a third-party contributor and does not reflect the opinion of Born2Invest, its management, staff or its associates. Please review our disclaimer for more information.
This article may include forward-looking statements. These forward-looking statements generally are identified by the words “believe,” “project,” “estimate,” “become,” “plan,” “will,” and similar expressions. These forward-looking statements involve known and unknown risks as well as uncertainties, including those discussed in the following cautionary statements and elsewhere in this article and on this site. Although the Company may believe that its expectations are based on reasonable assumptions, the actual results that the Company may achieve may differ materially from any forward-looking statements, which reflect the opinions of the management of the Company only as of the date hereof. Additionally, please make sure to read these important disclosures.


Blockchain Evolves Toward AI, Finance and Quantum Security
Blockchain is evolving beyond crypto into finance, AI applications, and digital markets, while security and regulation remain challenges. Quantum threats...


The Italian Crowdinvesting Market Faces Sharp Decline in 2026
Italian crowdinvesting market continued to decline in 2026, with fundraising falling 36.8% year-on-year to €164.19 million. Platforms and active campaigns...


Sartorius Stedim Biotech Maintains Growth Momentum in H1 2026
Sartorius Stedim Biotech reported solid H1 2026 results, with revenue reaching €1.527 billion and EBITDA rising to €479 million. Growth...


Bank of Africa Launches BOA MDM Network to Boost Diaspora Investment in Morocco
Bank of Africa launched the BOA MDM Network to channel diaspora remittances into productive investment, aiming to raise their share...


Switzerland’s Medical Cannabis Reform Advances Access, But Barriers Remain
Switzerland’s 2022 medical cannabis reform improved patient access by removing federal approval requirements, but challenges remain. MEDCAN highlights barriers including...
 |
|
 |  |
 |
|
-

 Africa2 weeks ago
Morocco Cuts Card Fees to Spur Digital Payments, but Uncertainty Remains
-
 Biotech2 days ago
Sartorius Stedim Biotech Maintains Growth Momentum in H1 2026
-

 Cannabis1 week ago
Virginia Cannabis Market Could Reshape Regional Competition
-

 Impact Investing5 days ago
Ecobnb Turns Sustainable Tourism Into Measurable Impact