Markets
Debt, Deficits, and a Fragile Future: Dimon’s Warning for U.S. Markets
Jamie Dimon warns the bond market may collapse due to unsustainable U.S. debt, deficits, and spending. Federal debt could hit $46.7 trillion by 2029. Rising interest costs, declining global demand, political instability, and growing shadow banking risks all heighten financial fragility. Despite this, markets rise, but refinancing pressures and debt bubbles pose looming systemic threats.

Jamie Dimon, the CEO of JPMorganChase, believes the bond market is highly vulnerable and could collapse. Mr. Dimon points out correctly what we have said (yes, we have a much lower profile)—that the U.S. debt, spending, and deficits are unsustainable. The so-called “Big, Beautiful Bill” predicts that, given the tax cuts and minimal spending cuts, the current $2 trillion dollar budget deficits will continue.
That would set the U.S. on course for potential debt outstanding by 2029 of $46.7 trillion, up from the current $36.9 trillion, making it the highest federal debt in the world. Debt to GDP would soar from 124% to 140% while budget deficit spending could reach $3 trillion/year, up from $2 trillion/year. Interest alone on the debt would go from $1 trillion to $1.4 trillion, higher than defense spending.
The Economist in a recent article (“New and untested,” May 31, 2025) noted that the U.S. has moved from being a safe haven to a dangerous one. They cite that the U.S. is now a source of instability, with an alarming rise in government debt, legal conflicts dominating trade policies, conflicts with states and groups, conflicts and uncertainty surrounding trade, and a dangerous attack on the country’s institutions, particularly educational institutions.
They should also have noted the destabilization of America through extreme polarization, the conduct of ICE in deporting illegals, with many of them not being illegals, and the rise of armed militias (estimated at over 200, but possibly more) from the extreme right, including white supremacists, black groups, and even left-wing groups that are gaining support from threatened transgender and LGBTQ. That any major clashes have not broken out is surprising, although that could be changing given the current clashes in Los Angeles where the National Guard is being called in. There have also been skirmishes, not only between militias and others but also with direct confrontational protests against ICE and regular protests against the actions of the Trump administration.
While the huge money center banks still dominate American finance, there have emerged as well asset managers, hedge funds, private equity firms, and trading firms such as Apollo, BlackRock, Citadel, Jane Street, KKR, and Millenium. Call them the shadow banking. Add in others such as Goldman Sachs, Morgan Stanley, Ares Management, and Blackstone and you have a hidden financial system that makes the large money center banks pale in comparison.
BlackRock has $11.6 trillion under management. JPMorganChase is the largest bank with $4.3 trillion in assets. What if something went wrong with shadow banking? It could engender a crisis that could pale the financial crisis and Great Recession of 2007–2009.
Going back further, some of us still remember the Russian default in 1998 that helped trigger the collapse of the hedge fund Long Term Capital Management (LTCM). That collapse almost triggered a global financial meltdown that was saved only by the quick action of the Fed and other central banks. History then repeated itself in 2008 and again in 2020 during the COVID pandemic.
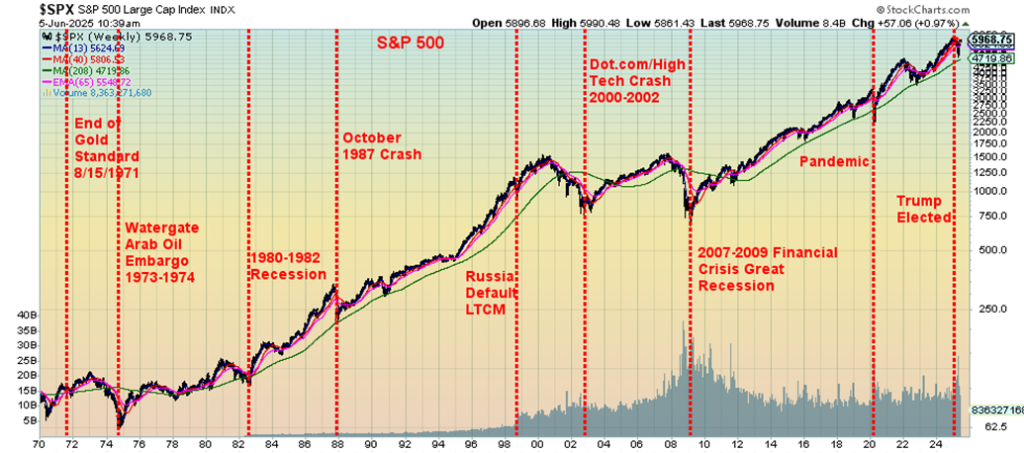
The S&P 500 is up roughly 6,300% since 1970. For the record, gold is up almost 9,500%. It is also noteworthy that M1 money supply has increased over 8,900%. U.S. federal debt is up 9,200% and all debt (government, corporation, households) is up 6,800%. The period, particularly from the end of the gold standard in August 1971, has seen a sharp increase in volatility.
There has also been upswing in financial crises, with each successive recession steeper than the previous one. During the period, we experienced recessions in 1973–1974, 1980–1982, 1990–1991, 2000–2002, 2007–2009, and 2020. We’ve also experienced many other financial crises: the 1970s energy crisis, the Latin America debt crisis, the Japanese crash of 1990, the Savings and Loans crisis of 1986–1995, the Asian financial crisis (1997), Russian financial crisis (1998), the bursting of the dot.com bubble (2000), the global financial crisis (2008) that also saw a bursting of the oil price bubble and the sub-prime loan crisis, the European debt crisis (2009–2019), the bursting of the Chinese stock market bubble (2015–2016), the pandemic crisis (2020), and more recently the “Liberation Day” tariff crisis (2025).
The hits just keep on coming, yet against that backdrop the stock market keeps rising, even as today it is overvalued by a number of measurements. The ending of the gold standard unleashed one of the biggest debt binges ever seen. As we moved into the financial crisis-driven 2000s, interest rates were lowered to unheard-of levels to zero and in some cases sub-zero or negative. This in turn unleased one of the biggest bubbles ever seen as asset prices increased sharply including stocks, houses, and more. The introduction of crypto currencies led by Bitcoin unleashed another bubble. Overlooked is the debt bubble, where today the world has over $315 trillion in debt with the U.S. having $104.2 trillion in debt (governments, corporations, households).
S&P 500 1970–2025
The U.S. will have a refinancing problem going forward. Over $9 trillion of debt comes due in 2025 and will need to be refinanced, undoubtedly at higher interest rates. Add in the probable $2 trillion in deficit financing and we are looking at total requirements in 2025 alone of $11 trillion. Given the requirements, it is surprising to find U.S. bond auctions have continued to be well bid. The U.S. is still recognized as having the best credit in the world, despite the recent Moody’s downgrade from Aaa to Aa1.
However, international demand has been wavering, with lower participation from both China and Japan. Despite an increase of $941 billion held by foreigners over the past year, China is essentially flat while Japan is down $36 billion. The slack has been picked up by the U.K., Canada, and Luxemburg, amongst others. The Fed hasn’t picked up much as their assets are down almost $2.3 billion since peaking in 2022. The Fed has been rolling off assets as they raised interest rates (quantitative tightening, QT).
No wonder we’ve seen a sharp rise in net interest expense (U.S. treasuries) as a percentage of tax revenue since roughly 2015. It peaked out around 20% in the early 1990s and now it is back at those levels and projected to go higher. Even with the rise in net interest expense, the fear is that bond yields could rise further, making the U.S. debt even more expensive. The U.S. has a spending problem, making them increasingly vulnerable to higher interest rates and the rollovers. While the current bond auctions are being met with buyers, there is some fear that one day not enough buyers will show up.
So far, so good. But what if that changes, given the demands? A weak U.S. dollar is not helping. Notably Japanese bond auctions are now being under bid thus forcing up Japanese interest rates. As we noted in last week’s “Scoop” (June 2, 2025 Technical Scoop eCommentary68) Japan also has a huge debt problem.
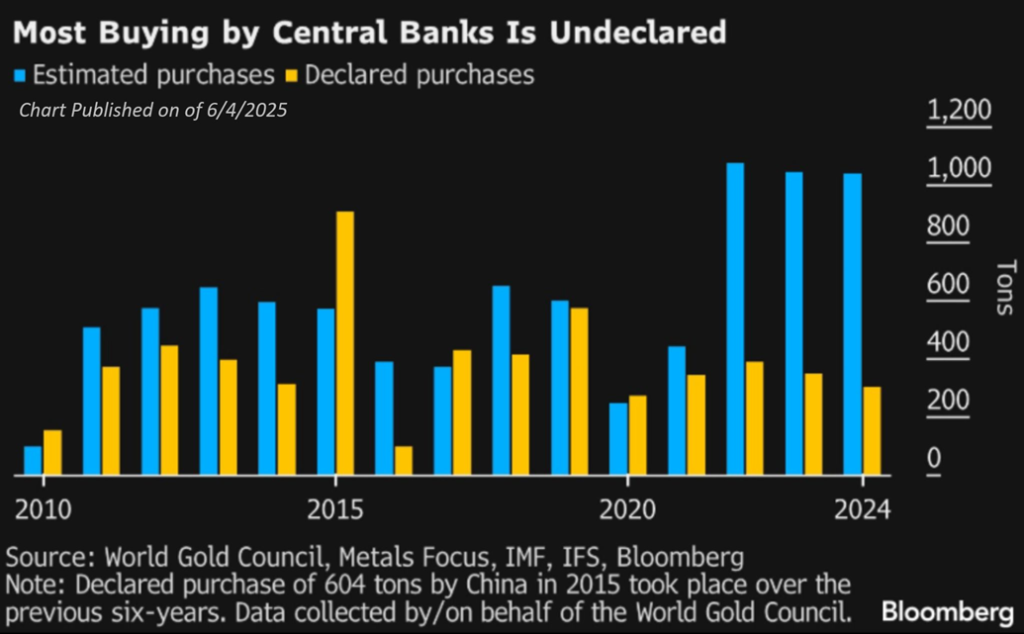
No wonder central banks around the world are buying gold. According to Bloomberg, there is what the central banks report officially, and then there is how much they are really buying. The trade wars are not helping. Also not helping are threats of escalation on the Russia/Ukraine war front. The freezing of Russian assets after the 2022 invasion also unleashed more buying. There is fear from foreign creditors that they could be treated less favourably going forward. Hence, sell U.S. treasuries and buy gold. Gold has a long history as money. The governor of the National Bank of Poland summed it up by saying “gold is the safest reserve asset.” It cannot be linked to the economic policy of any country.
Repeat: gold is a safe haven in times of geopolitical tensions, economic uncertainty, and loss of faith in government. None of this has stopped some central banks from unloading their gold as the U.K. did in the 1990s and more recently Switzerland and Canada. They may pay for it later as the value of their U.S. treasuries declines while gold rises. Already it is estimated in the U.S. that bond holders sit on over $1 trillion in bond losses due to the rise in interest rates. They can hold them to maturity. However, bond buyers might be wise to shorten the duration by selling long dates and buying short dates.
Net Interest Expense as a % of Total Tax Revenue

Central Bank Gold Buying 2010–2025
The global bond market is huge, with the biggest being the U.S. market, which has over 40% of that market. The size of the global bond market is estimated at $130 trillion, which is only about 41% of all debt outstanding (loans, mortgages, credit cards, etc. make up the rest). When you combine the U.S. bond market with that of the EU, Japan, and China, you have over 80% of the market. The largest share is the U.S., followed by Japan.
We noted in our Technical Scoop, June 2, 2025 the problems in Japan. While we believe that Japan has the biggest problem, the U.S. because of its sheer size is right behind. No, we don’t fear a U.S. default, but with what we call the bond vigilantes circling, these markets are a big problem going forward. Then there is the potential for a growing rift between President Trump and Fed Chairman Jerome Powell. Markets would not take kindly to that. There is just too much debt and something will have to give.
Chart of the Week
U.S. Job Numbers
U.S. Employed Persons vs. Unemployed Persons 2015–2025
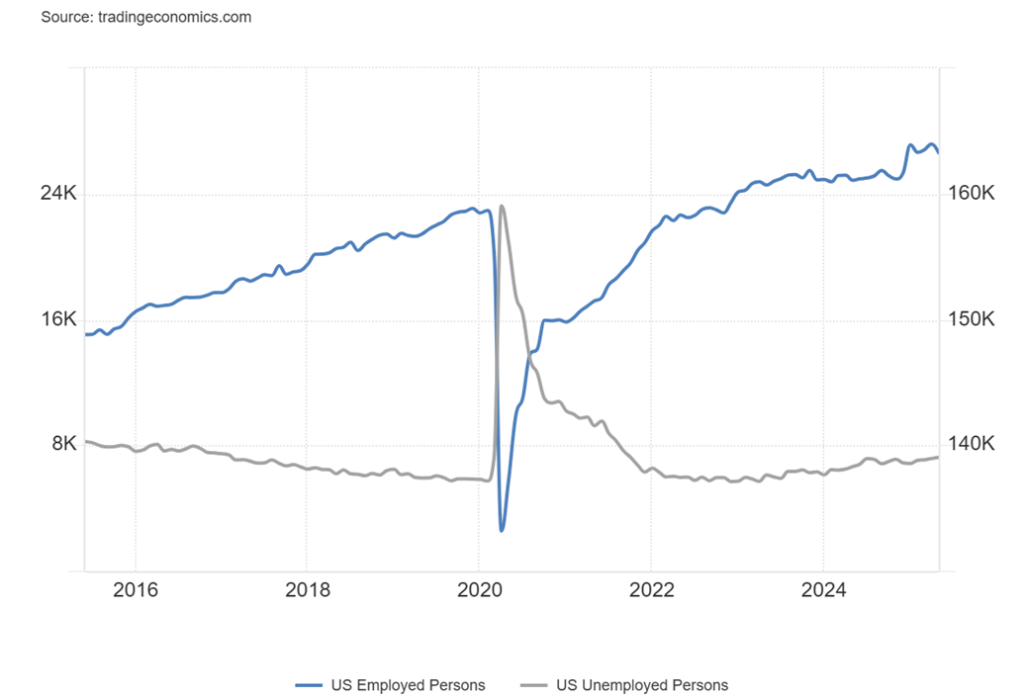
We suppose we could say that the May nonfarm payrolls was good news because it was better than expected. Yes, the jobs report came in at 139,000, but dig deeper and we find that the April and March reports were revised lower by 95,000. Not good. The market expected 130,000 jobs. We also discover that the civilian labour force contracted by 625,000. However, that number can be volatile as the month before it was up 401,000 in April and up 201,000 in March.
The participation rate dropped to 62.4% from 62.6%, which helps explain why the unemployment rate U3 was unchanged at 4.2%. The U6 unemployment rate (plus all persons marginally attached to the labour force, plus total employed part-time for economic reasons, as a percent of the civilian labour force, plus all persons marginally attached to the labour force) was also unchanged at 7.8%. Shadow Stats reported its unemployment rate at 27.5% also largely unchanged.
| The ShadowStats-Alternate Unemployment Rate uses current unemployment reporting methodology adjusted for the significant portion of “discouraged workers” defined away in 1994. |
| The BLS estimate of its broadest U-6 unemployment rate includes discourage workers as currently defined (discouraged workers less than one year). ShadowStats adjusts the BLS measure to include the ShadowStats estimate of longer term/discouraged workers – those discouraged for more than one year’ |
| those who want to work, where no local jobs are available, and are not included in the BLS calculations. ShadowStats discouraged workers show up in the not in labour force category. |
Note how that chart of employed persons vs. unemployed persons shows a decline for employed persons and a rise for unemployed persons. Full-time employment contracted 623,000, but that may have been a factor of the drop in the civilian labour force. Meanwhile, part-time employment rose 33,000 to its highest level since 2019. The employment population ratio dropped to 59.7% from 60.0%. All pointing to fewer participants. That probably helps explain why the not in the labour force category rose 622,000. Not all are retirees, students, and stay-at-home parents. Offsetting this was the rise in the employment level by 696,000. Meanwhile, the number for those officially unemployed (U3) rose by 73,000.
One that dropped was for those working multiple jobs, which fell from 5.4% to 5.3%. The average weeks unemployed also fell to 21.8 weeks vs. 23.2 weeks. The median weeks unemployed also fell to 9.7 from 12.0. Through all this, the total population (15 years and older) rose 520,000.
The bulk of the new jobs were in health care/private education and also in leisure and hospitality (which tends to be part-time jobs). Manufacturing fell as did federal public sector employees as we see the first impact of DOGE. The work week was 34.3 hours as expected and hourly earnings rose 0.4% while year over year (y-o-y) hourly earnings were up 3.9%.
Maybe the reported job numbers were close to expectations, but underneath we see weakness that could be seen in future job numbers. We have yet to see the full impact of the trade wars. The results saw stocks rise, the US$ Index rise, bond yields rise, and gold off small.
Canada Job Numbers
Canada Employed Persons vs. Unemployed Persons 2015–2025
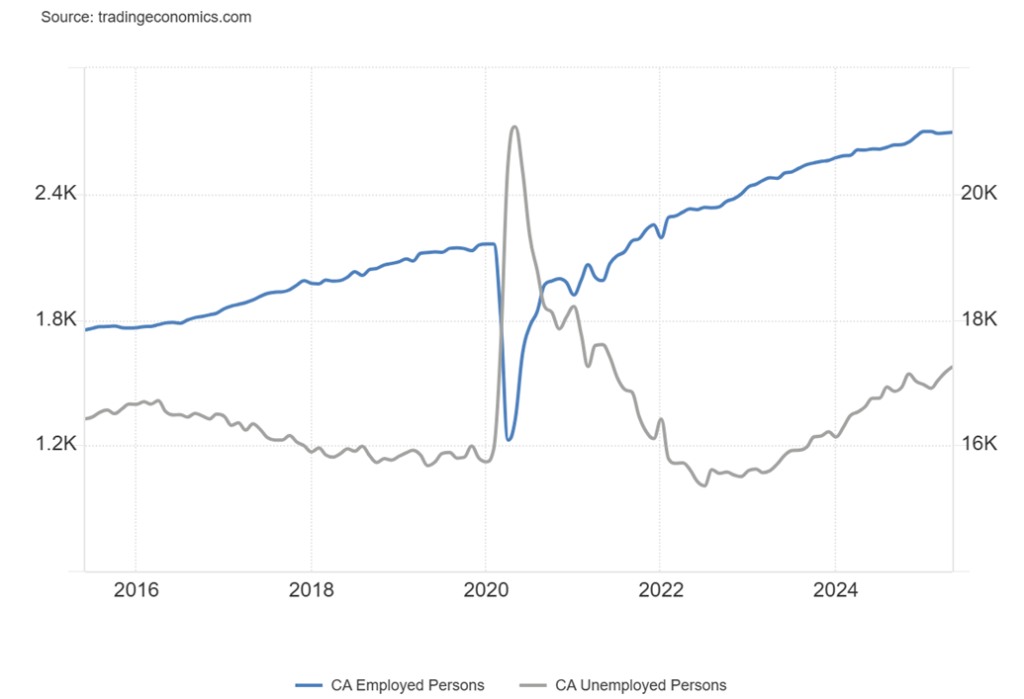
Canada reported a gain of 8,800 jobs in April. That was slightly above the expected 5,000. The April number was a gain of 7,400 jobs. The distribution, however, was a surprise as it was reported that full-time employment gained 57,700 while part-time lost 48,800. The unemployment rate ticked up to 7.0% from 6.9%. The R8 unemployment rate, the highest reported by Statistics Canada (plus discouraged searchers, waiting groups, portion of involuntary part-timers), fell to 9.1% from 9.2%. The number of employed persons rose by 7,000 while the number of unemployed persons also rose up 39,000.
The biggest gains came in wholesale and retail trade, up 43,000 while public administration lost 32,000. Some of the loss could be attributed to the drop in the number employed because of the election. Manufacturing lost 12,200 jobs. But manufacturing is the most vulnerable to the trade wars. The average weeks unemployed jumped to 21.8 vs. 18.4. Average hourly earnings were up 3.9% y-o-y. There is uncertainty going forward of the potential impact of the trade war with the U.S. More jobs are anticipated to be lost. Students are having some trouble finding summer jobs.
The Bank of Canada (BofC) left the bank rate unchanged at this week’s interest rate decision. The bank is still seeing inflation pressures but acknowledges the weakening economy. The next interest rate decision isn’t until July 30. We note that the European Central Bank dropped the EU rate by 25 bp as was widely expected. The Fed meets on June 17–18 and the expectation is that they will leave the rate unchanged.
We view this report as mildly negative at this time. The gain in full-time jobs was a surprise, making us wonder if we’ll see a reversal going forward.
Markets & Trends
| % Gains (Losses) Trends | ||||||||
| Close Dec 31/24 | Close Jun 6/25 | Week | YTD | Daily (Short Term) | Weekly (Intermediate) | Monthly (Long Term) | ||
| ne | ||||||||
| S&P 500 | 5,881.63 | 6,000.36 | 1.5% | 2.0% | up | up | up | |
| Dow Jones Industrials | 42,544.22 | 42,762.87 | 1.2% | 0.5% | up | neutral | up | |
| Dow Jones Transport | 16,030.66 | 14,877.23 | 1.3% | (6.4)% | up | down | down | |
| NASDAQ | 19,310.79 | 19,113.77 | 2.0% | (1.0)% | up | up (weak) | up (weak) | |
| S&P/TSX Composite | 24,796.40 | 26,429.13 (new highs) * | 1.0% | 6.9% | up | up | up | |
| S&P/TSX Venture (CDNX) | 597.87 | 721.60 (new highs) | 3.9% | 20.7% | up | up | up | |
| S&P 600 (small) | 1,408.17 | 1,311.76 | 2.1% | (6.9)% | up | down | neutral | |
| MSCI World | 2,304.50 | 2,655.75 (new highs) * | 0.6% | 15.2% | up | up | up | |
| Bitcoin | 93,467.13 | 104,184.56 | (0.1)% | 11.7% | neutral | up | up | |
| Gold Mining Stock Indices | ||||||||
| Gold Bugs Index (HUI) | 275.58 | 419.12 (new highs) | 5.3% | 52.1% | up | up | up | |
| TSX Gold Index (TGD) | 336.87 | 490.16 (new highs) | 2.3% | 45.5% | up | up | up | |
| % | ||||||||
| U.S. 10-Year Treasury Bond yield | 4.58% | 4.51% | 2.5% | (1.5)% | ||||
| Cdn. 10-Year Bond CGB yield | 3.25% | 3.34% | 4.4% | 2.8% | ||||
| Recession Watch Spreads | ||||||||
| U.S. 2-year 10-year Treasury spread | 0.33% | 0.46% | (6.1)% | 39.4% | ||||
| Cdn 2-year 10-year CGB spread | 0.30% | 0.64% | 4.9% | 113.3% | ||||
| Currencies | ||||||||
| US$ Index | 108.44 | 99.19 | (0.2)% | (8.5)% | down | down | down | |
| Canadian $ | 69.49 | 0.7301 | 0.2% | 5.1% | up | up | down | |
| Euro | 103.54 | 113.96 | 0.4% | 10.1% | up | up | up | |
| Swiss Franc | 110.16 | 121.61 | 0.1% | 10.4% | up | up | up | |
| British Pound | 125.11 | 135.30 (new highs) | 0.5% | 8.1% | up | up | up | |
| Japanese Yen | 63.57 | 69.06 | (0.6)% | 8.6% | down (weak) | up | neutral | |
| Precious Metals | ||||||||
| Gold | 2,641.00 | 3,309.91 | 0.5% | 25.3% | up | up | up | |
| Silver | 29.24 | 35.94 (new highs) | 9.0% | 22.9% | up | up | up | |
| Platinum | 910.50 | 1,171.30 (new highs) | 11.8% | 28.6% | up | up | up | |
| Base Metals | ||||||||
| Palladium | 909.80 | 1,050.00 | 9.1% | 15.4% | up | up | down | |
| Copper | 4.03 | 4.80 | 2.8% | 19.1% | up | up | up | |
| Energy | ||||||||
| WTI Oil | 71.72 | 64.66 | 6.2% | (9.8)% | up | down | down | |
| Nat Gas | 3.63 | 3.77 | 9.0% | 3.9% | up | up | neutral | |
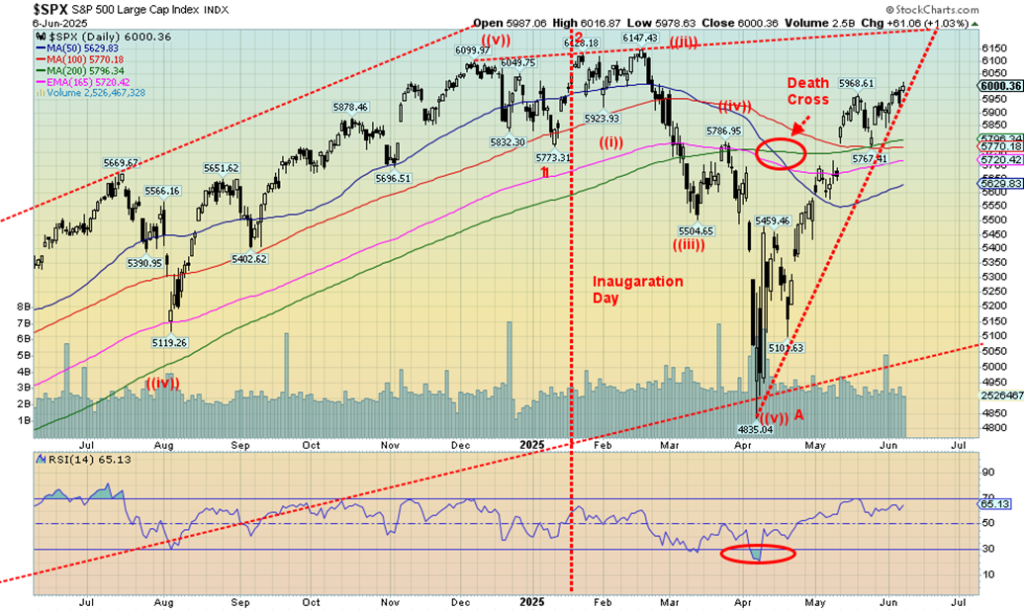
Onward and upward. If there is one thing we know, it’s that stock market buyers are showing little fear (it’s now greed) as they move higher. All the goings-on between Musk/Trump, thoughts of a recession, and geopolitical tensions are tossed aside. The focus instead is on Trump’s “Big Beautiful Bill” with its big tax cuts. The market is expecting that, even if it isn’t in its original form, the bill will eventually pass, including the tax cuts. Trump’s tax cuts in 2017 sparked a huge stock market rally that didn’t finally top until February 2020 and then the pandemic hit. It also unleashed a housing bubble.
So investors, it seems, have thoughts of a repeat event dancing their heads. They also expect the trade wars to ease, which in turn improves the conditions further. But what if they are wrong? Irrespective of this, it is amazing how quickly the market switches from fear to greed. Rises of this nature are unsustainable. Debt is good for stock markets as all that money has to go somewhere. We’re not even overbought yet with an RSI at 65, below the 70 threshold.
On the week, the S&P 500 rose 1.5%, closing just over 6,000 once again. The Dow Jones Industrials (DJI) was up 1.2%, the Dow Jones Transportations (DJT) was up 1.3%, and the NASDAQ was up 2.2%. Only the DJT remains down on the year, off 6.4%. The DJT continues to diverge sharply with the DJI, a negative sign for the market. The S&P 400 (Mid) was up 1.7% while the S&P 600 (Small) rose 2.1%. Both remain down on the year. The S&P 500 Equal Weight Index rose 1.2% and, as we note, is diverging with the S&P 500. The NY FANG Index rose 2.8% to new all-time highs. Bitcoin wobbled and closed down about 0.1% but remains above $100,000.
In Canada, the TSX Composite rose to new all-time highs, up 1.0%, while the junior TSX Venture Exchange (CDNX) was up 3.9% to new 52-week highs. In the EU, the London FTSE was up 0.7%, the EuroNext gained 1.0%, the Paris CAC 40 was up 0.7%, while the German DAX hit all-time highs, up 1.3%. In Asia, China’s Shanghai Index (SSEC) rose 1.1%, the Tokyo Nikkei Dow (TKN) was down 0.6%, while Hong Kong’s Hang Seng (HSI) gained 2.2%. The MSCI World Index hit new all-time highs, up 0.6%.
Buy the dip mentality rules. Amazingly, the S&P 500 has now passed the point that suggests new all-time highs are possible. So has the NASDAQ, but the DJI has not as yet given us that signal. The DJI needs to clear over 43,100 to suggest new all-time highs. The DJT is nowhere near any thoughts of new highs, let alone new all-time highs. The TSX, as we note, just keeps on making new all-time highs. So where is the danger point? Under 5,765 might suggest a top is in. Under 5,600 it’s confirmed. If we rise to 6,200, then we’ll make our all-time high, but the resistance line from the November 2024 to February 2025 highs is there. Our expectations are that even if we make new all-time highs, they will be feeble and we’ll stay at or below 6,200. Fear leads to buying. Greed leads to selling.
The Scorecard
Selected Performance Since Inauguration Day 2025
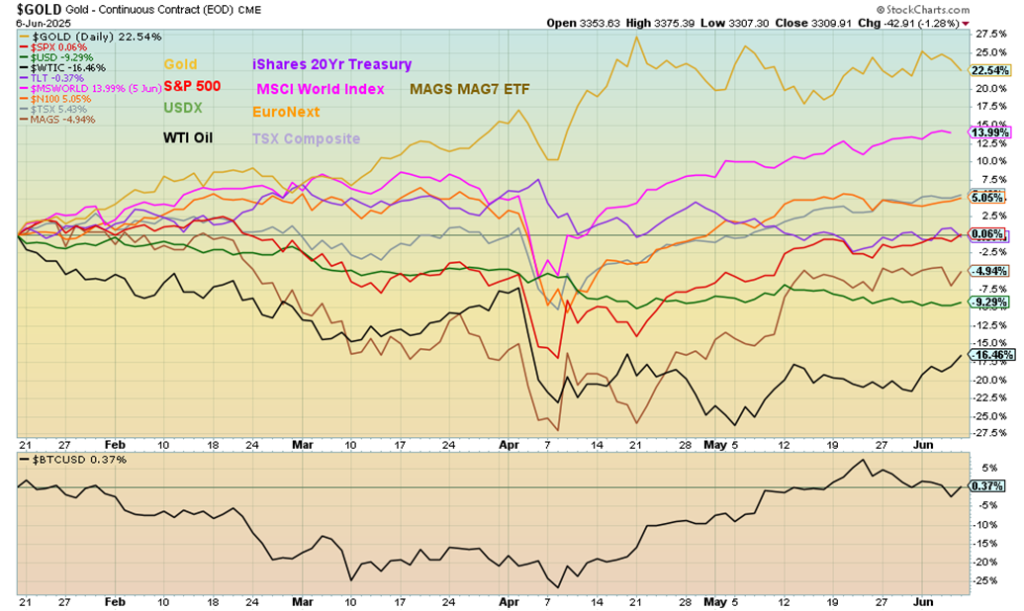
Our scorecard still shows gold continues to stay in the lead, up 22.5% since Inauguration Day. The MSCI World Index follows up 14.0%. The TSX Composite and the EuroNext are up 5.4% and 5.1% respectively. Despite the nice bounceback this past week, WTI oil remains in the cellar, down 16.5%. We note that the S&P 500 has crawled back just above break-even. It’s now up 0.06% since Inauguration Day. MAGS, the MAG7 ETF, is down 4.9%.
Trump vs. Musk 2025
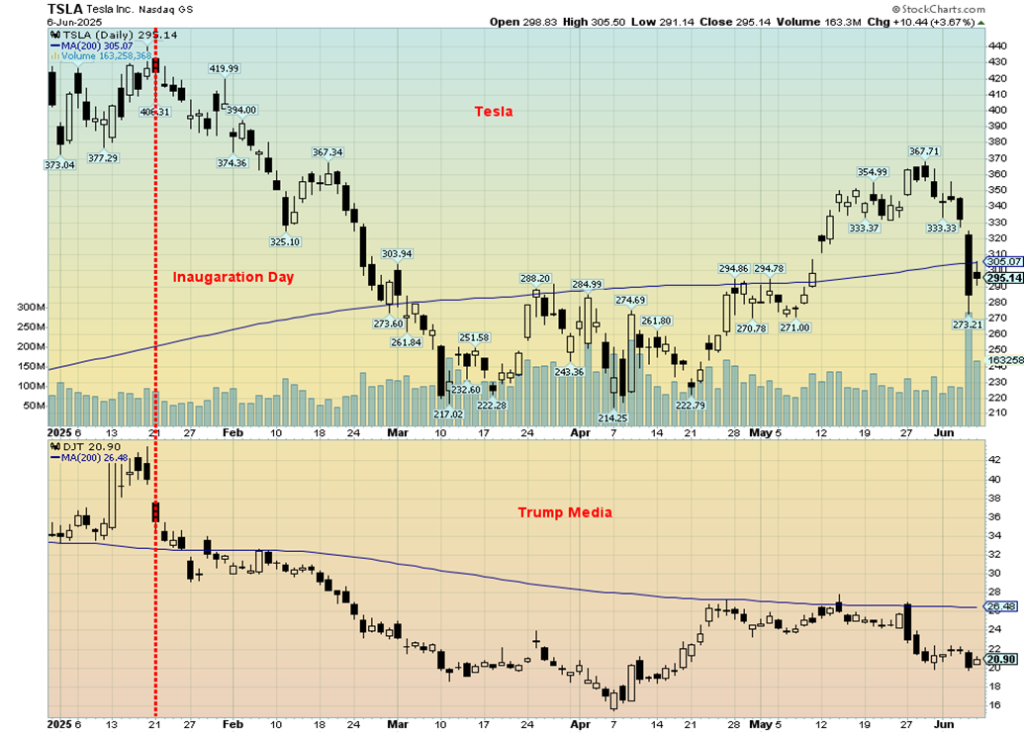
It’s the latest reality show. Yes, it’s the Trump vs. Musk BFF breakup in real time—the president of the United States vs. the richest man in the world. A script made in heaven. The greatest reality show? Trump has threatened to end all government contracts that the U.S. has with Musk companies. Musk has revealed that Trump was close with Jeffrey Epstein and is in the Epstein papers. Tit for tat. The markets didn’t like it and on the day the brawl got underway with verbal shots on Musk’s X (formerly Twitter) and Trump’s Truth Social, both their stocks fell. Reality show fans will be ecstatic with this development. Can even billionaires be brought down to earth?
The markets weren’t too pleased and on May 5 Tesla (TSLA) fell 14.3% while Trump Media (DJT) dropped 8.0%. It hasn’t been a great year for either one of them as TSLA is down 26.8% and DJT down 38.7%. It gets worse. TSLA has dropped 37.8% from its all-time high seen in December 2024 while DJT is down 73.4% from its all-time high set in March 2024. It’s a bitter little world.
S&P 500 vs. S&P 500 Equal Weight Index 2025
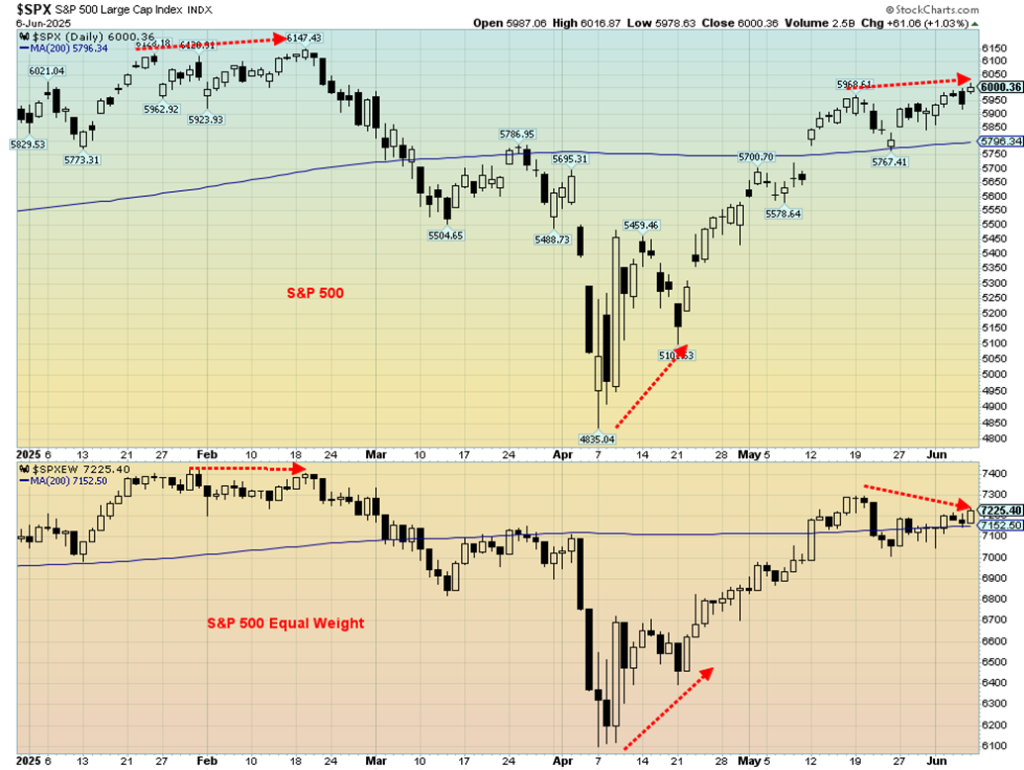
We have to consider this a divergence. The S&P 500, which is weighted, has been on an upward slope while the S&P 500 Equal Weight Index is on a downward slope. We saw a similar phenomenon back in January/February and the result was the market tipped over and fell. At the lows in April the two were in sync. No, this does not mean a decline is imminent or even that it will decline, but it should be noted if the recent lows are broken.
The S&P 500 has crawled over the 200-day MA while the S&P 500 Equal Weight Index is clinging to the 200-day MA. Our long experience with these divergences advises us we should pay attention as in this case it may be signaling a decline ahead.
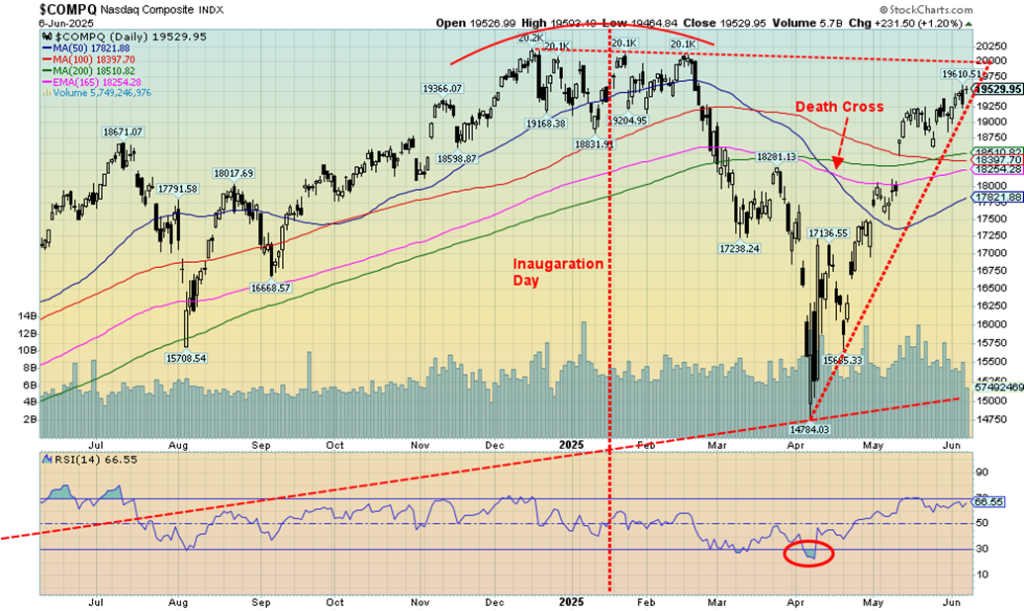
The NASDAQ continued its recent steep rise, up 2.2% this past week. The FAANGs/MAG7 didn’t hurt as the NY FANG Index was up 2.8% to new all-time highs. We are now fast approaching a major resistance line at 20,000. Above that level new highs are highly probable. Leading the NY FANG Index were a few making new all-time highs, including Microsoft +2.1%, Netflix +2.7%, Snowflake +2.4%, and Broadcom +1.7%.
The biggest gain was seen by MAG7 member Meta, up 7.6%. At the other end, MAG7 member Tesla fell 14.8%, thanks to the Musk/Trump war. MAGS, the MAG7 ETF, gained 0.5%. The FAANGs and MAG7 will continue to dominate the NASDAQ. The question is, will we break above 20,000? A breakdown under 18,750 could signal a top.
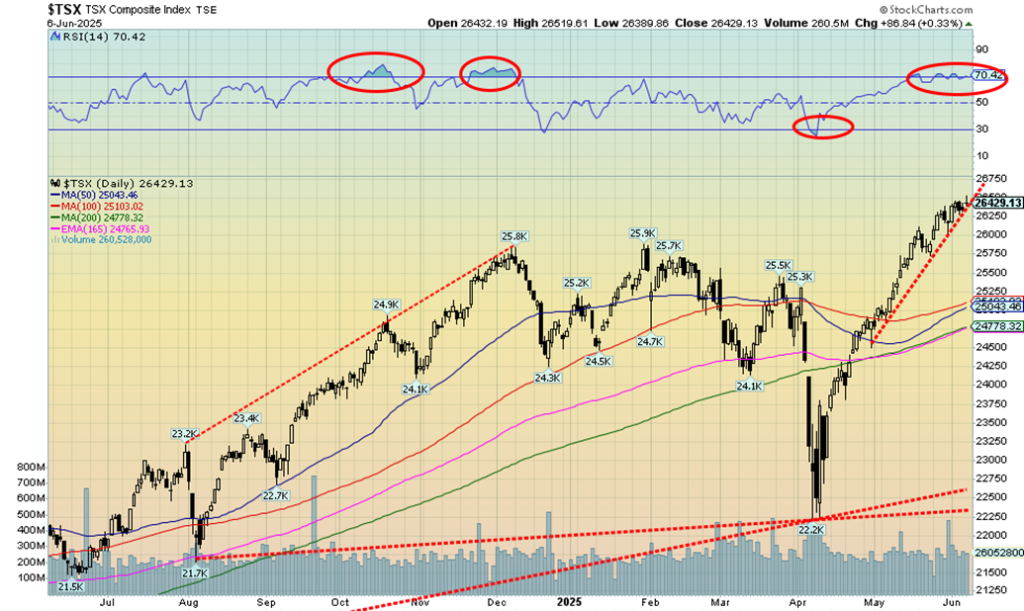
Higher and higher we go. Where it goes, nobody knows. What we do know is that straight-up moves like this are ultimately unsustainable. Since the low in April, we are up 19% with nary a pullback of any significance. Each week we continue to make new all-time highs and the RSI has been around 70 now for the past few weeks. We’d be reluctant to take on new positions here, but acknowledge we can’t tell where we will top. It doesn’t take much to bust this steep uptrend. Under 25,750 a top would most likely be confirmed. Those 50-day and 100-day moving averages are enticing, but they are down near 25,050. The 200-day MA is at 24,775. It’s been a feel-good rally.
Even the TSX Venture Exchange (CDNX) has performed, gaining 3.9% this past week to 52-week highs and is now up 20.7% in 2025. The TSX was up 1.0% this past week and is up 6.9% in 2025, the best performer of the major North American indices. The CDNX is far outpacing the U.S. S&P 400 (Mid) and S&P 600 (Small). But then the CDNX is heavily resource-based, where we are seeing life in the juniors that make up the index.
Of the 14 sub-indices, five were down and nine up. Leading the downs was the TSX Consumer Staples (TCS), down 1.9% after making all-time highs. Health Care (THC) was next, down 1.0%. Of the gainers, two saw all-time highs and four made 52-week highs. Gaining to new all-time highs were Consumer Discretionary (TCD), up 0.6%, and Financials (TFS), up 0.7%. Climbing to new highs were Golds (TGD) +2.3%, Metals & Mining (TGM) +3.2%, Materials (TMT) +3.3%. and Utilities (TUT) that fell 0.8% after making the new highs.
No surprise on the Materials group as they were expected to be the best performer in 2025 and haven’t disappointed. Energy (TEN) saw the largest gain on the week, up 3.4%. The TSX rise has been far too steep. A correction/pullback shouldn’t be a surprise.
U.S. 10-year Treasury Note, Canada 10-year Bond CGB
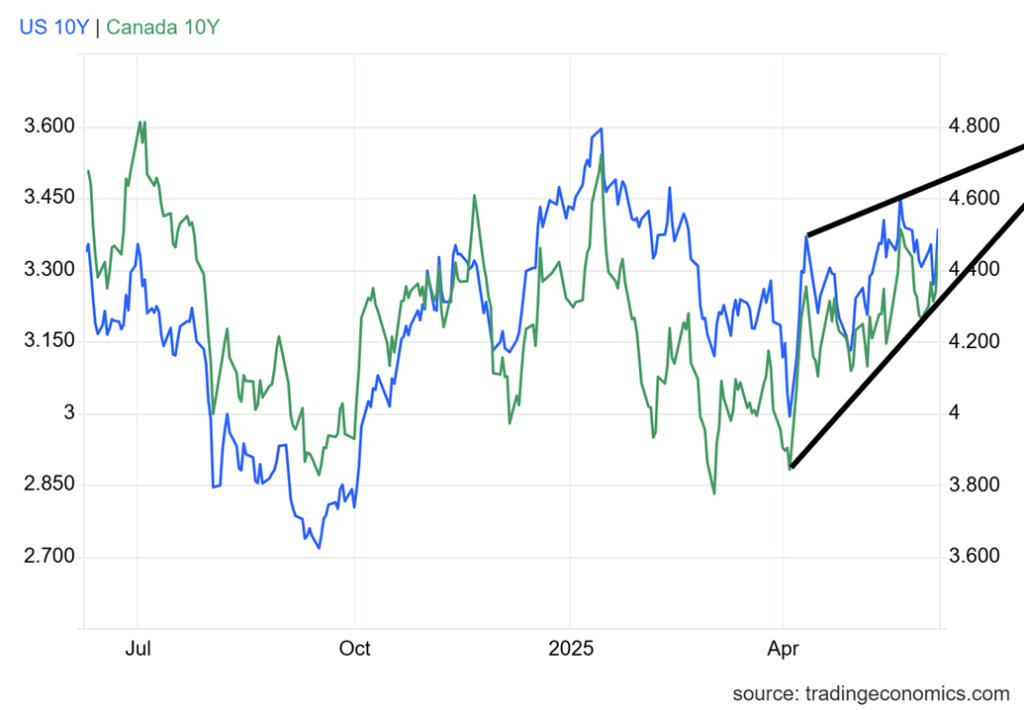
The bond market didn’t care for the mildly better than expected nonfarm payrolls released on Friday. Bond yields rose. Did they ignore the underlying weakness? The feeling was, of course, that the Fed won’t cut rates at its upcoming June 17–18 FOMC. Add in the huge demands of the U.S. Treasury in 2025 to refinance plus deal with a $2 trillion plus budget deficit and the potential for more trade wars and bonds only knew one thing: sell, pushing yields (that move inversely to price) higher.
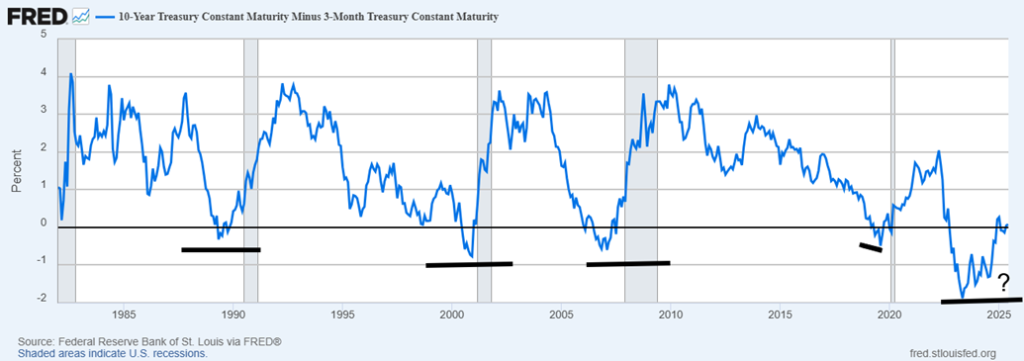
The U.S. 10-year Treasury note rose to 4.51% this past week, up from 5.44% the previous week. Canada didn’t stay out of it as the 10-year Governent of Canada bond (CGB) rose to 3.34% from 3.20%. The 2–10 spread saw the U.S. at 46 bp, down slightly from 49 bp, while the Canada 2–10 rose to 64 bp from 61 bp. Potentially more meaningful is the 3-month Treasury bill– 10-year Treasury note spread that currently sits at +8 bp. That is well up from the steepest at -188 bp in March 2023.
As our following chart shows, a long period of a negative 3-month–10-year spread results in a recession. But there is normally a lag of 15 months, according to some. Right now, 15 months could take us to February 2026, although we suspect we could see recessionary time in the second half of the year. The labour market is showing signs of rolling over. The Leading Economic Index (LEI) at 99.4 is now below the low of 2020 at 102.1. That’s not a good sign and points to lower levels. The LEI peaked in February 2022 at 117.6.
10-Year U.S. Treasury Note Minus 3-Month Treasury Bill 1982–2025
As a sign of further weakness, the ISM Manufacturing indices released this past week consistently showed recessionary conditions. Manufacturing jobs were lost in May as tariffs are beginning to bite. Even the trade deficit narrowed to its lowest level in April 2025 to $61.6 billion, the lowest level since 2023. No surprise that imports are down sharply. The weekly jobless claims came in higher than expected at 247,000, the highest seen since October 2024, showing more signs of a weakening economy.
This week we get the CPI and PPI. The CPI is expected to be up 2.5% y-o-y, which is up from 2.3% the previous month. The impact of rising oil prices hasn’t yet been seen. The core CPI (ex-food and energy) is expected to be up 2.9%, which again is higher than the previous 2.8%. Those kinds of numbers should keep the Fed on the sidelines with rate cuts.
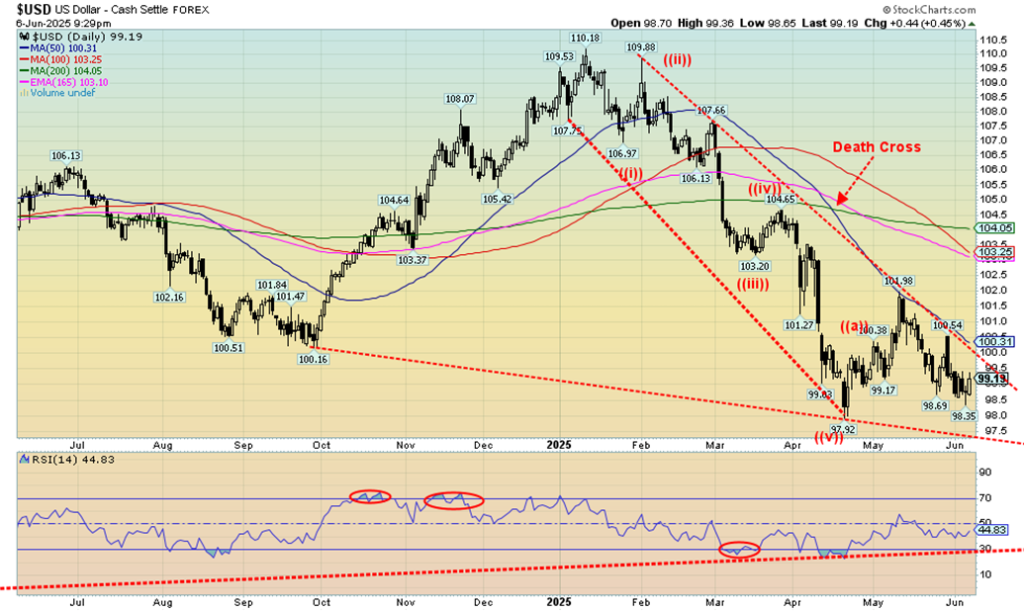
The US$ Index is continuing its downward trend, but Friday’s nonfarm payroll which was mildly better than expected helped push the index up about ½%. On the other side, gold fell as a result. On the week, the US$ Index fell 0.2%. The currencies were up for the most part as the euro gained 0.4%, the Swiss franc was up 0.1%, the pound sterling made 52-week highs, up 0.5%, but the Japanese yen fell 0.6%.
The Canadian dollar was up 0.2%, closing 73.00. Since we have not as yet made new lows for the US$ Index, the pullback from the 101.98 high might have been a B wave. To come would be a C wave up. A break over 100 would pull us higher towards the recent high near 102. Ultimate resistance is up to 103.25, a level that cannot be ruled out. New lows below 98 suggest we’ll break the 97.92 low. We can see support down to 97.25.
Gold prices were up this past week but then fell 1.3% on Friday, after the release of the mildly better than expected nonfarm payrolls. Maybe they didn’t focus on the downward revisions in the March and April report. Nonetheless, gold decided that it should put the Fed on hold with lowering interest rates, so some profit-taking resulted. Ultimately, gold was up only 0.5% this past week as it held its earlier gains. Other precious metals fared better, with silver up almost 9% to fresh 52-week highs and platinum gaining 11.8%, also to fresh 52-week highs.
The near precious metals also saw gains with palladium up 9.1% and copper up 2.8%. Copper went initially over $5 again, but then pulled back to close at $4.80. The gold stocks gained but pulled back on Friday with profit-taking. The Gold Bugs Index (HUI) was up 5.3% and the TSX Gold Index (TGD) gained 2.3%. Both of them made 52-week highs.
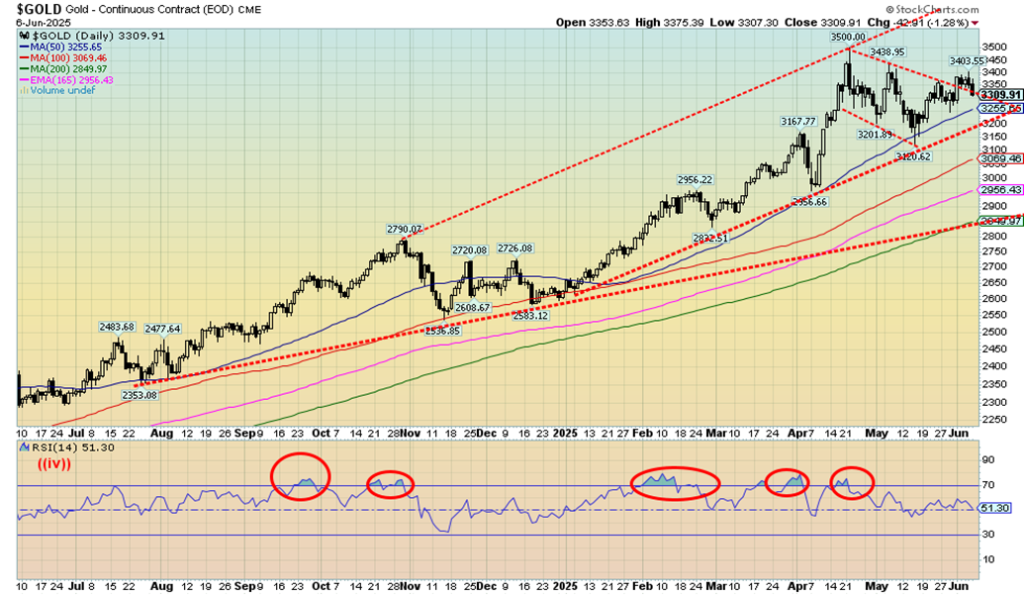
We thought we were breaking out over what appeared as a potential bull flag. However, Friday’s action has taken us back into the flag, so that might nullify the breakout at least temporarily. We may be forming a slightly different pattern. Corrections come in ABC patterns, but they also come in ABCDE patterns. The rise to $3,403 might have been a D wave with the E wave down to come. Support is at $3,200. The RSI has been slowly falling, supporting the unconvincing breakout. We’d like $3,200 to hold because under that level we could fall to $3,050 and even down to ultimate long-term support near $2,950.
This week, we fell just short of a move over $3,310, a level that would have suggested new highs ahead over $3,500. However, we do have that divergence in that silver did break out and made new highs but gold did not. We may have more to come in this pullback.
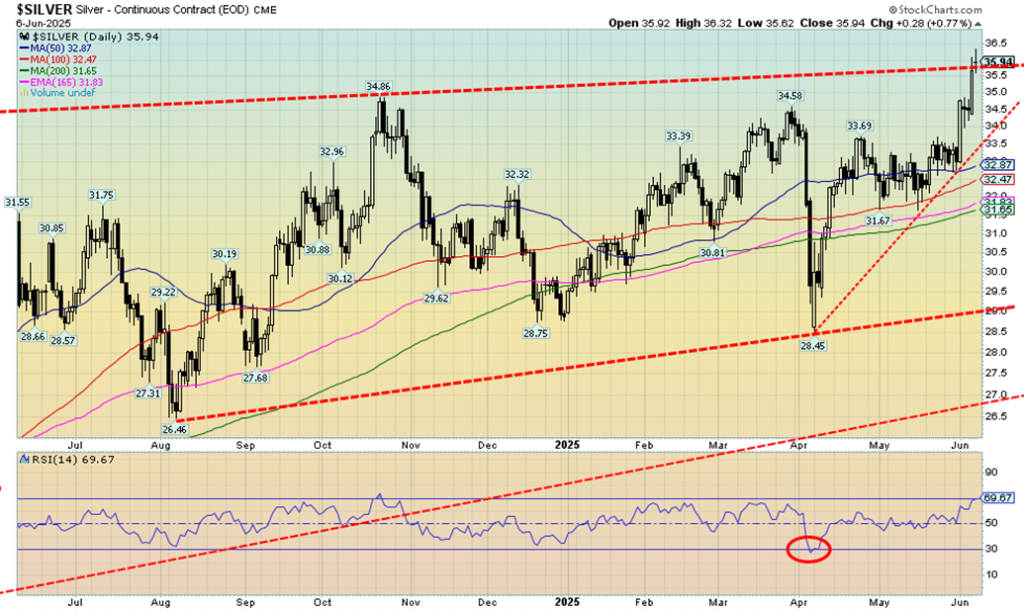
At long last, silver broke over $35 and tested over $36 but has not as yet closed over $36. It seems we have been waiting quite some time for this. To really confirm this breakout, we need to see two consecutive closes over $36. We noted that we thought silver was forming a bullish ascending triangle with a relatively flat top and a rising series of lows after the August 2024 low at $26.46. Targets could be up to around $44, but first we have to successfully clear and close over $36 and hold the level. The breakout this week for silver is somewhat momentous as we hit the highest level seen for silver since 2013. That’s a long wait.
What’s interesting also is that silver rose as gold fell. That silver is leading is a positive sign. With silver’s fresh gains ahead of gold, the gold/silver ratio that topped out recently at 107.66 has now fallen to 92. Irrespective of this, that’s still quite high. We need to break firmly under 92 and then under 90 to suggest we could test the most recent low of 72.90 seen way back in May 2024. The ratio breaking over 100 was unusual as it was seen only once before when it hit its all-time high of 126 during the pandemic of 2020.
After that the ratio collapsed to around 68 in early 2021 when there was a gold/silver rush out of the pandemic. To think about that level, we’d have to break under 75. Nonetheless, the action this past week was positive. Silver gained almost 9% to gold’s gain of 0.5%. Silver stocks responded with a good week as well. There may be some corrective action going forward this coming week, but ultimately, we should be headed higher.
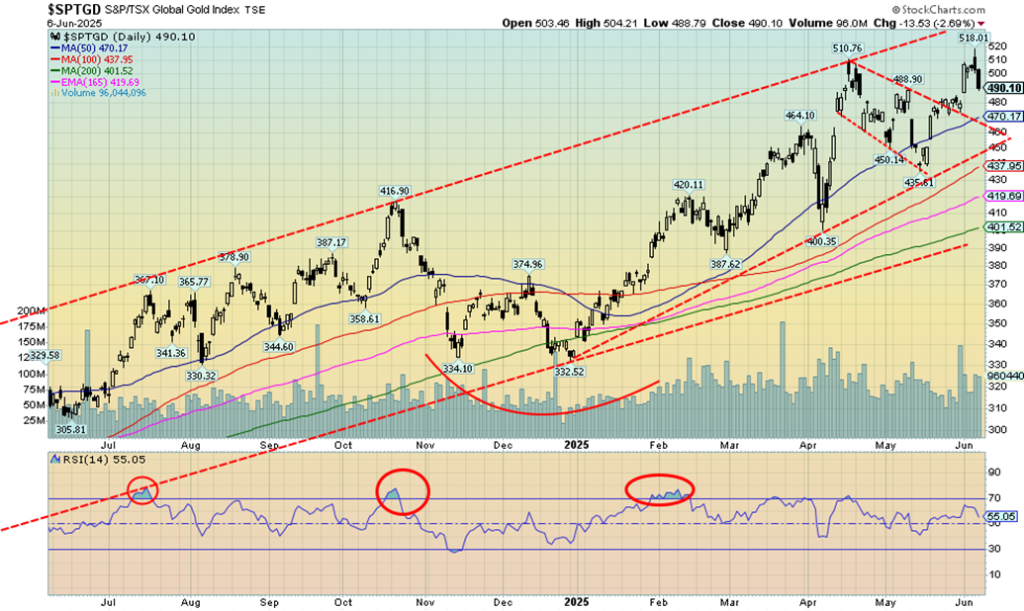
The TSX Gold Index (TGD) broke out of what appears as a bull flag, ran to fresh 52-week highs, then faced a barrage of profit-taking on Friday when gold fell even as silver rose. Still, the TGD held on to a 2.3% gain this past week. The Gold Bugs Index (HUI) fared better, up 5.3% also to fresh 52-week highs. If we have reason to be concerned, it’s that the RSI, along with some other indicators, is giving us negative divergences as we made the new highs. Negative divergences mean the indices (TGD, HUI) made new highs but the RSI and other indicators did not.
Here is where support zones come into play. The TGD has support to 470 and 450, but a break under 450 could send us tumbling towards major long-term support near 400. A move towards 470 would be merely a test of the breakout from the flag pattern and be bullish. The flag formation projects a move to around 545. We expect that gold stocks are going higher, but the pullbacks can be steep sometimes. That pullback in October/November 2024 saw the TGD fall 20% while the recent pullback saw the TGD fall 14.7%.
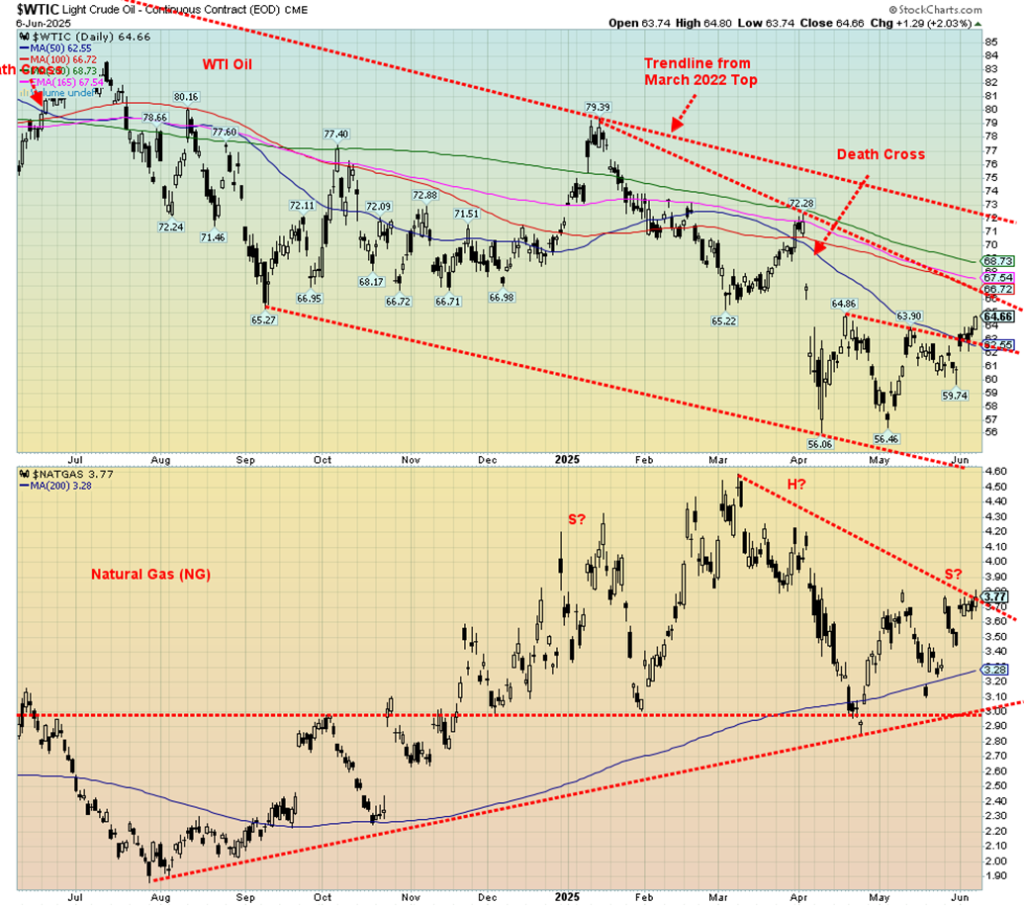
WTI and Brent oil rose this past week as supposedly U.S./China trade talks heated up, geopolitical tensions continued that could disrupt things, and the wildfires in Manitoba, Saskatchewan, and Alberta have apparently impacted the oil sands, where some 344,000 barrels per day production has been shut in. That represents some 7% of all Canada’s production. The result is WTI oil rose 6.2% this past week while Brent crude jumped 5.8%.
Warm weather and the awaiting of the hurricane season helped send natural gas (NG) prices higher. NG at the Henry Hub rose almost 9%. At the EU Dutch Hub, prices were up 7.9% as maintenance at Norway’s plants stopped production. That sparked shortages in the EU as Norway supplies almost one-third of the EU’s needs.
Also, they need to rebuild storage and threats of escalation of the Russia/Ukraine are not helping. All this helped the energy indices as the ARCA Oil & Gas Index (XOI) rose 2.4% while the TSX Energy Index (TEN) was up 3.4%.
We note that WTI oil appears to have broken out of that bottoming pattern that formed over the past two months. We still need to completely fill that gap that was left in April. But by then WTI oil would have to be over $68. The bottom pattern breakout seems to suggest a potential target of $71.25. If that’s correct, that would take us to the downtrend line from the 2022 top. If we break over $72, then we’ll be in new territory. But by then it might become apparent that something is amiss. We keep reading of threats to attack Iran.
We are not quite sure what to make of NG. On one hand, it appears to be forming a head and shoulders top. A breakdown under $3 could suggest a drop to $1.50. On the other hand, we could be breaking that downtrend line. However, we’d need to clear above $4.20/$4.30 to kill the potential head and shoulders pattern. As to the stocks, we still appear to be forming a bottom, but the XOI doesn’t break out until over 1,900 while the TEN needs to get above 275 to breakout. The key is oil prices, although if NG breaks down it could become a drag on the stocks.
Copyright David Chapman 2025
__
(Featured image by Ruth Enyedi via Unsplash)
DISCLAIMER: This article was written by a third party contributor and does not reflect the opinion of Born2Invest, its management, staff or its associates. Please review our disclaimer for more information.
This article may include forward-looking statements. These forward-looking statements generally are identified by the words “believe,” “project,” “estimate,” “become,” “plan,” “will,” and similar expressions, including with regards to potential earnings in the Empire Flippers affiliate program. These forward-looking statements involve known and unknown risks as well as uncertainties, including those discussed in the following cautionary statements and elsewhere in this article and on this site. Although the Company may believe that its expectations are based on reasonable assumptions, the actual results that the Company may achieve may differ materially from any forward-looking statements, which reflect the opinions of the management of the Company only as of the date hereof. Additionally, please make sure to read these important disclosures.
David Chapman is not a registered advisory service and is not an exempt market dealer (EMD) nor a licensed financial advisor. He does not and cannot give individualised market advice. David Chapman has worked in the financial industry for over 40 years including large financial corporations, banks, and investment dealers. The information in this newsletter is intended only for informational and educational purposes. It should not be construed as an offer, a solicitation of an offer or sale of any security. Every effort is made to provide accurate and complete information.
However, we cannot guarantee that there will be no errors. We make no claims, promises or guarantees about the accuracy, completeness, or adequacy of the contents of this commentary and expressly disclaim liability for errors and omissions in the contents of this commentary. David Chapman will always use his best efforts to ensure the accuracy and timeliness of all information. The reader assumes all risk when trading in securities and David Chapman advises consulting a licensed professional financial advisor or portfolio manager such as Enriched Investing Incorporated before proceeding with any trade or idea presented in this newsletter.
David Chapman may own shares in companies mentioned in this newsletter. Before making an investment, prospective investors should review each security’s offering documents which summarize the objectives, fees, expenses and associated risks. David Chapman shares his ideas and opinions for informational and educational purposes only and expects the reader to perform due diligence before considering a position in any security. That includes consulting with your own licensed professional financial advisor such as Enriched Investing Incorporated. Performance is not guaranteed, values change frequently, and past performance may not be repeated.


The TopRanked.io Weekly Digest: What’s Hot in Affiliate Marketing [LiveChat Affiliates Review]
Quick Disclosure: We’re about to tell you how LiveChat Affiliates run a top-notch affiliate program. And we really mean it....


German SMEs Face Tighter Bank Lending, Turn to Alternatives
Access to bank loans for German SMEs is tightening despite strong financing needs. About 37.8 percent face restrictive lending, driven...


Bitcoin Stalls as Geopolitical Risks and Crypto Industry Tensions Persist
Bitcoin is moving sideways near $72,000 amid ongoing Iran tensions, while ETF inflows remain strong. Quantum security debates continue. Ethereum...


Geopolitical Tensions and Trade Disruptions Reshape Global Commodities Markets
Geopolitical tensions and disrupted trade routes, especially around the Strait of Hormuz, are reshaping global commodities markets. Agriculture faces supply...


Germany Sees 413 Cannabis Cultivation Clubs Two Years After Partial Legalization
Two years after partial cannabis legalization in Germany, 413 cultivation clubs have been established nationwide. Lower Saxony leads in clubs...
 |
|
 |  |
 |
|
-

 Crypto1 week ago
Euro Stablecoins Struggle to Compete with Dollar Dominance in Crypto Markets
-

 Cannabis3 days ago
Germany’s Cannabis Reform Shows Limited Risks but Calls for Regulatory Adjustments
-

 Biotech2 weeks ago
Advances in LDL Cholesterol Management for Familial Hypercholesterolemia: From Statins to Innovative PCSK9 and CETP Inhibitors
-
 Business1 week ago
TopRanked.io Weekly Affiliate Digest: What’s Hot in Affiliate Marketing [Bovada Affiliate Program]