Markets
Gold Prices Edge Up Amid Positive Long-Term Outlook in a World of Debt
Gold creeped slightly higher this past week and the gold stocks also creeped higher. Both, however, are below recent highs but the signs remain positive irrespective of any short-term gyrations. That also includes the metals & mining sector. Shortages and supply disruptions are going to drive prices higher and for gold central banks continue to buy and gold remains a safe haven in a world of debt and divisive politics.

Debt, debt, debt. Too much of it. At last report, the world now has $315 trillion of debt. That’s for everyone— governments, corporations, consumers. That gives us a global debt to GDP of 288%. The U.S. total debt to GDP is 354%. Tony Keller of The Globe and Mail calls the U.S. debt growth unsustainable (www.theglobeandmail.com/business/commentary/article-the-us-has-an-enormous-budget-deficit-for-now-nobody-cares-eventually/#comments The Globe and Mail, June 25, 2024). He’s referring only to the federal government debt, not total debt. But a closer look suggests all debt is unsustainable. And the U.S. is not even the highest. According to CEIC Data (www.ceicdata.com/en/indicators), Japan’s total debt to GDP is an astounding 1,290%, last reported in late 2023. The total U.S. debt is over 30% of global debt.
David Rosenberg of Rosenberg Research, in a similar article on June 24, 2024, said the same thing, except he was referring to passive investing in the stock market (www.theglobeandmail.com/investing/markets/inside-the-market/article-david-roseneberg-this-massive-bull-market-in-passive-investing-will/). We’ve noted many times how overvalued the U.S. stock market is and the growing number of negative divergences that continue to suggest the end is near.
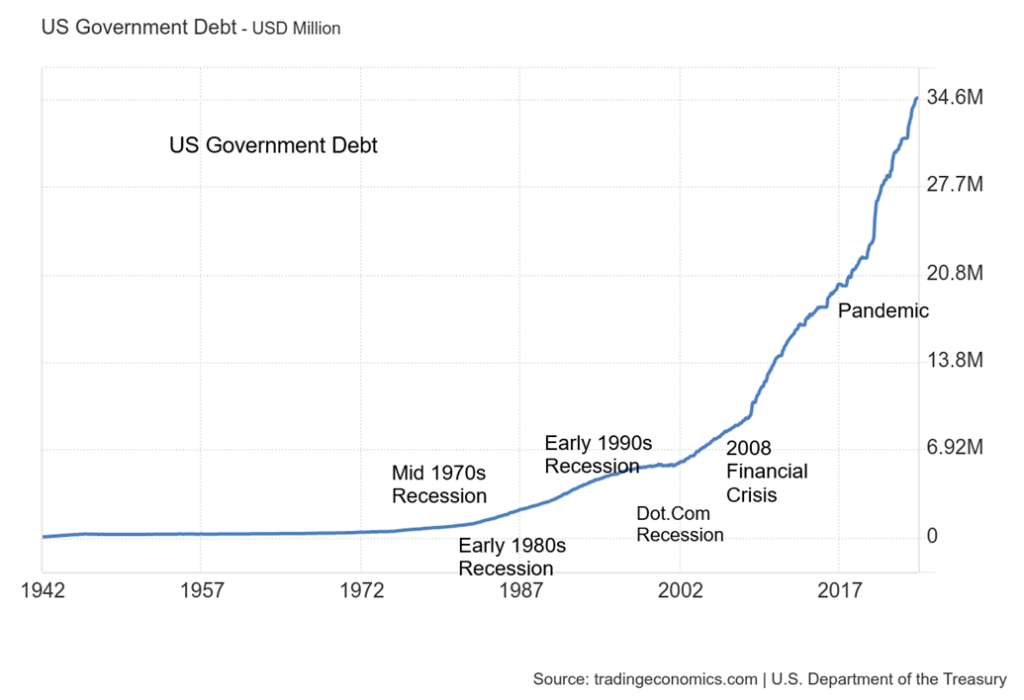
U.S. government debt has grown by over 500% since 2000. It has, of course, included three serious recessions: the dot.com recession in 2001–2002, the Great Recession in 2007–2009, and the pandemic recession in 2020. In terms of collapse of GDP and unemployment, the pandemic recession was the worst, despite being short- lived thanks to a massive injection of quantitative easing (QE) into markets and lowering of interest rates to zero (or negative rates, as was the case in the EU and Japan). But the question begs—what about next time? Many believe the central banks led by the Fed have run out of bullets.
U.S. Federal Government Debt 1942–2024
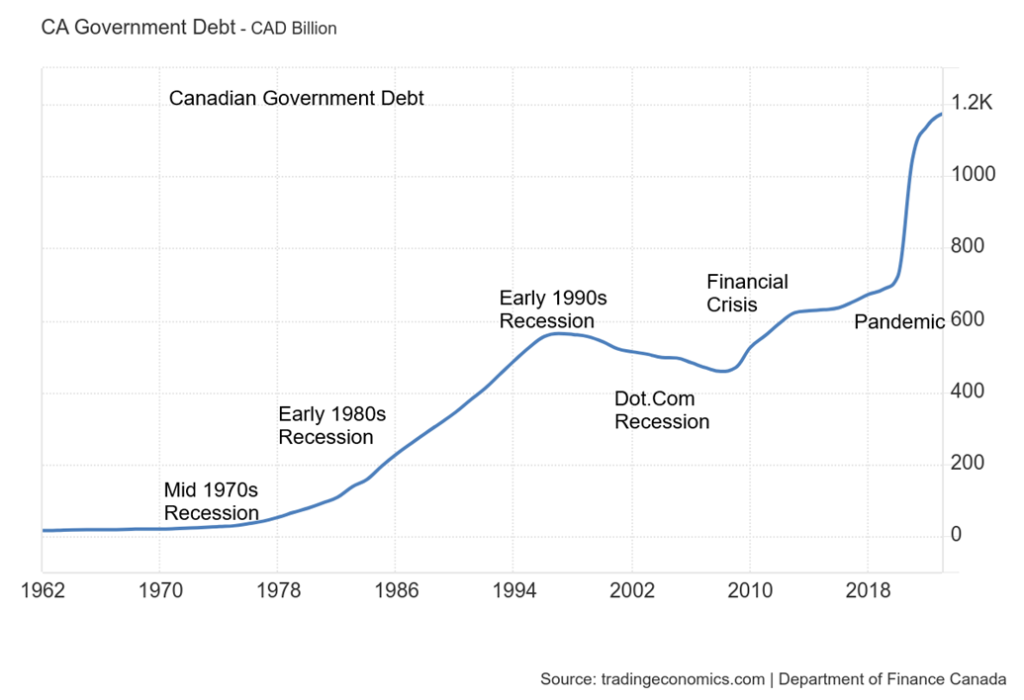
By comparison, Canada’s total federal government debt has just doubled since 2000, thanks to the Great Recession and the pandemic recession. However, Canada’s consumer debt has soared some 235% in the same period. Many observers are more concerned about Canada’s consumer debt than the federal government debt, which is still only about 70% of GDP when the U.S. is at 125%. By comparison, Canada’s household debt to GDP is last reported at 102.5%. Most reports on Canada’s government debt usually include the provinces. With the provinces, Canada’s total government debt doubles and the debt to GDP rises to 107%.
The Canadian position is better, thanks largely to the reduction in debt that occurred under former prime ministers Jean Chretien and Paul Martin. During that time (1993–2006), debt actually rose a small $32.5 billion or 7%, but its peak didn’t actually come until 1996, roughly three years after Chretien came to power. After that it fell steadily until 2008, when the Great Recession sparked it to rise once again.
Governments in Canada and the U.S. in particular will face a dilemma following elections for the U.S. in November 2024 and in Canada (anytime, but scheduled for October 2025). Unsustainable debt growth may meet its limits. Yet massive cuts to balance the budget could see GDP fall and unemployment rise sharply, creating potential social unrest. It would also put pressure on the large corporate and consumer debt that is outstanding. One of the big mistakes of the Great Depression was the tendency to cut rather than spend, at least initially.
Canadian Federal Government Debt 1962–2023
On the political side, much has been made about the spending habits of governments under different presidents and prime ministers. The most fascinating analysis we’ve seen was from Axios (www.axios.com) where they outlined that former president Donald Trump ran up borrowing almost twice as much as current president Joe Biden (www.crfb.org/papers/trump-and-biden-national-debt, www.axios.com/2024/06/24/trump-biden-debt-deficits-election).
As to actual debt increase, the tally was a bit closer, with Trump running up debt by $7.8 trillion vs. Biden $7.0 trillion. Percentage-wise, Trump’s rose 37% vs. Biden up 25%. Debt to GDP rose to 127.5% under Trump and has fallen slightly under Biden to 124.7%. The same occurred for budget deficits as a percentage of GDP that rose to 14.9% in 2020 under Trump and is still at 6.3% under Biden. Setting aside a few developing countries, the U.S. budget deficit is one of the highest for any country. Certainly, the highest in the G7 plus China.
Canada by contrast almost seems fiscally responsible. Government debt has doubled under current prime minister Justin Trudeau over his nine years, thanks largely to the needs of the pandemic recession. This compares to up 31% under former prime minister Stephen Harper over nine years as well. As a result, it is no surprise that Canada’s federal debt to GDP has jumped to nearly 70% currently vs. about 53% under Harper. That remains the lowest in the G7. When we include the provinces, it does rise considerably.
The budget deficit as a percentage of GDP is currently 0.6% vs. flat when Harper left office in 2015. By these numbers, Canada is fiscally responsible compared to the U.S. Nonetheless, both countries are facing a debt dilemma with the U.S. facing a bigger challenge than Canada. The U.S. also has unfunded liabilities related to Social Security and Medicare, totalling some $216 trillion. Canada by contrast has only about $2.2 trillion of unfunded liabilities related to health care, Old Age Security (OAS), and Canada Pension Plan (CPP).
The U.S. debt chart has the proverbial hockey stick look—a slow rise followed by an accelerating one, and finally it just goes straight up. Nvidia and some other high tech AI stocks that are a part of the Magnificent Seven have a similar look. Tesla rose over 1,700% from its pandemic low in March 2020 to its peak in November 2021. Tesla is now down some 57% from that high. Nvidia, the darling of the AI stocks, has fallen 12% in a hurry since peaking on June 12, 2024. But Tesla and Nvidia are stocks. Does debt act like stocks? Two ways to bring the debt down are to inflate it away or to default. Since the U.S. defaulting would be a financial catastrophe globally, that leaves the option of inflating away the debt.
Debt Growth by President and Prime Minister
| Period | Debt increase ($billions) | % Increase | Debt to GDP | Budget deficit % of GDP |
| U.S. | ||||
| Biden 1/20/21–6/24/24 | $6,996.7 | 25% | 124.7% | 6.3%* |
| Trump 1/20/17-1/20-21 | $7,802.0 | 37% | 127.5% | 14.9%** |
| Canada | ||||
| Trudeau 11/2015–3/2024 | $612.3 | 100% | 69.7% | 0.6%* |
| Harper 2/2006–11/2015 | $145.6 | 31% | 52.9% | 0%** |
- * Current as reported
- ** Last reported end of term
U.S. Quarterly GDP Growth Rate 2014–2024
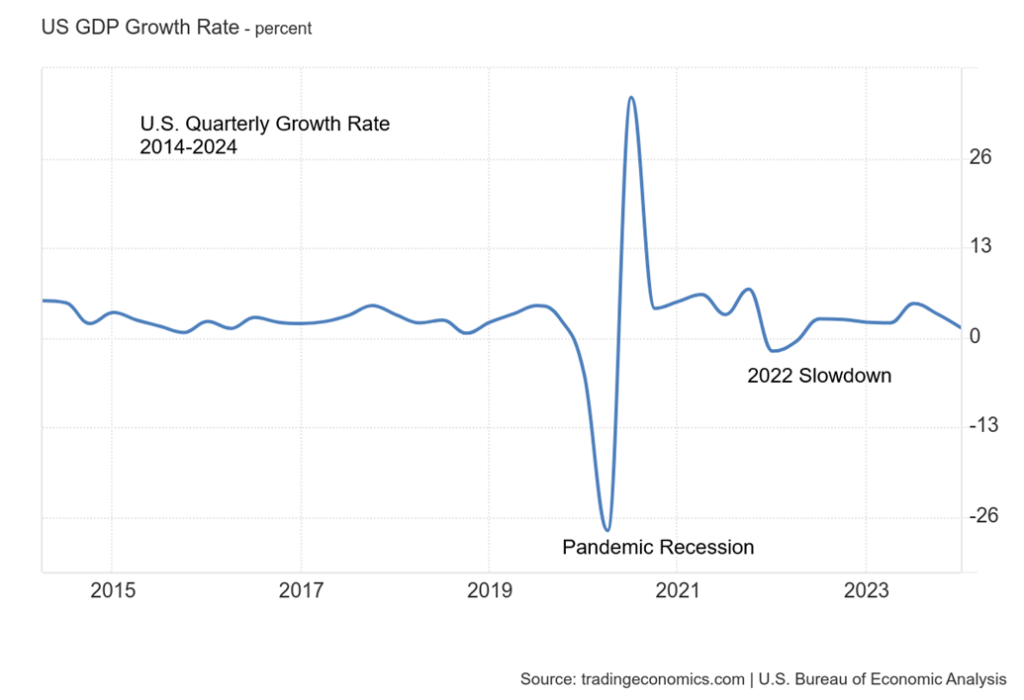
But inflating the debt away could become more difficult if the U.S. were to fall into a recession. The most recent and final quarterly GDP (Q1) came in at 1.4%. That was a downward revision to the previously reported 3.4% growth. Stagflation, as we saw in the 1970s, would help lessen the debt, but that means a weakening economy accompanied by higher inflation—the worst of both worlds. If the budget deficits remain the same, and there is little sign that is about to change, they could become worse under a Trump presidency given his current stated policies that includes further tax cuts.
The question then will be: who will buy all the U.S. debt? China is shedding U.S. debt at a rapid pace because of the ongoing geopolitical conflict between the two, Japan, the current largest holder of U.S. debt, has its own problems, including a sinking yen. The EU is falling into recession. All that could lead to the Fed being the buyer of last resort. The debt/GDP ratio could rise further. A credit downgrade is also possible. The U.S. is currently AA+. Canada remains one of the few remaining AAA credits. All together there are 11 countries with an AAA credit rating.
For the record the holders of U.S. debt are as follows: Social Security $7.1trillion, Foreign holders (includes foreign governments, central banks, and private holders) $8.0 trillion, and U.S. private holders (includes mutual funds, banks, state and local governments, pension funds, insurance companies, individuals, corporations and the Federal Reserve) holds the remainder of $18.9 trillion. The U.S. debt held by Social Security never trades but the remainder can be and is traded regularly on the open market. The U.S. debt market is the largest and most liquid in the world.
There is too much debt. It is not sustainable. But would the U.S. default? That’s highly unlikely. However, corporations and consumers are not immune to bankruptcy and here the numbers are rising. That does not bode well.
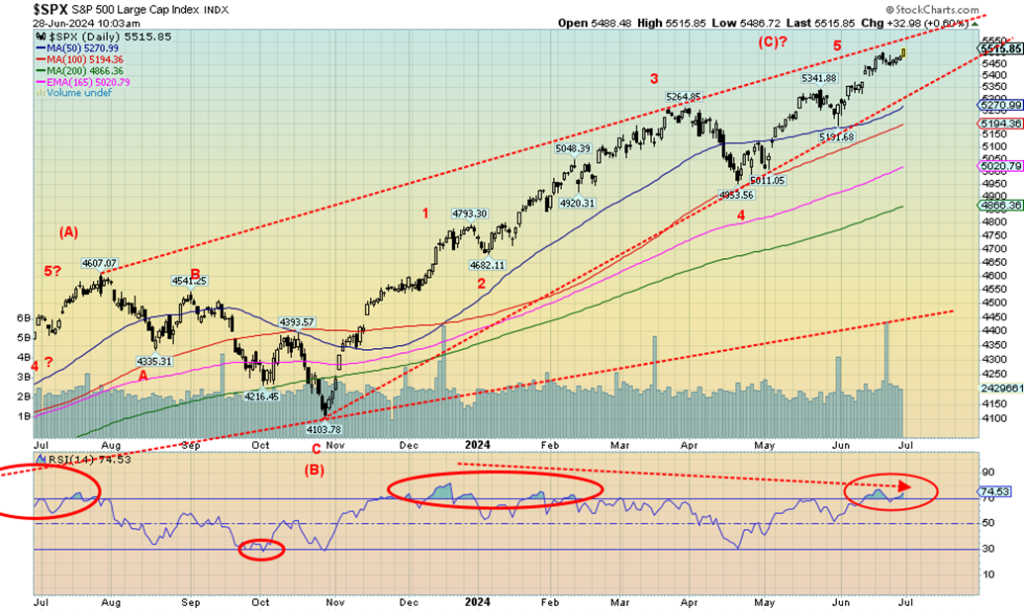
Does what is perceived as a key reversal work? Back on June 20, 2024, both the S&P 500 (SPX) and NASDAQ made what appeared to be a key reversal. That means the markets made all-time highs, then reversed and closed below the low of the previous day. Normally we take that as a negative sign. However, we need to confirm the reversal day.
The only way we could do that is for the S&P 500 to close under 5,400. Obviously, that never happened and now we are back making new all-time highs. But wait, hold on. Once again, the SPX put in an outside day reversal on Friday June 28, 2024 following a new all-time high. A new all-time high followed by a reversal to the downside and a lower close. No—reversals, even key reversals, don’t always work. However, we rarely see two in such a short period of time.
Nonetheless, until we break under 5,400, the top of that channel currently comes in around 5,565. So, it’s still in play unless we break down first. We are building what appears to be large ascending wedge triangle. These patterns are normally bearish; however, we can go deep into the wedge. We found it interesting that the initial key reversal day was made on the summer solstice under a full moon. That’s considerable energy at work.
However, we acknowledged at the time that we can continue into the first week or so of July, usually centered around July 6. That happens to be next week. On July 5 the June job numbers are released. The counter to July 6 is January 6 following the winter solstice. The top for the market in 2022 came on January 4. What followed was a 20%+ decline. We’ve seen other important tops around January 6 and as well July 6.
July is normally the best month of Q3. It is also the start of the second half of the year. Overall, July is the fourth best month of the year. During an election year, however, it drops to sixth, according to the Stock Trader’s Almanac (www.stocktradersalmanac.com). Given the deep divisions surrounding this year’s election, thoughts might be that markets could wobble. Stock markets, however, are driven more by earnings than political divisiveness. However, this year might be different. Curiously, the date of the attack on the Capital in Washington was January 6, 2021. Markets yawned and went on to new all-time highs as the year progressed.
Could the same thing happen this year? Sell in May and go away doesn’t appear to be working either—at least not yet. Markets have been rising steadily since a low in late April 2024. However, we do know that we are facing countless divergences. The NASDAQ and the SPX, along with a few other indices that are heavily weighted by the Magnificent Seven, may be making all-time highs but the Dow Jones Industrials (DJI) and the Dow Jones Transportations (DJT) are not even close. The DJT has not been keeping pace with the DJI, bringing us another divergence according to Dow Theory. The averages are not confirming each other.
Numerous indicators are also flashing warning signs. The SPX is currently overbought, as measured by the RSI indicator, as it has consistently (with some exceptions) been above 70 of late. Another warning sign. The MACD indicator appears poised to cross over. Numerous analysts besides ourselves have been warning about the overvalued stock market. Still, it keeps going higher. It’s only prudent to batten down the hatches a bit when we were getting storm warnings. Baron Rothschild supposedly once said, “I made my fortune by selling too early.”
We continue to look at support/resistance. When one is making new all-time highs, resistance levels are not visible. Except the top of the wedge channel is currently near 5,565. Support is at 5,400. We’d get a more significant sell signal if we broke under 5,200. However, the wedge breaks down under 5,300. Other signals come when we break a significant weekly, monthly and yearly low. Those levels currently lie at 4,950, 4,100 and 3,800 (the low of 2023) respectively.
Interest rates rose this week as well. The U.S. 10-year treasury note jumped to 4.39% from 4.26%, a 3.1% rise. Then, in a possible warning sign, the 2–10 spread narrowed to the lowest level in weeks. The U.S. 2–10 spread fell to negative 35 bp from negative 46 bp. Following a long period of a steep inverted yield curve, a yield curve returning to normal is usually a signal that a recession could be getting closer. The trend for the stock market is up, but the divergences are warning us that something is amiss.
On the week, the SPX fell 0.1% after making all-time highs, while the S&P 500 Equal Weight Index fell 0.4% and continues to diverge sharply with the SPX. The SPXEW is not weighed down by the Magnificent Seven. The DJI fell 0.1% but the DJT surprised and rose 2.0%. Nonetheless, the DJT remains well off its all-time highs.
The NASDAQ rose 0.2% to new all-time highs. Once again, the Magnificent Seven led the way as the New York FANG Index made all-time highs, up 1.4%. Three of the seven made all-time highs: Amazon, Google, and Microsoft. Also, in a divergence, the S&P 400 (Mid) was off 0.1% but the S&P 600 (Small) rose 1.1%. Bitcoin is threatening to break under $60,000 as it fell 6.6% this past week.
In Canada, the TSX Composite rose 1.5% but the TSX Venture Exchange (CDNX) continues to struggle, off 0.2%. On the TSX, two of the 14 sub-indices fell, with Telecommunications (TTS) down 1.4%. Leading the way up was Energy (TEN), followed by Real Estate (TRE) and Information Technology (TKK), both up 2.0%.
In the EU, the London FTSE fell 0.9%, the EuroNext 100 was down 0.9%, and the Paris CAC 40 fell 1.3%, but the German DAX eked out a 0.3% gain. The EU has concerns about the rise of far-right parties that could gain control. In Asia, China’s Shanghai Index (SSEC) fell 1.7%, the Tokyo Nikkei Dow (TKN) rose 1.9% despite the sinking yen, and Hong Kong’s Hang Seng (HSI) fell 1.6%.
A rather mixed week for markets, but the negative signs are there for the U.S. markets. The indicators, the divergences, and a growing negative background both economically and politically could see this market begin a fall.
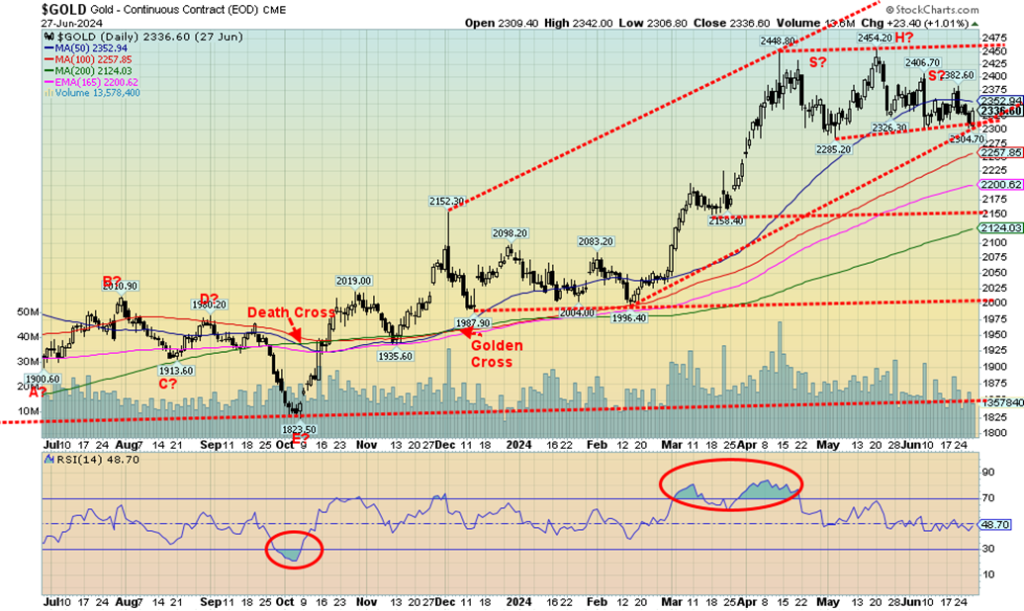
Gold continues to bounce around as it has done for the past three weeks. Ever since that sharp break on June 7, 2024, gold seems to put in nothing more than a series of up days followed by down days. The good news was that the sharp down move on June 7 never generated any serious follow-through. Support at $2,300 continues to hold. Yes, we dipped under that level, and silver dipped under $29, but neither followed through, suggesting that we may be sold out. Given that a close over $2,400 remains elusive, we can’t at this time eliminate the downside risk. We also have what appears to be a compelling head and shoulders top, but once again support at $2,300 has held. Nonetheless, the quiet sideways action has left the daily trends for both gold, silver, and platinum in neutral territory.
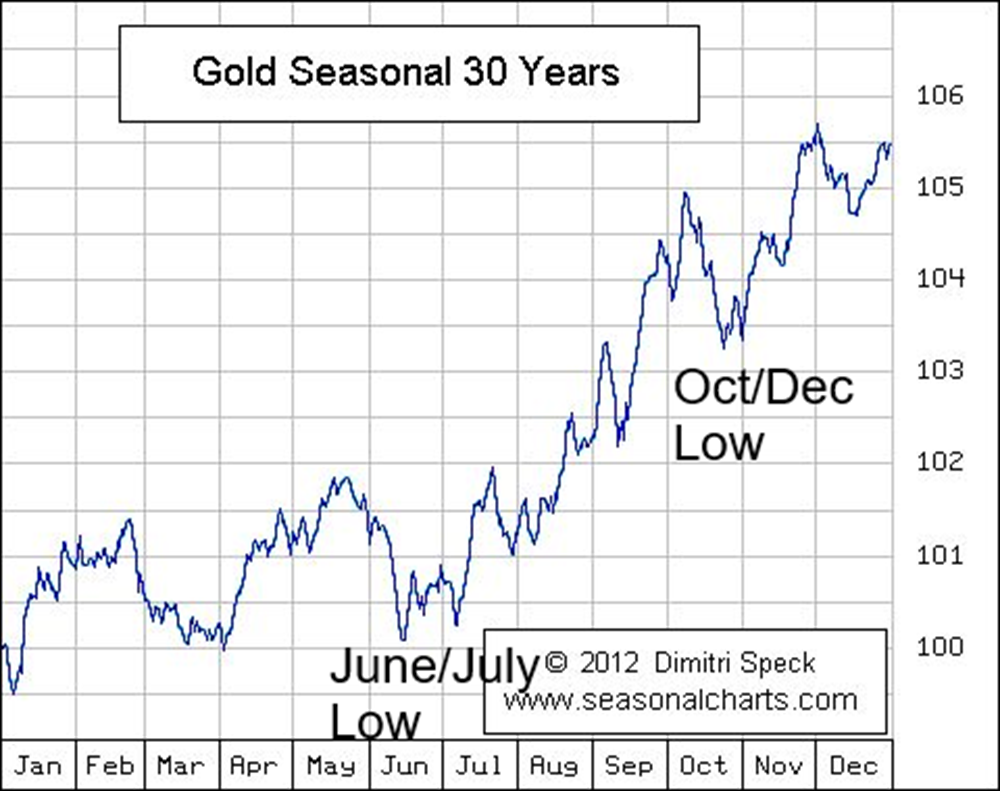
Seasonally, gold enters a positive period that lasts until usually October before a correction may set in. The lows then occur in December before another seasonal run-up gets underway. The chart below shows the potential June/July low as well as the October/December low. They denote only that a low could occur but do not measure the magnitude. It could well be that the October/December is lower than the June/July low. Peaks seem to occur into March, May, and September. This does not mean that 2024 will follow the pattern but indicates what might occur. We are moving into July and gold has been weak since topping in May 2024 at $2,454.
On the week, Gold rose a small 0.4%, silver was off 0.2%, and platinum rose 1.8%. Palladium bounced back up 5.8%, but copper continued its recent weakness, down 1.1%. The gold stocks eked out gains with the Gold Bugs Index (HUI) up 0.2% and the TSX Gold Index (TGD) up 0.4%. Currencies had a quiet week as well with the only real noise being the sinking Japanese yen that fell to new 52-week lows, down 0.8%. The US$ Index rose about 0.1%, the euro was up 0.2%, the Swiss franc down 0.8%, and the pound sterling was flat. The Cdn$ gained about 0.1%.
As noted, support for gold is at $2,300, but a break below that level could target down to $2,150. The trend is up and we see few signs that we could be making a more significant top, given strong demand particularly from central banks and Asia and an economic and political background that is supportive. Silver is in a similar position. Silver has support down to $29, but if that breaks the next support comes in at $28.50.
Below that, we don’t find support until $26.50. Resistance is at $32. We need to close above $32 to suggest we could move to our targets up around $39/$40. Silver has badly lagged gold. While gold has made all-time highs, silver remains well under its major highs seen in 1980 and 2011 near $50. More recently the gold/silver ratio has been falling in favour of silver. The last peak was seen in February 2024 at 92.41. Last the gold/silver ratio was at 79.15 although it hit a low of 72.62 in May.
The gold stocks, represented by the HUI and the TGD, remain down, well below their all-time highs of 639 and 455 respectively. As well both are down from their most recent high in May 2024. The TSX Venture Exchange (CDNX) that holds roughly 50% junior mining companies is well down from its all-time highs seen back in 2007 at 3,372. Today, it is at 567, down even from its most recent high at 1,113 back in 2021. Junior mining stocks are under-owned, undervalued, and under-noticed. That won’t last forever. They’re up 71% from their major low in March 2020 but still down 83% from their all-time high. A depressive market when the focus has been instead on the AI stocks and meme stocks.
Oil is struggling to break above $82. We need to get over $84 to suggest we are seriously breaking out. Nervousness concerning the geopolitical situation is supporting oil prices at this time. WTI oil was up 1.0% this past week, Brent crude rose 0.6%, natural gas (NG) fell a sharp 8.5%, but NG at the EU Dutch Hub was up 1.6%. The energy stocks rebounded, with the ARCA Oil & Gas Index (XOI) up 2.6% and the TSX Energy Index (TEN) gaining 3.6%. Are the energy stocks leading once again?
Central banks around the world have been increasing their gold holdings. The buying is led by the People’s Bank of China (PBOC) along with central banks from emerging economies. China may be the world’s largest producer of gold but they have also become a large net importer of gold. Central banks of the world have been concerned about the politicization of world institutions such as the IMF, the World Bank and SWIFT the global payments system along with the freezing and seizing of government assets particularly by the U.S. and its application of sanctions. Central banks cite golds stability, its ability to hold its value, its liquidity and that it has no liability. (www.livemint.com/market/stock-market-news/explained-why-are-central-banks-like-rbi-pboc-accumulating-gold-in-large-quantities-gold-prices-today-gold-rates-11714963880948.html) Gold is a go-to asset in periods of economic and political instability.
Markets & Trends
| % Gains (Losses) Trends | ||||||||
| Close Dec 31/23 | Close Jun 21, 2024 | Week | YTD | Daily (Short Term) | Weekly (Intermediate) | Monthly (Long Term) | ||
| Stock Market Indices | ||||||||
| S&P 500 | 4,769.83 | 5,460.69 (new highs)* | (0.1)% | 14.5% | up | up | up | |
| Dow Jones Industrials | 37,689.54 | 39,123.59 | (0.1)% | 3.8% | up (weak) | up | up | |
| Dow Jones Transport | 15,898.85 | 15,415.23 | 2.0% | (3.0)% | up | neutral | neutral | |
| NASDAQ | 15,011.35 | 17,432.60 (new highs)* | 0.2% | 18.1% | up | up | up | |
| S&P/TSX Composite | 20,958.54 | 21,875.79 | 1.5% | 4.4% | down | up | up | |
| S&P/TSX Venture (CDNX) | 552.90 | 569.82 | (0.2)% | 3.1% | down | up (weak) | down | |
| S&P 600 (small) | 1,318.26 | 1,296.98 | 1.1% | (1.6)% | down | up (weak) | up | |
| MSCI World | 2,260.96 | 2,328.38 | (0.4)% | 3.0% | down | up | up | |
| Bitcoin | 41,987.29 | 60,100.95 | (6.6)% | 43.1% | down | up (weak) | up | |
| Gold Mining Stock Indices | ||||||||
| Gold Bugs Index (HUI) | 243.31 | 267.86 | 0.2% | 10.1% | neutral | up | up | |
| TSX Gold Index (TGD) | 284.56 | 316.86 | 0.4% | 11.4% | neutral | up | up | |
| % | ||||||||
| U.S. 10-Year Treasury Bond yield | 3.87% | 4.39% | 3.1% | 13.4% | ||||
| Cdn. 10-Year Bond CGB yield | 3.11% | 3.54% | 5.0% | 13.8% | ||||
| Recession Watch Spreads | ||||||||
| U.S. 2-year 10-year Treasury spread | (0.38)% | (0.35)% | 23.9% | 7.9% | ||||
| Cdn 2-year 10-year CGB spread | (0.78)% | (0.50)% | 13.8% | 35.9% | ||||
| Currencies | ||||||||
| US$ Index | 101.03 | 105.85 | 0.1% | 4.8% | up | up | up | |
| Canadian $ | 75.60 | 73.20 | 0.1% | (3.2)% | neutral | down | down | |
| Euro | 110.36 | 107.10 | 0.2% | (3.0)% | down | down | down (weak) | |
| Swiss Franc | 118.84 | 111.33 | (0.8)% | (6.3)% | neutral | neutral | neutral | |
| British Pound | 127.31 | 126.45 | flat | (0.7)% | down (weak) | up | neutral | |
| Japanese Yen | 70.91 | 62.15 (new lows) | (0.8)% | (12.4)% | down | down | down | |
| Precious Metals | ||||||||
| Gold | 2,071.80 | 2,339.60 | 0.4% | 12.9% | neutral | up | up | |
| Silver | 24.09 | 29.56 | (0.2)% | 22.7% | neutral | up | up | |
| Platinum | 1,023.20 | 1,014.10 | 1.8% | (0.9)% | neutral | up | up (weak) | |
| Base Metals | ||||||||
| Palladium | 1,140.20 | 977.90 | 5.8% | (14.2)% | neutral | down | down | |
| Copper | 3.89 | 4.39 | (1.1)% | 12.8% | down | up | up | |
| Energy | ||||||||
| WTI Oil | 71.70 | 81.54 | 1.0% | 13.6% | up | neutral | neutral | |
| Nat Gas | 2.56 | 2.60 | (8.5)% | 1.6% | neutral | up | down (weak) | |
Source: www.stockcharts.com
Note: For an explanation of the trends, see the glossary at the end of this article.
New highs/lows refer to new 52-week highs/lows and, in some cases, all-time highs.
- * New All-Time Highs
__
(Featured image by Ruth Enyedi via Unsplash)
DISCLAIMER: This article was written by a third party contributor and does not reflect the opinion of Born2Invest, its management, staff or its associates. Please review our disclaimer for more information.
This article may include forward-looking statements. These forward-looking statements generally are identified by the words “believe,” “project,” “estimate,” “become,” “plan,” “will,” and similar expressions. These forward-looking statements involve known and unknown risks as well as uncertainties, including those discussed in the following cautionary statements and elsewhere in this article and on this site. Although the Company may believe that its expectations are based on reasonable assumptions, the actual results that the Company may achieve may differ materially from any forward-looking statements, which reflect the opinions of the management of the Company only as of the date hereof. Additionally, please make sure to read these important disclosures.
Copyright David Chapman 2024
David Chapman is not a registered advisory service and is not an exempt market dealer (EMD) nor a licensed financial advisor. He does not and cannot give individualised market advice. David Chapman has worked in the financial industry for over 40 years including large financial corporations, banks, and investment dealers. The information in this newsletter is intended only for informational and educational purposes. It should not be construed as an offer, a solicitation of an offer or sale of any security. Every effort is made to provide accurate and complete information. However, we cannot guarantee that there will be no errors. We make no claims, promises or guarantees about the accuracy, completeness, or adequacy of the contents of this commentary and expressly disclaim liability for errors and omissions in the contents of this commentary.
David Chapman will always use his best efforts to ensure the accuracy and timeliness of all information. The reader assumes all risk when trading in securities and David Chapman advises consulting a licensed professional financial advisor or portfolio manager such as Enriched Investing Incorporated before proceeding with any trade or idea presented in this newsletter. David Chapman may own shares in companies mentioned in this newsletter. Before making an investment, prospective investors should review each security’s offering documents which summarize the objectives, fees, expenses and associated risks. David Chapman shares his ideas and opinions for informational and educational purposes only and expects the reader to perform due diligence before considering a position in any security. That includes consulting with your own licensed professional financial advisor such as Enriched Investing Incorporated. Performance is not guaranteed, values change frequently, and past performance may not be repeated.


The TopRanked.io Weekly Digest: What’s Hot in Affiliate Marketing [++ KuCoin Affiliate Program Review]
X now allows people to block certain topics from their feed. This week, we're going to tell you how to...


Hotel Stay Project Supports Wildlife Conservation in Japan
Iwate Prefecture launched a project linking hotel stays to conservation through Morioka Zoological Park Zoomo. A themed room at Yunomori...


Bitcoin Leads Modest Crypto Rebound Amid Mixed Signals
Bitcoin rose 2 percent to above 77000 as ETFs saw 15 million inflows and April gains of 12.2 percent. Ethereum...


Major Pharma Advances: EU Approvals, Vaccine Progress, and Breakthrough Clinical Results
Johnson & Johnson has EU approval for nipocalimab for generalized myasthenia gravis, showing superior control and sustained benefits. Sanofi reported...


Agential Cannabis 2026 to Drive APAC Market Growth and Global Industry Collaboration
Agential Cannabis 2026 will take place September 23–24 in Bangkok, bringing global experts together to advance the APAC medical cannabis...
 |
|
 |  |
 |
|
-

 Biotech1 week ago
BB Biotech Accelerates Portfolio Overhaul and Outperforms NAV in Strong Q1 2026
-

 Impact Investing2 days ago
Flexibility Becomes Key as Renewable Energy Faces Pricing and Profit Challenges
-

 Business1 week ago
The Federal Reserve and War in Iran: Why It Matters to Your Money
-

 Fintech1 week ago
Lutech Acquires Talentomobile to Boost European Fintech Expansion