Markets
Why Markets Were Generally Off This Past Week
The stock markets are displaying numerous negative divergences. We have no official sell signals but define breakdown points that would confirm a breakdown. Bond yields backed up a bit and continue to consolidate at a higher level. Gold and the precious metals were mixed as they too continued to consolidate the recent run-up. With plenty of oil to go around, oil prices and even natural gas prices were weak this past week.

We were quite intrigued by an opinion article in The Toronto Star from Frank Giustra. Mr. Giustra is a Canadian businessman, global philanthropist, CEO of the Fiore Group, and co-chair of the International Crisis Group, as well as founder of Lionsgate Entertainment, Giustra Foundation, and Accesso. The article, titled “Fiscal Armageddon looms and no one in power wants to talk about it. Here’s why you should be afraid” (The Toronto Star, May 28, 2024) can be found here: www.thestar.com/business/opinion/fiscal-armageddon-looms-and-no-one-in-power-wants-to-talk-about-it-heres-why/article_95091250-1788-11ef-940b-db986165453b.html.
Mr. Giustra touched on many points that we have frequently noted. Given that the U.S. is the largest and most important economy in the world, what happens there has global implications. But, as Mr. Giustra points out, it’s not just the U.S. at risk—it’s the entire Western economic system. The world is beset with high debt levels, geopolitical divisions, domestic political divisions, severe storms, wildfires, floods, killer heat waves, and more due to climate change and other factors. But, as Giustra points out, the U.S. may be the worst or as he says “the scariest.”
The U.S. has the world’s biggest government debt at $34.8 trillion, the world’s biggest debt for everyone (government, corporates, and consumer) at $100.4 trillion, and the world’s biggest budget deficit at $1.8–$2.0 trillion. These levels, according to Giustra, are unsustainable. And, lest we forget, there is also an estimated $215.9 trillion in unfunded liabilities, consisting primarily of Social Security and Medicare.
Since coming off the gold standard in August 1971 and the end of Bretton Woods, the world has experienced a series of financial crises, with each one often worse than the previous one. We’ve seen the OPEC oil crisis (1973–1975), the Iranian crisis that helped spark the early 1980s recession (1980–1982), the S&L crisis (1986–1995), the
Asian contagion crisis (1997), the Russian currency crisis (1998), the dot.com crash (2000–2002), the global financial crisis (2007–2009), the EU debt crisis (2009-2019), and the COVID pandemic (2020–2021). There were, of course, many others, usually impacting developing countries—for example, the Latin America debt crisis of the 1980s and the Mexican peso crisis of 1994. There were a number of others.
Each crisis, for the most part, was worse than the previous one, and for many of the crises it required money and debt to explode upwards while interest rates were lowered sometimes to zero or even lower. Were the bank failures seen in 2023, including one we’ve overlooked in Credit Suisse, merely the canary in the coal mine before the next major financial crisis? Has the Fed run out of bullets? The Fed is caught between a rock and a hard place as their ability to handle another major financial crisis is severely constrained.
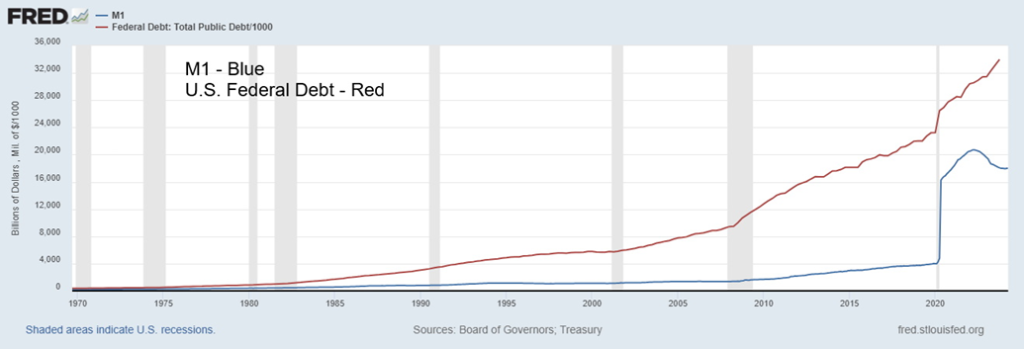
U.S. Money Supply M1, U.S. Federal Debt 1970–2024
The Fed always assures us that everything is fine. But would they really want to spark a panic? Inflation is just transitory—but no, we’re still battling it. We have no stagflation—until we do. Or is as economist John Maudlin says – inflation is both better than it was and higher than it should be. The housing market was fine before the 2008 financial crisis—until it wasn’t. The pandemic was controllable. Until it wasn’t and the cases and deaths mounted.
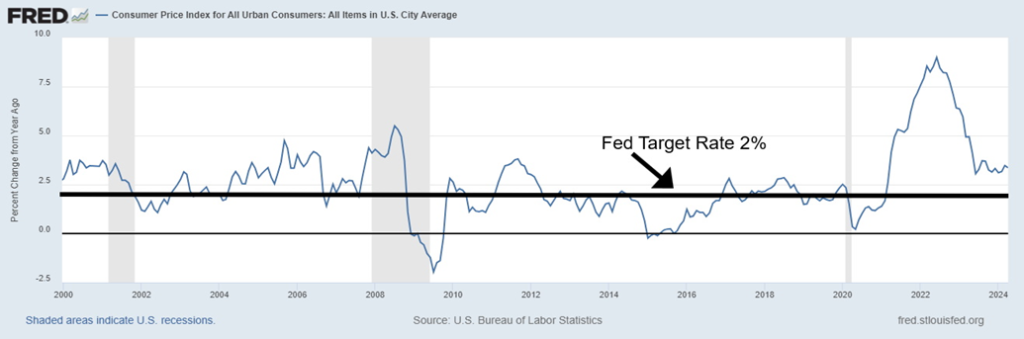
The Fed has a target rate of 2% for inflation. Except today it still sits at 3.4%. John Williams of Shadow Stats (www.shadowstats.com) says it’s higher, at 11.2%. However, Williams calculates it the same way it was calculated in 1980; that was before they started depressing the report, moving it away from measuring the cost of living to measuring the cost of maintaining a consistent standard of living.
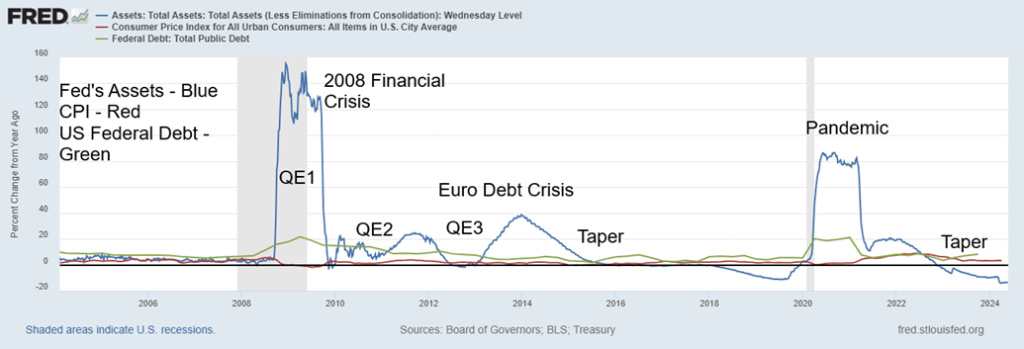
The Federal Reserve’s balance sheet used to be something benign. It grew slowly. That is, until the 2008 financial crisis when it exploded. We were introduced to the terms quantitative easing (QE) and tapering or quantitative tightening (QT). We had QE1, QE2, and QE3, and then something called operation twist. We had the repo crises, then QE4 during the pandemic. We saw tapering and QT, even as the EU debt crisis spread.
And we’ve seen tapering and QT as things eased after the pandemic. The Fed’s balance sheet has shrunk from roughly $9 trillion to around $7.3 trillion today. But in 2008, before the 2008 financial crisis broke out, it was only around $910.0 billion. Federal debt that was around $5.7 trillion in 2000 today sits at over $34.8 trillion and is projected to reach $47 trillion by 2028. Federal debt to GDP that was 54% in 2000 is now 122% and could hit 150% by 2028.
That level of debt to GDP is what one expects in some developing countries, not the world’s biggest and leading economy. Oddly enough, Japan, a G7 member, is the worst at almost 300%.
CPI with Fed Target Rate 2000–2024
Federal Reserve Balance Sheet with CPI, U.S. Federal Debt
% Changes Year-Over-Year 2004–2024
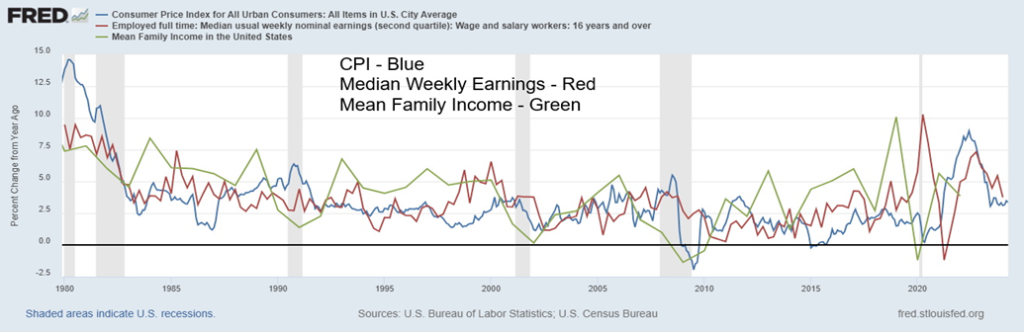
Have wages kept up with inflation? For the most part yes. Since 1980 there has been periods where wages outstripped inflation and periods when it lagged. But overall income and earnings have outstripped inflation. Since 1980 to 2021 inflation (CPI) rose 250%, but median weekly earnings were up 300% and mean family income rose 428%. We can’t measure minimum wage as that varies from state to state. Even in Canada it can vary from province to province. But from what we’ve seen wages and family income have generally kept up with inflation.
CPI, Median Weekly Earnings, Mean Family Income – annualized change % 1980-2023
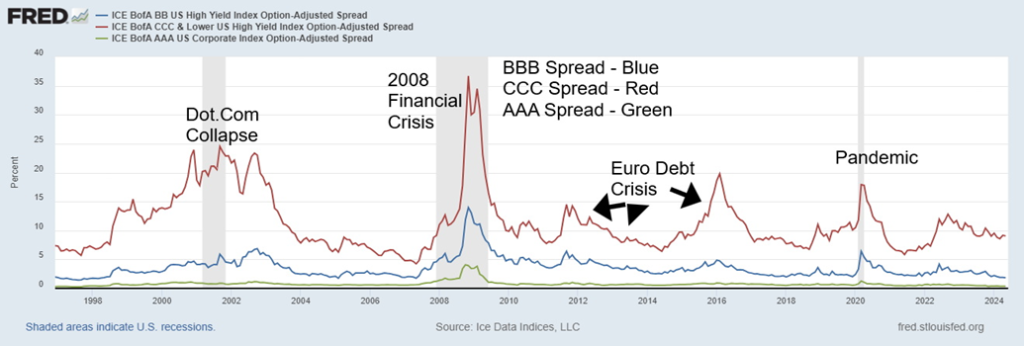
Surprisingly, credit spreads haven’t deteriorated that much. That’s despite the ongoing commercial real estate crisis that could cause a bigger breakdown. Currently, upwards of 282 banks out of roughly 4,000 face threats, primarily due to commercial real estate loans and the risks of higher interest rates. Most have $10 billion or less in assets. There is little mention of any money center banks in trouble. Most, as noted, are not even of the scale of last year’s failure of Republic First, Citizens Bank, Heartland Tri-State, First Republic, Signature Bank, and Silicon Valley Bank. As a result, none should be a threat to the financial system. The operative word is should…still, we’ve seen CCC credits widen recently with BBB credits. CCC credits are junk bonds.
One thing Giustra noted was that, because the U.S. economy was strong, the safety of U.S. treasuries is unquestionable. But the rating agencies don’t agree and they had cut U.S. debt to AA+ from AAA way back in 2011. Irrespective of this, the U.S. is having trouble selling its bonds. This is largely because of de-dollarization. We have often noted that.
As the U.S. increases sanctions or other trade restrictions on countries, particularly China and Russia, they are moving away from the U.S. dollar as a means of exchange. Threats to use Russia’s reserves for rebuilding Ukraine has worried many countries. Many countries fear they could be next so they are more than willing to join up with the BRICS to an alternative U.S. dollar system. China has been leading the way, creating alternatives to the IMF, World Bank, and SWIFT, the global payments system. All these organizations are currently dominated by the U.S. The same is true of the World Trade Organization (WTO).
Credit Spreads Over U.S. Treasuries 1994–2024
No, the U.S. dollar is not about to be de-throned yet as the world’s reserve currency. But it is under pressure. China in particular is dumping its holdings of U.S. treasuries. Over the past year, they have allowed their holdings to fall by over $100 billion. The slack has been picked up by Japan whose holdings are up over $100 billion. But Japan is also under pressure due to the rapidly falling yen, and they too may need to sell U.S. treasuries to purchase yen.
An interesting chart on the top 10 holders of U.S. treasuries can be found at en.macromicro.me/collections/51/us-treasury-bond/81306/top-10-countries-holding-us-debt. Note: the chart could not be copied.
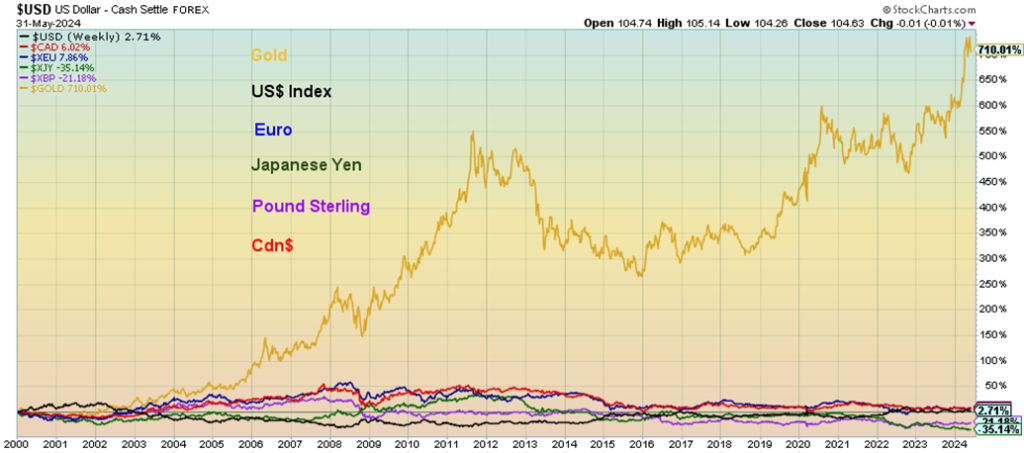
We also include below a chart on the performance of currencies including gold since 2000. Holding any currency has generally been a losing game especially Japanese yen that has fallen 35.1% since 2000. The pound sterling hasn’t fared much better down some 21.2%. The US$ Index is up a mere 2.7% while the Cdn$ fared better up 6.0%. The euro has fared the best up 7.9%. But wouldn’t you have rather held gold instead of a currency? Gold has gained 710% since 2000. (Chart on next page)
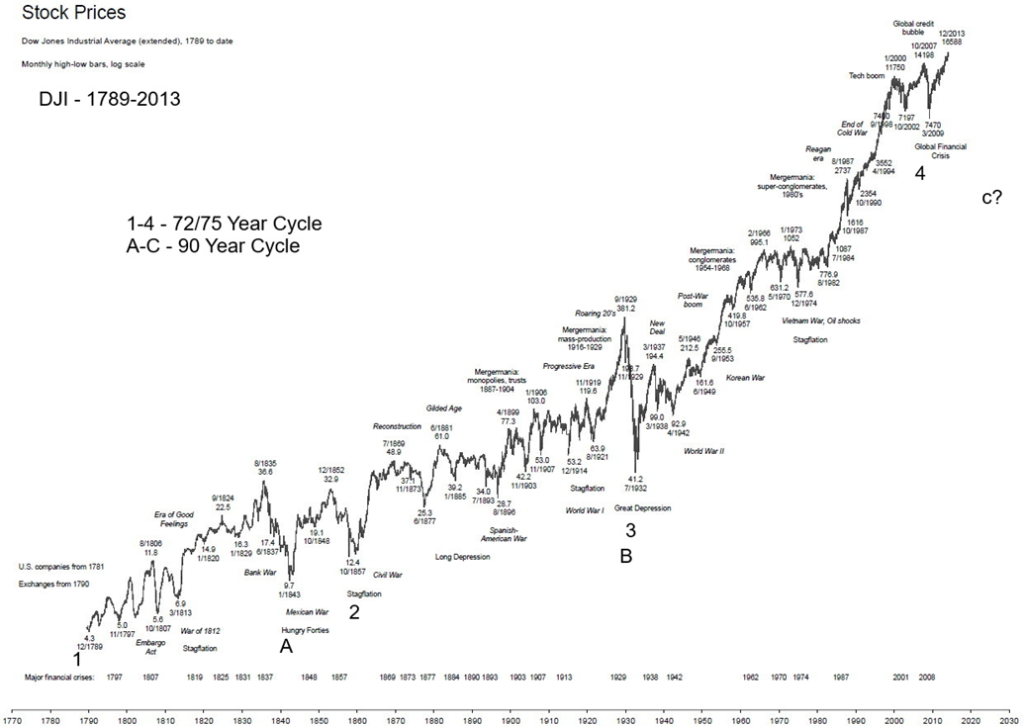
Giustra also noted that debt crises occur roughly every 70 years, the average span for human life. Ray Merriman of MMA Cycles (www.mmacycles.com) has noted a 72–75-year cycle that last bottomed in 2008. Merriman also noted a possible 90-year cycle that last bottomed with the Great Depression and the stock market low in 1932. The 90-year cycle would be rare occurrence as the previous one was recorded with the depression of the 1840s as the stock market bottomed in 1843.
Yes, we could go back further. We note a significant depression that got underway in the 1750s and lasted thorough the 1780s. Extreme stock market lows were seen in 1761 and 1783. Ninety years before that takes us to the disastrous plague and war years of the 1600s. What was known as the “disaster years” during a war between the Netherlands and England resulted in a significant stock market low in 1672. Go back another 90 years and we are in the midst of the depression during the 1500s.
A major stock market low was seen in 1555. The next 90-year cycle is due now. No, that doesn’t mean it is any specific year, but a period of time that could stretch from 2020 and into the 2030s. No wonder Giustra is talking about a financial Armageddon that also includes war.
Chart of the Week
None of this means that the stock market could imminently collapse. However, we could see wild swings both up and down that last over the next decade. We started with the pandemic, then a huge record-breaking rally that topped in 2021. That was followed by the 20%+ drop in 2022, then another run to all-time highs. We expect that this pattern could play out for a number of years.
But one thing that should go higher is gold as confidence in both the economy and the political situation deteriorate further. Gold has been a safe haven for over 5,000 years and, unlike other asset classes, is nobody’s liability. An exception to that may be cryptos, led by Bitcoin; however, unlike gold, cryptos are virtual and still beset with hacks, scams, money laundering, and more.
We live in dangerously volatile times and the crisis remains in its early stages.
Stock Price DJI – 1789–2013
Markets & Trends
| % Gains (Losses) Trends | ||||||||
| Close Dec 31/23 | Close May 31, 2024 | Week | YTD | Daily (Short Term) | Weekly (Intermediate) | Monthly (Long Term) | ||
| Stock Market Indices | ||||||||
| S&P 500 | 4,769.83 | 5,277.51 | (0.5)% | 10.6% | up | up | up | |
| Dow Jones Industrials | 37,689.54 | 38,686.32 | (1.0)% | 2.6% | up | up | up | |
| Dow Jones Transport | 15,898.85 | 15,238.30 | 1.0% | (4.2)% | down (weak) | down (weak) | up | |
| NASDAQ | 15,011.35 | 16,735.02 | (1.1)% | 11.4% | up | up | up | |
| S&P/TSX Composite | 20,958.54 | 22,269.12 | (0.2)% | 6.3% | up | up | up | |
| S&P/TSX Venture (CDNX) | 552.90 | 610.87 | 0.5% | 10.5% | up | up | down | |
| S&P 600 (small) | 1,318.26 | 1,329.65 | 0.7% | 0.9% | up | up | up | |
| MSCI World | 2,260.96 | 2,353.95 | (1.0)% | 4.5% | up | up | up | |
| Bitcoin | 41,987.29 | 67,589.35 | (2.2)% | 61.0% | up | up | up | |
| Gold Mining Stock Indices | ||||||||
| Gold Bugs Index (HUI) | 243.31 | 279.23 | 1.1% | 14.8% | up | up | up | |
| TSX Gold Index (TGD) | 284.56 | 324.45 | (0.2)% | 14.0% | up | up | up | |
| % | ||||||||
| U.S. 10-Year Treasury Bond yield | 3.87% | 4.51% | 0.9% | 16.5% | ||||
| Cdn. 10-Year Bond CGB yield | 3.11% | 3.66% | 1.4% | 17.7% | ||||
| Recession Watch Spreads | ||||||||
| U.S. 2-year 10-year Treasury spread | (0.38)% | (0.38)% | 22.45% | flat | ||||
| Cdn 2-year 10-year CGB spread | (0.78)% | (0.56)% | 9.7% | 28.2% | ||||
| Currencies | ||||||||
| US$ Index | 101.03 | 104.63 | flat | 3.6% | down | up (weak) | up | |
| Canadian $ | 75.60 | 73.39 | 0.2% | (2.9)% | up (weak) | down | down | |
| Euro | 110.36 | 108.50 | flat | (1.7)% | up | up (weak) | down (weak) | |
| Swiss Franc | 118.84 | 110.90 | 1.4% | (6.7)% | up | down | neutral | |
| British Pound | 127.31 | 127.45 | 0.1% | (0.1)% | up | up | neutral | |
| Japanese Yen | 70.91 | 63.57 | (0.3)% | (10.4)% | down | down | down | |
| Precious Metals | ||||||||
| Gold | 2,071.80 | 2,345.80 | 0.5% | 13.2% | up | up | up | |
| Silver | 24.09 | 30.44 | (0.2)% | 26.4% | up | up | up | |
| Platinum | 1,023.20 | 1,042.00 | 0.3% | 1.8% | up | up | up (weak) | |
| Base Metals | ||||||||
| Palladium | 1,140.20 | 912.90 | (5.9)% | (19.9)% | down | down | down | |
| Copper | 3.89 | 4.60 | (3.2)% | 18.3% | neutral | up | up | |
| Energy | ||||||||
| WTI Oil | 71.70 | 76.99 | (0.9)% | 7.3% | down | neutral | neutral | |
| Nat Gas | 2.56 | 2.59 | (6.5)% | 1.2% | up | neutral | down | |
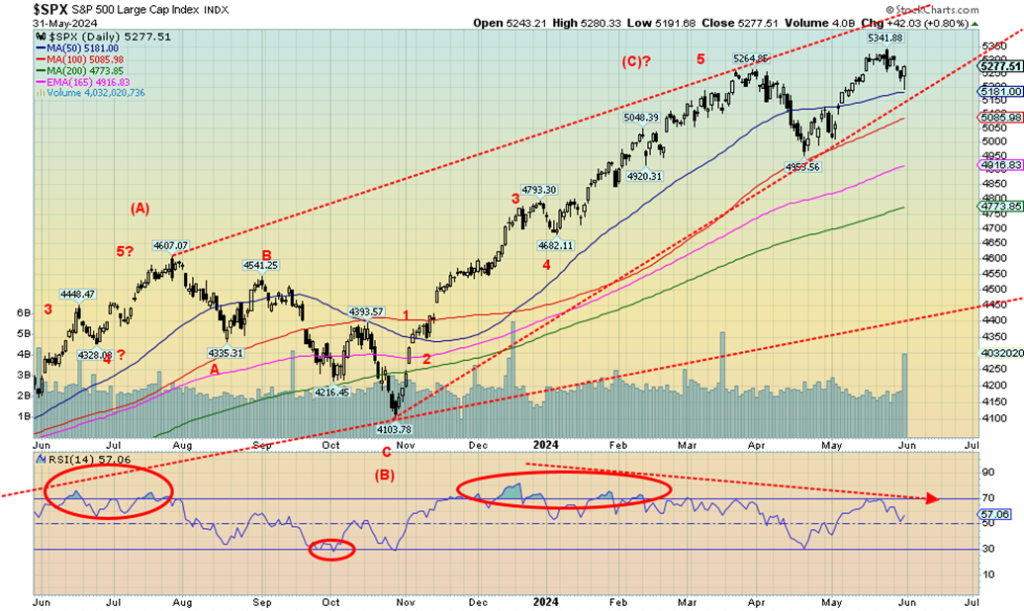
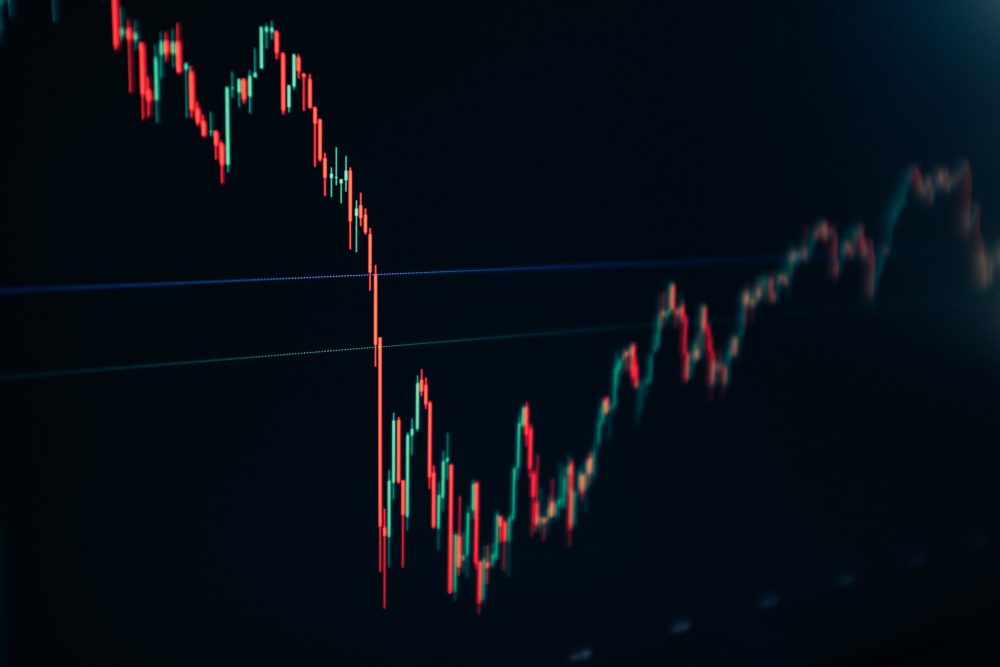
Is the stock market topping? There was a top in March and a low in April as the S&P 500 (SPX) fell about 6%. But then SPX leaped again, gaining almost 8% before possibly topping again in May. This has helped set up all sorts of negative divergences, as the RSI notes above. Each successive high for SPX was met with a lower high from RSI. These divergences are visible on other technical indicators as well. We are also noting negative divergences on breadth indicators, bullish percent indicators, and put/call indicators.
Volatility indicators also diverged with SPX, making new highs but the VIX not making new lows. So, the negative signs are there. But confirmation remains to be seen. A breakdown under 5,180 could do the trick. But a break and close under 4,960 would seal it. SPX appears to be forming an ascending wedge triangle, which is also negative. This is irrespective of Friday’s sharp up day. However, we note Friday saw good gains from the Dow Jones Industrials (DJI) and SPX, but the NASDAQ fell. New highs could also occur, but that might only heighten the growing negative divergences.
On the week, SPX fell 0.5%, the DJI was down 1.0% despite Friday’s gain, the Dow Jones Transportations (DJT) diverged, gaining 1.0%, while the NASDAQ fell 1.1%. The NASDAQ was pushed by the NY FANG index. The FAANGs were mixed. The NY FANG index fell 2.4%. That didn’t stop Nvidia, which gained 2.9% as they are now the third largest company in the world and fast gaining on number two (Apple). Microsoft remains in front with a market cap of $3.085 trillion. The largest gold mining company is Newmont with a market cap of $48.6 billion, a mere 1.5% of Microsoft. No wonder gold stocks are so cheap. Microsoft could buy up the entire world gold mining market and have considerable change left over.
Elsewhere, the S&P 400 (Mid) gained 0.2% while the S&P 600 (Small) was up 0.7%. That the Mid and Small were up is also a divergence with SPX, but a positive one. Although, on the year, SPX’s gain of 10.6% vs. the Mid up 7.2% and Small up 0.9% remains heavily in favour of large cap over mid and small cap. In Canada, the TSX Composite was down 0.2% while the TSX Venture Exchange (CDNX) was up 0.5%. Energy (TEN) led the gainers, up 1.5%, while Income Trusts (TCM) led the losers, off 2.3%.
TCM and other interest-sensitive sectors may be responding to long-term rates backing up. In the U.S., the 10-year U.S. treasury note rose to 4.51% from 4.47% while the Canadian Government 10-year bond (CGB) was up to 3.66% from 3.61%. However, the 2–10 spreads narrowed as the U.S. 2–10 fell to negative 38 bp from negative 49 bp and the Cdn 2–10 was down to negative 56 bp from negative 62 bp.
We’ve never seen the inverted yield curve last as long as it has. However, its record of predicting a recession is perfect. Maybe Canada helped as the recent GDP numbers came in at 1.7% annualized vs. a forecast of up 2.3%. The Q1 growth rate was 0.4% when they expected 0.6%. Some are arguing that gives the BofC room to cut rates in June. The BofC interest rate decision is this Wednesday and the forecast is a cut to 4.75% from 5.00%.
In the EU, the London FTSE was down 0.5%, the EuroNext was off 1.1%, the Paris CAC 40 was down 1.3%, and the German DAX down 1.1%. Fear of escalation in the Russia/Ukraine war is concerning Europeans as word comes that NATO troops could be in Ukraine and permission is being granted to use NATO armaments to hit directly into Russia. Russia views it as an escalation, confirming their suspicion that they are really fighting NATO, even as NATO (and the U.S.) deny it. Nonetheless, this could bring us closer to a NATO/Russia clash and World War III.
In Asia, China’s Shanghai Index (SSEC) fell 0.1%, the Tokyo Nikkei Dow (TKN) was off 0.4%, and Hong Kong’s Hang Seng (HSI) fell 2.8%. Asians too are concerned about war, trade sanctions, and more. The MSCI World Index fell 1.0%.
Bitcoin fell 2.2%. It remains above $60,000 but is struggling at $70,000. We still hear calls we’re going to $100,000. But the market cap of all cryptos is only $2.5 trillion. Gold’s market cap, excluding central banks, is $7.5 trillion. U.S. federal debt is $34.8 trillion. Microsoft is $3.1 trillion. Of the $2.5 trillion for cryptos, Bitcoin is $1.3 trillion of it. There is still only 19.7 million in Bitcoin outstanding. A move that helps keep the market elevated.
We can’t yet tell whether the market has topped. Despite all the external issues, the U.S. remains the most robust market in the world. This coming Friday, June 7 nonfarm payrolls and the employment numbers are reported. The market is expecting only 151,000 jobs vs. 175,000 last month. The unemployment rate is to remain at 3.9%. In Canada, they are expecting 5,000 jobs and an unchanged unemployment rate of 6.1%. This is following April’s gangbuster jobs of 90,400. But most of that was part-time jobs.
Stock markets may have topped. It’s “sell in May and go away.” The summer driving season is here. And the lazy hazy days of summer are officially only 17 days away. June is the second worst month of the year for the DJI with a record of 34 up months and 39 down months for the DJI. Although a better month for both SPX and the NASDAQ.
Although in an election year June tends to do well. But this year’s election is a mess of uncertainty, and could be contentious, possibly even violent. We also can’t help but note that bankruptcies and delinquencies are rising, and that economic numbers are waning. A recession is coming. We just can’t say when it will come or how bad it might get once it arrives. And that could translate into a drop in the stock market that remains overvalued.
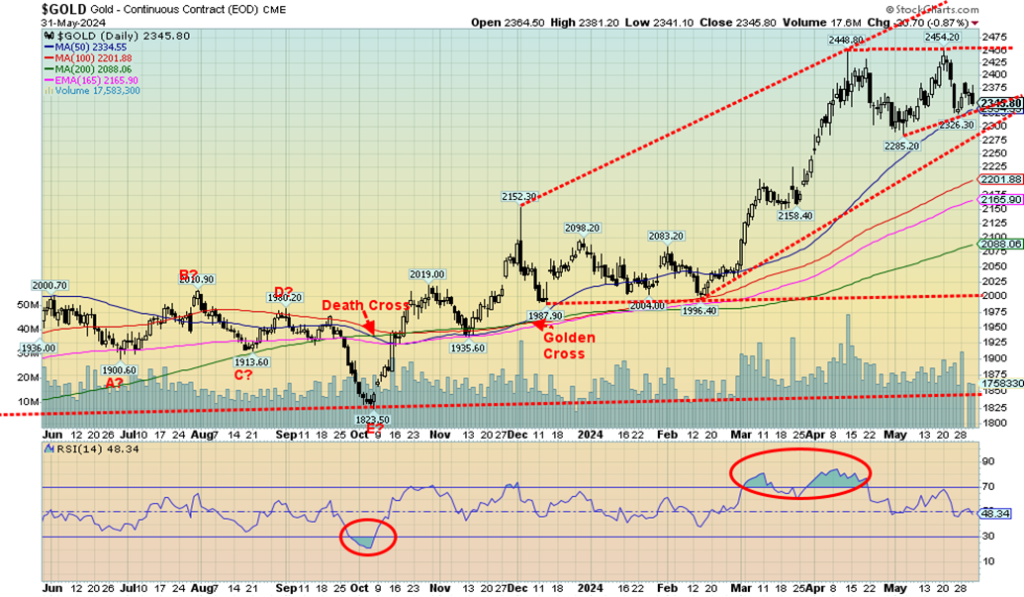
Despite a bumpy past few weeks, gold managed to gain roughly 1.4% in May. On the year, we are up 13.2%. Silver has done even better, up 14.2% in May and 26.4% in 2024. Nonetheless, the market often tends to look at the negatives for gold, The past two weeks have been down for gold, and, as well, four of the past six weeks have been down. That’s when we start seeing articles that question the value of holding gold.
Yes, gold’s upward push has been helped immensely by central bank buying and Asian buying, particularly China and India as the people snap up gold as a hedge against all of the real estate problems and economic uncertainty. Central bank buying has been spurred on concern about the West, EU, and U.S. seizing Russian reserves to be used by Ukraine. De-dollarization is a theme that can’t be ignored. However, the “why hold gold” crowd cites that gold ETFs have faced net withdrawals.
However, the indictment of former president Donald Trump has raised some questions about “why hold gold.” Political uncertainty and loss of confidence in government are two reasons. But gold, unlike other asset classes, is nobody’s liability. Gold is also private as opposed to digital. Of course, we are talking about physical gold (and silver) bullion as opposed to gold stocks, gold ETFs, digital gold, and more.
Even Bitcoin that crypto fans claim is private leaves a digital footprint somewhere. Cryptos are also massive users of energy so they have climate and energy implications. Gold mining is also dirty and leaves dangerous tailing ponds. Cryptos are hacked, stolen, and used for money laundering and numerous scams. However, gold too can be stolen—remember the recent Pearson Airport heist? However, in many instances the perpetrators are also caught. Hello, Sam Bankman-Fried. So, there are pluses and minuses.
Gold’s privacy is paramount. As an article in MarketWatch suggested, if Trump had paid off stormy Daniels in gold coins there’d be no record (www.marketwatch.com/story/trumps-guilty-verdicts-make-34-cases-for-gold-bb962dd8). Using the regular banking system, irrespective of how you disguise it, leaves a paper trail. Certainly, that’s an argument against moving to exclusively digital currencies where every coffee purchase is tracked.
On the week, gold gained 0.5% while silver was off 0.2%. Platinum was up 0.3%. The near precious metals were off as palladium fell 5.9% and copper came off its highs, down 3.2%. The copper rally in particular we do not believe is over. The gold stock indices were mixed as the Gold Bugs Index (HUI) rose 1.1% but the TSX Gold Index (TGD) fell 0.2%. The gold exploration mining dominating the TSX Venture Exchange (CDNX) gained 0.5% on the week.
The reality, however, is that gold stocks remain very cheap compared to the price of the gold. Junior mining exploration stocks remain even cheaper as they are under-owned, unloved, and unrecognized by the broader investing public. However, if a shift comes, that market can move upward swiftly because of the lack of product. A breakout over 300 for the HUI and 340 for the TGD could start a more significant rally.
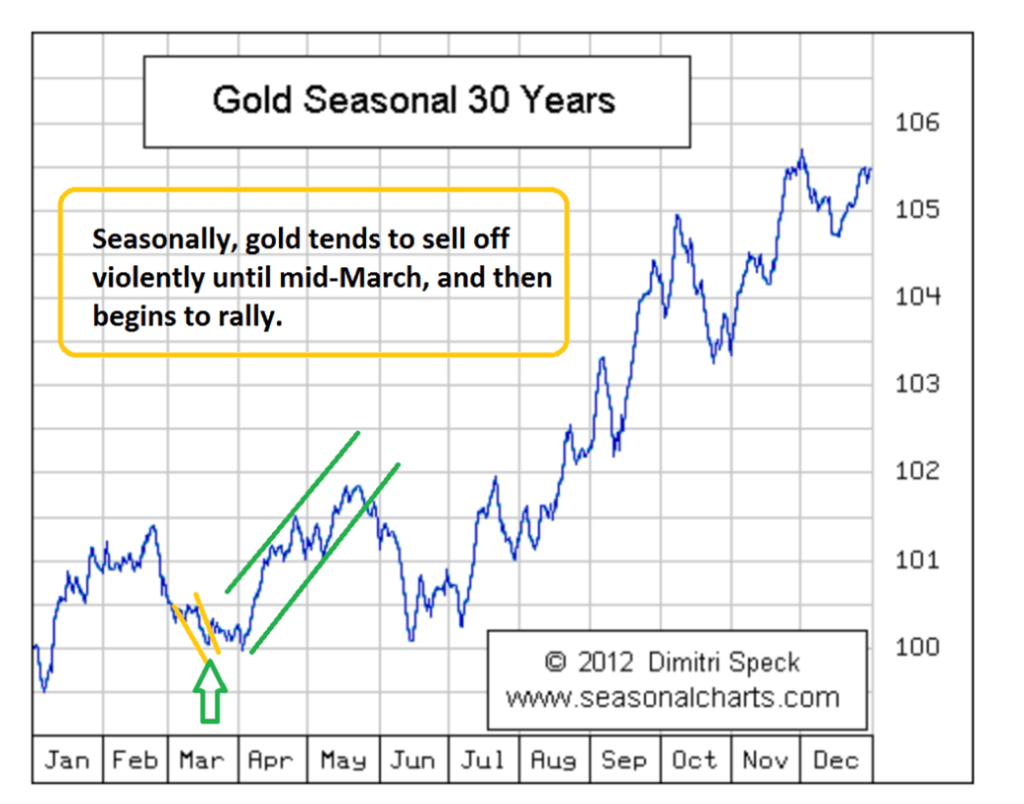
May and June tend to be weak months for gold. But, as the chart below suggests, once seasonal weakness is out of the way gold has a tendency to soar. A low could come in June, but normally no later than July. The current pullback is to be accumulated. The seasonal chart below is over 30 years. A look over a 40-year seasonal chart shows the decline into May/June/July is even more pronounced.
But after that a rally gets underway with usually an interruption into September/October that can drag into December if the top is later. Given the political uncertainty that the U.S. election in November is sure to generate, there might be numerous reasons to hold gold. As well, geopolitical uncertainty continues in Russia/Ukraine/NATO, Israel/Gaza/Lebanon/Syria/Iran, and U.S./China. Even we were surprised to read that over one-third of Canadians believe another world war could occur over the next 5–10 years. Given the current geopolitical situation, they may not be wrong.
Gold could be forming an ABC corrective pattern with the potential to test that secondary support near $2,275. The A and B waves are complete. We may be working on the C wave. Or if current levels hold, we could be tracing out a rising or ascending triangle which is bullish. However, that is normally a five-pronged correction of the nature abcde. Silver had quite the run, topping at $32.75. Then silver fell to $30.24 before rising again to $32.51.
Now silver is off again, last at $30.44. A test under $30, the breakout point, is now not impossible. Strong support can be seen down to $28. Nonetheless, we continue to view this as a corrective period with a low either sometime in June but no later than in July. Currencies, which can impact the price of gold, were mixed this week with the US$ Index flat on the week as was the euro. The Swiss franc, which is often viewed as a safe-haven currency, jumped 1.4%.
A quick note on oil. WTI oil did not have a good week, falling 0.9%. Brent crude was also down 0.9%. Natural gas (NG) fell 6.5%, but NG at the Dutch Hub gained 2.0%. The ARCA Oil & Gas Index (XOI) was up 1.3% and the TSX Energy Index (TEN) gained 1.5%. A lot of oil sloshing around and there has been no major Middle East clash to impact the price—at least, not yet. But eyes will be on an upcoming OPEC+ meeting that could see production cuts. As a result of OPEC cuts, the U.S. is now the world’s largest producer. But they are also the world’s largest consumer and still import oil primarily from Canada.
__
(Featured image by Adeolu Eletu via Unsplash)
DISCLAIMER: This article was written by a third party contributor and does not reflect the opinion of Born2Invest, its management, staff or its associates. Please review our disclaimer for more information.
This article may include forward-looking statements. These forward-looking statements generally are identified by the words “believe,” “project,” “estimate,” “become,” “plan,” “will,” and similar expressions. These forward-looking statements involve known and unknown risks as well as uncertainties, including those discussed in the following cautionary statements and elsewhere in this article and on this site. Although the Company may believe that its expectations are based on reasonable assumptions, the actual results that the Company may achieve may differ materially from any forward-looking statements, which reflect the opinions of the management of the Company only as of the date hereof. Additionally, please make sure to read these important disclosures.
Copyright David Chapman 2024
David Chapman is not a registered advisory service and is not an exempt market dealer (EMD) nor a licensed financial advisor. He does not and cannot give individualised market advice. David Chapman has worked in the financial industry for over 40 years including large financial corporations, banks, and investment dealers. The information in this newsletter is intended only for informational and educational purposes. It should not be construed as an offer, a solicitation of an offer or sale of any security. Every effort is made to provide accurate and complete information. However, we cannot guarantee that there will be no errors. We make no claims, promises or guarantees about the accuracy, completeness, or adequacy of the contents of this commentary and expressly disclaim liability for errors and omissions in the contents of this commentary. David Chapman will always use his best efforts to ensure the accuracy and timeliness of all information. The reader assumes all risk when trading in securities and David Chapman advises consulting a licensed professional financial advisor or portfolio manager such as Enriched Investing Incorporated before proceeding with any trade or idea presented in this newsletter. David Chapman may own shares in companies mentioned in this newsletter. Before making an investment, prospective investors should review each security’s offering documents which summarize the objectives, fees, expenses and associated risks. David Chapman shares his ideas and opinions for informational and educational purposes only and expects the reader to perform due diligence before considering a position in any security. That includes consulting with your own licensed professional financial advisor such as Enriched Investing Incorporated. Performance is not guaranteed, values change frequently, and past performance may not be repeated.


Credibur Scales Rapidly: €2 Billion in Structured Debt Facilities in Six Months
Infrastructure fintech Credibur has added over two billion euros in structured debt facilities within six months. Its platform connects lenders,...


EU Taxonomy 2025: Progress in ESG Reporting, Gaps in True Sustainability
EY’s EU Taxonomy Barometer 2025 shows improved ESG reporting among European companies, but a major gap remains between “eligible” and...


Democratizing Farmland Investment: The Rise of Farm Fractions in Agritech
Farm Fractions is a Chilean startup that enables individuals to invest in farmland from US$100 through fractional ownership. Using fintech...


Crypto Markets Edge Up as Caution Persists and April Fools’ Scams Loom
Bitcoin and Ethereum rise slightly amid geopolitical easing and renewed ETF inflows, with BTC near $68,000 and ETH above $2,100....


Lowryder: The Autoflowering Revolution in Cannabis Cultivation
Lowryder is a groundbreaking cannabis strain that introduced autoflowering, allowing plants to flower automatically without light changes. Created by The...
 |
|
 |  |
 |
|
-
 Business3 days ago
Markets Volatility, Geopolitics, and Signals of a Potential Trend Shift
-

 Africa2 weeks ago
Fes-Meknes Drives Investment Growth with Diversified Sectors and Industrial Expansion
-
 Impact Investing5 hours ago
EU Taxonomy 2025: Progress in ESG Reporting, Gaps in True Sustainability
-

 Africa1 week ago
Bank Al-Maghrib Launches Reforms to Boost Credit via Non-Performing Loan Market