Markets
Rising U.S. Debt and Growing Financial Risks
With $38.7 trillion in federal debt and $106.7 trillion total debt, the U.S. faces mounting fiscal strain. Debt-to-GDP stands at 124%, deficits exceed $1 trillion annually, and interest costs of $1.2 trillion now outpace GDP growth. While reserve currency status helps, central banks are shifting toward gold, raising concerns about long-term financial stability.
Is the U.S. headed towards a fiscal and financial crisis that could threaten the global financial system? Many believe that could be the case. According to the U.S. Debt Clock (www.usdebtclock.org) and the U.S. Treasury (www.home.treasury.gov), U.S. federal government debt stands at $38.7 trillion, the largest government debt in the world, representing some 11%–12% of all debt globally.
Of that total, $31.1 trillion is held by the public (corporations, insurance, pension, funds, foreign holders, state and local governments, central banks, Federal Reserve, individuals) while $7.6 trillion is held by intragovernmental agencies (i.e., Social Security trust funds, federal retirement funds, Medicare/Medicaid trust funds, numerous other federal agencies). Foreign holders of U.S. tteasuries total $9.3 trillion with Japan as the largest holder with just under $1.2 trillion.
The U.S. federal debt to GDP is currently at 124.2%. That means there is $1.24 of federal debt for every dollar of GDP. Debt exceeds revenues (GDP). No, it is not the highest in the world nor even the highest in the G7. That mantle belongs to Japan at 237%. Italy is at 135%. The highest is Sudan at 272%, but then Sudan is bankrupt.
Total U.S. debt (federal/state/local governments, financial and non-financial corporations, and individuals/consumers) stands at $106.7 trillion, the highest in the world and roughly one-third of all global debt. Interest payments on the U.S. federal debt were last reported for Q3-2025 by the Federal Reserve at about $1.2 trillion. It is now the third largest government expenditure behind Medicare/Medicaid and Social Security. It exceeds what the U.S. spends on defense. Interest payments are fixed and they cannot be cut back.
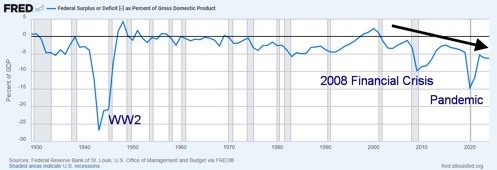
This might come as a surprise to many, but the U.S. has been running deficits continuously since 2001. These deficits are often in excess of $1 trillion, particularly through the financial crisis 2008–2011 and again during the pandemic in 2020 where the budget deficit reached over $3 trillion. The budget deficit in 2025 was $1.8 trillion and is expected to exceed $2 trillion in 2026, continuing that way through 2030. Expenditures continuously exceeding revenues are a disaster for consumers, corporations, and even governments.
However, the U.S. has the advantage of being the world’s reserve currency and central banks globally hold U.S. securities as reserves. That sounds good, but central banks’ holding of U.S. securities has been falling as a percentage of their reserves and now stands at about 57%. Central banks now hold more gold than they do U.S. treasuries.
Not only have central banks been adding to their gold reserves, but the rise in gold’s price has also played a role in gold becoming their largest reserve asset. Fear of the massive U.S. debt is a major driver for central banks to choose gold over U.S. treasuries, even as gold pays no interest and there are considerable storage costs.
A major concern is interest payments, which are now growing at a faster rate than the rate of GDP growth. While GDP as a percentage of interest payments has mostly exceeded GDP growth for years, it is only since 2020 that interest payment growth has exceeded GDP growth by a considerable margin. There was a respite period during the 1990s when the U.S. ran budget surpluses and GDP growth exceeded the growth of interest payments, but not any longer.
GDP/US Interest Payments 1949–2026

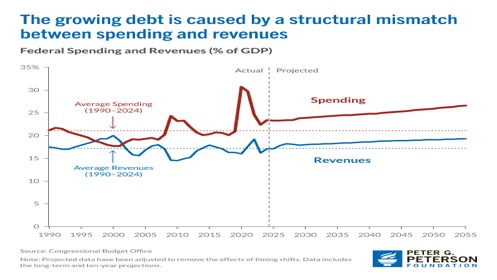
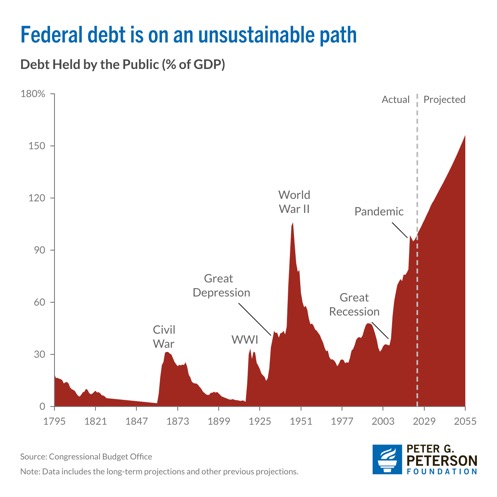
Quite simply, debt growth is on an unsustainable path. One can’t run $2 trillion deficits every year with sharply rising interest payments that also exceed your revenues. Our chart on the next page from the Peter G. Peterson Foundation (www.pgpf.org) shows how spending will continue to exceed revenues far into the future. The budget deficit as a percentage of GDP was last reported by the
Federal Reserve in 2024 at 6.2%. The Economist (www.economist.com) estimates the 2026 U.S. budget deficit to GDP for 2026 at 6.5%. It’s the highest in the G7. Canada’s (to the surprise of some, we’re sure) is estimated at 2.2%, the lowest in the G7. Indeed, looking at The Economist’s estimates, the U.S. budget deficit to GDP is the second highest in the world, behind Brazil.
There are many reasons for the rising deficits, such as increasing costs for Social Security and Medicare/Medicaid due to an aging population, but there are also the rising defense budgets and interest payments. But large tax cuts that benefit primarily the wealthy and corporations are also not a road to fiscal sanity. An aging population with a stagnant working population also plagues the remaining G7 countries. Rising healthcare costs are the biggest driver for the U.S. as they are in the other G7 countries.
However, coincidently, the U.S. has the highest healthcare costs per capita amongst the wealthy countries. Canada’s costs per capita for healthcare are a good half of what the U.S. spends. U.S. per capita healthcare costs stand at $14,885, according to the Peter G. Peterson Foundation.
But it is interest payments that are fastest growing. No wonder President Trump would like interest rates to be sharply lower. Nonetheless, interest payments are expected to rise from current levels of $1.2 trillion annually. As we have often noted, the Fed may control the short end of the market, but the bond market rules the long end. Running massive deficits does nothing for lowering interest rates at the long end of the curve. It could put upward pressure on longer-dated securities. The spread between the short and long end will widen.
Budget Deficit as a Percentage of GDP 1929–2026
Interest Spread 10-year minus 2-year 1976–2026
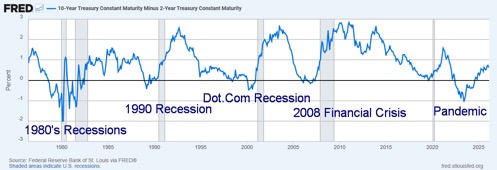
Rising and positive yield-spreads normally signal good times. But this time the yield spread is rising because of the dangers of the massive U.S. debt and deficits exceeding revenues. It also indicates that while short rates fall, long rates remain stickily high.
Negative spreads usually signal a recession ahead. However, to date we’ve had no recession, even as signs point to a deteriorating economy, despite proclamations to the contrary from President Trump. As we have noted, along with many others, the U.S is on an unsustainable path. What happens when the rest of world starts dumping U.S. securities as some already have i.e. China?
Rising debt. Rising interest payments that now exceed GDP growth. That’s a recipe for gold.
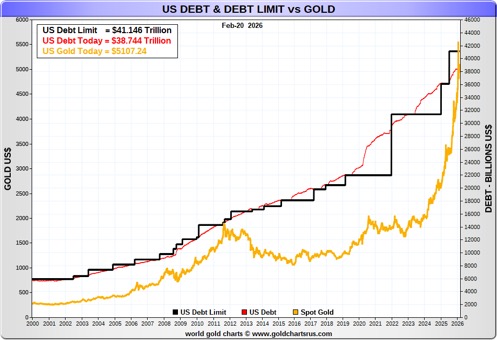
Chart of the Week
MAGS – Roundhill Big Tech ETF MAG7
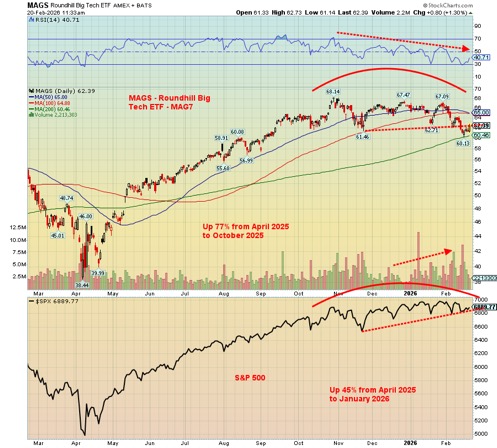
MAGS (CBOE BZX Exchange, NASDAQ) Roundhill Magnificent Seven ETF offers equal weight exposure to the “Magnificent Seven” (MAG7) stocks – i.e., Alphabet, Amazon, Apple, Meta, Microsoft, Nvidia, and Tesla. MAGS has been the stock market leader, particularly coming out of the 2020 pandemic. Since 2020, MAGS is up almost 163%, even as it was higher. The big leader for the MAG7 has been Nvidia (NVDA/NASDAQ), up a mind-boggling 3,142% since 2020. Next up is Tesla (TSLA/NASDAQ), up 1,374%. On the other hand, the S&P 500 is up 114% while gold is up 229%.
The MAG7 stocks, along with a few others such as Broadcom (AVGO), Berkshire Hathaway (BRK.A), and Eli Lilly (LLY), have made up some 40% of the S&P 500. This is concentration at an unbelievable level. So, it shouldn’t be a surprise that if the MAG7+ led the market up they could also lead the market down. That appears to be what could be happening. MAGS is currently down 8% from its all-time high while the S&P 500 is down only 2%.
From October 2025 through February 2026, MAGS appeared to be making a rounding top pattern. It recently broke the uptrend line. However, it found support at the 200-day MA and now appears to be attempting a rebound. We’re tempted to say this correction is over; however, it would be wise to await a breakout above $67 to suggest that a low might be in. The topping pattern suggests a fall to around $55. A break now back under $60 could start us on our way.
What’s interesting is that we appear to be diverging from the S&P 500. While MAGS broke its trend line that forms the topping pattern near $62, the S&P 500 continues to hold its trend line currently near 6,800. Under 6,500, a top would be confirmed for the S&P 500.
Both the S&P 500 and MAGS made tops in October 2025. However, the S&P 500 made further new all-time highs in late January 2026 while MAGS did not. That’s a divergence, especially given the leadership role of the MAG7 on the way up.
No, we do not yet have any confirmation that a major top has been made. However, given the negative top rounding pattern, along with the divergence between MAGS and the S&P 500, one would be wise to keep their powder dry and not be chasing any further.
GDP Growth
U.S. GDP Growth vs. U.S. 10-Year Treasury Note Yield 2016–2026
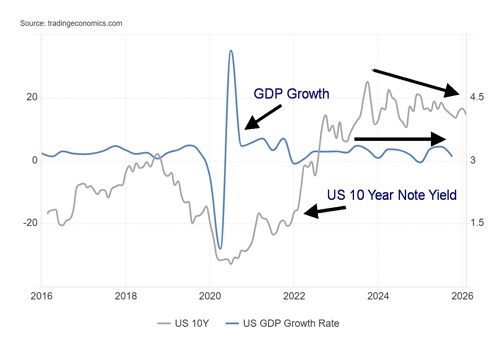
U.S. GDP growth for Q4 2025 came in below expectations at 1.4%. It was the lowest since Q1-2025, which recorded a contraction of 0.6%. Q3 reported growth at 4.4%. The forecast was for 3% growth. For 2025, that puts 2025 growth at 2.25% vs. 2.8% for 2024. It has been the lowest GDP growth since the 2020 pandemic that saw a contraction of 2.1%.
We compared GDP growth with the U.S. 10-year Treasury note. Throughout the 2010s, after the 2008 financial crisis and especially after the 2020 pandemic, yields on the U.S. 10-year Treasury note were consistently below GDP growth. That changed after the inflation-driven 2022. Since then, the U.S. 10-year has traded consistently higher than GDP growth. Will higher rates lean on GDP growth? Possibly.
The areas most impacted by GDP growth saw a decline in consumer spending, a decline in exports, although
imports declined less, plus the effects of the government shutdown as government spending fell. However, there were investment gains. Overall, this was a disappointment, but in some ways shouldn’t have been surprising.
PCE Prices
PCE Prices, Fed Interest Rate, U.S. 10-Year Note 2016–2025
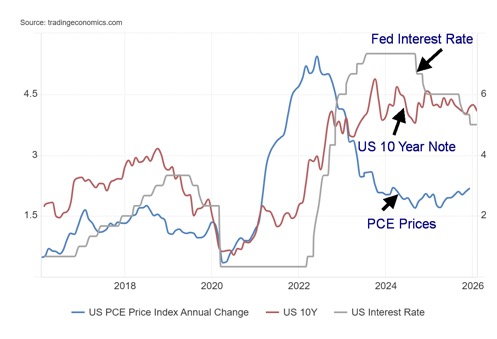
Personal Consumption Expenditures (PCE) jumped to 2.9% in December, according to the last available report: above 2.8% in November and above expectations of also 2.8%. Services were the main culprit, which were up 3.4%. This could continue to put the Fed in a quandary at its upcoming March 17–18 FOMC meeting. Especially given everything else that is happening with the Supreme Court ruling against Trump’s tariffs and threats of war against Iran (war is always inflationary).
PCE prices are normally the Fed’s favourite way to measure inflation. Add to this President Trump’s imposing of a 10% blanket global tariff (followed quickly by 15%) on everyone in response to the Supreme Court ruling (Note: The U.S. is using a different legislation than that ruled against by the Supreme Court to justify these tariffs. However, they have an end date and thereafter need congressional approval). Add splits in the Fed board and an incoming new Fed Chair, Kevin Warsh, who may or may not follow President Trump’s instructions to lower interest rates sharply. Stir it all together and the March FOMC is shaping up to be contentious. Notably, the U.S. 10-year Treasury note backed up in yield to 4.09% from 4.05% the previous week.
Stocks
Stocks were all over the map in this holiday-shortened session. They were down, then rebounded, and closed up. But what about this coming week after we learned of the U.S. Supreme Court’s ruling on tariffs? Their ruling that doesn’t stop President Trump from imposing first 10% global tariffs and then, in a heartbeat, upping them to 15%. What’s next? Who knows?
That we live in a volatile and uncertain world is now a given. And that makes investing a mug’s game – invest and you might get mugged. However, the markets were up this week. Some even made new all-time highs. The S&P 500 gained 1.1%, the Dow Jones Industrials (DJI) was up 0.3%, the Dow Jones Transportations (DJT) gained 2.6%, while the NASDAQ was up 1.2% as the MAG7 rebounded a bit.
The S&P 400 (Mid) gained 1.2% while the S&P 600 (Small) was up 0.6%. The S&P 500 Equal Weight Index gained 0.6% while the NY FANG Index rebounded, up 1.6%. Interestingly, the Dow Jones Utilities (DJU) did make new all-time highs (barely) but closed down on the week by 0.8%. Five of the MAG7 had gains on the week with only Microsoft and Tesla down. Donald Trump’s Trump Media continues to fall, down 7.9% this past week to new all-time lows. A poll of a different sort?
In Canada, the TSX made new all-time highs, thanks once again to gains in the commodity sectors. The TSX was up 2.3%. The TSX Venture Exchange (CDNX) gained 5.1%. In the EU, the London FTSE made all-time highs, up 2.3%, as did the Paris CAC 40, up 2.5%, and the EuroNext, up 2.7%. The German DAX gained 1.4%. In Asia, China’s Shanghai Index (SSEC) was closed all week for the Chinese Lunar New Year. The Tokyo Nikkei Dow (TKN) was off 0.2%, Hong Kong’s Hang Seng (HSI) was down 0.6% and India’s Nifty Fifty was up 0.4%. The MSCI World Index ETF (ex U.S.) was up 1.2% to new all-time highs.
On the TSX, the commodities (golds, metals, materials) led as usual, but it was others that stole the limelight. Making new all-time highs, besides the TSX Composite and the TSX 60, was Income Trusts (TCM), Consumer Discretionary (TCD), Consumer Staples (TCS), and Utilities (TUT). Making new highs only was Energy (TEN).
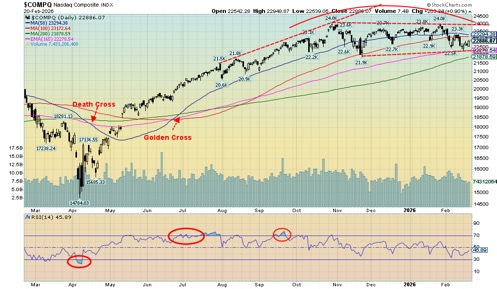
Since we discussed the S&P 500 earlier, we are showing the NASDAQ. As we have noted, the NASDAQ appears to be breaking support but then rebounded this past week. We need to break under 21,900 to tell us that a top could be in. Under 20,600/20,900 a top is confirmed. Until then a rebound and new highs remain possible.
Given all the uncertainty and volatility, we don’t view this period as ideal for taking on new positions, even as some areas such as gold remain a buy. Interest rates backed up slightly this past week due to the threat of tariffs, higher PCE prices and war. The US$ Index initially gained, then faded back but still made small gains on the week. Other currencies fell.
We live in uncertain and volatile times. Trade wars prevail on the economic front, with threats of war on the geopolitical front. Uncertainty in the U.S. remains, given the volatile president and the continued presence of ICE on the streets. The market remains volatile with the CNN Fear & Greed Index now registering fear. But notably, a few areas remain at extreme greed, including market momentum and the McClellan Summation Index. Other indicators show the opposite. Profits remain good despite all the turmoil. But we also know insiders are neutral here with a tendency to buy low PE stocks and sell higher PE stocks.
Gold and Silver
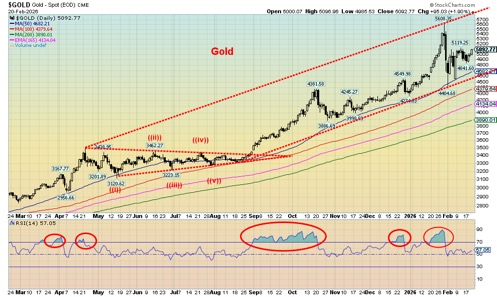
Gold continues in its corrective phase. At play this past week were the U.S.’s threats to bomb Iran and, at the end of the week, the Supreme Court striking down Trump’s tariffs. But in typical Trumpian fashion they appear to be ignoring the Supreme Court, placing a blanket 10% tariff (later raised to 15%) on the world in addition to whatever other tariffs are floating around. How that impacts some the of the deals the U.S. signed with countries (i.e., Japan, South Korea) is unknown. Also unknown, but with the potential to happen, is the return of the tariffs already collected although we wouldn’t hold our breath that will happen.
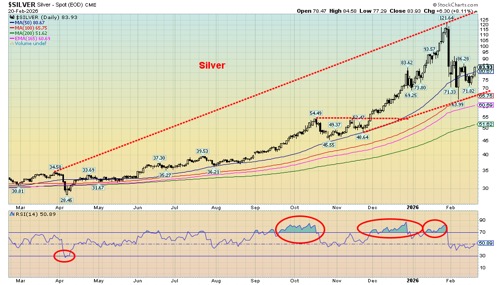
It’s a minefield for investors. Currency debasement, threats of war (geopolitical), more tariffs, uncertainty as to what the Fed will do in the face of stronger than expected job numbers, and inflation remaining stickily high all turns into a high stakes game. Gold responded by rising 1.0% this past week after trading lower earlier. Silver was up 8.7%, a good gain after a week or three of weakness. Platinum was up 5.0% while palladium gained 3.8% and copper was up 1.2%. All remain firmly to the upside for 2026.
Central bank purchases have slowed down a bit, but many are expecting them to ramp up again. Also, there is more investment demand as everyone is hesitant about the geopolitical and economic situation. It generates a lot of uncertainty and in that environment gold can flourish. Bitcoin continues to lose favour, falling 1.6% on the week, down over 22% in 2026 and down 50% from its all-time high.
An interesting story we picked up this past week is that some investors or a group of institutional investors are buying deep, out of the money call options on gold at strike prices between $15,000 to $20,000 with a December 2026 maturity. Spreads were also being used for the $15,000 and $20,000 strikes. Apparently, some 11,000 contracts have been executed. These are lottery ticket purchases, but some people are expecting extreme volatility to enter the market as the year progresses. That’s interesting, considering gold currently is at $5,000. They didn’t mention silver, but after silver hit a high of $121, some are expecting it to go to $200 next and the gold/silver ratio, currently at 60 (it has been recently as low as 44), to fall to the 20–30 range.
The question on our mind is: is the gold correction over? We’d like to see a clear ABC-type correction so that would suggest a test of the recent low or new lows under $4,400. Silver’s low was $64. Ideally, what you see on a test of the lows or new lows is that gold or silver makes new lows but the other doesn’t, a divergence and sometimes a signal we may have bottomed. New highs above $122 silver and $5,600 gold would end any discussions as to whether we are headed lower. But right now, we’ve been in a corrective mode, and we can’t say the correction is over just yet. The odds do favour an eventual breakout to new highs as geopolitical tensions heighten and economic conditions deteriorate. Oh yes, and sticky inflation. Gold remains the ultimate safe haven.
Oil and Gas
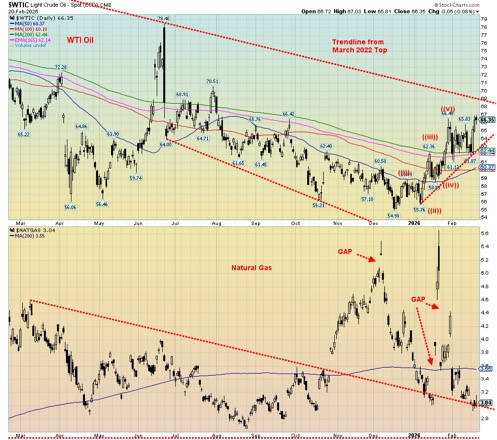
Once again, to bomb Iran or not to bomb Iran is on the table. The back and forth on whether to bomb Iran seems to change every minute with the whim of the president. It keeps everyone guessing. But oil prices have spoken and WTI oil jumped 5.6% while Brent crude was up 6.0%. Oddly, the energy stocks that had been leading with gains prior to this move were up only 1.0% for the ARCA Oil & Gas Index (XOI) and up 2.5% for the TSX Energy Index (TEN). Are they signaling hesitation about the possibility of a strike on Iran? Effectively, Iran is being asked to sign whatever the U.S. puts in front of them, seemingly whether they like it or not. The U.S. says 10–14 days to sign a deal, or else.
But into the fray comes another wild card. Chinese and Russian warships joined Iranian warships for military exercises. Will China and Russia stick around? If so, the U.S. might want to think twice about bombing Iran as that could have unintended consequences. Hence, the nervousness in the oil market that saw WTI oil jump to new highs. Interestingly, we see that the first wave unfolded in five waves, suggesting a potential primary move for WTI oil.
The correction was a pretty straightforward abc. Now we’ve jumped out again. But we remain shy of a more significant breakout over the downtrend line from the 2022 top during the initial stages of the Russia/Ukraine war. That level is now at $69, but we’d feel more comfortable on a jump over $70 on volume.
Natural gas (NG) hasn’t been much help and remains mired, owing to confusion about what might happen in Iran. Some 20% of the world’s LNG flows through the Straits of Hormuz. No wonder the straits are the biggest chokepoint for energy in the world. This past week NG at the Henry Hub fell 5% while NG at the EU Dutch Hub was off 2.5%.
Oil and gas remain key to the functioning of the world, so war in the Middle East that could negatively impact supply is quite meaningful. As we note – to bomb or not to bomb Iran.
Markets and Trends
| % Gains (Losses) Trends | ||||||||
| Close Dec 31/25 | Close Feb 20/26 | Week | YTD | Daily (Short Term) | Weekly (Intermediate) | Monthly (Long Term) | ||
| S&P 500 | 6,845.50 | 6,909.51 | 1.1% | 0.9% | up | up | up | |
| Dow Jones Industrials | 48,063.29 | 49,625.97 | 0.3% | 3.3% | up | up | up | |
| Dow Jones Transport | 17,357.19 | 19,841.18 | 2.6% | 14.3% | up | up | up | |
| NASDAQ | 23,241.99 | 22,806.07 | 1.2% | (1.9)% | up | up | up | |
| S&P/TSX Composite | 31,712.76 | 33,817.51 (new highs) * | 2.3% | 6.6% | up | up | up | |
| S&P/TSX Venture (CDNX) | 987.74 | 1,042.56 | 5.1% | 5.6% | up | up | up | |
| S&P 600 (small) | 1,467.76 | 1,604.98 (new highs) * | 0.5% | 9.4% | up | up | up | |
| ACWX MSCI World x US | 67.18 | 74.12 (new highs) * | 1.2% | 10.3% | up | up | up | |
| Bitcoin | 87,576.98 | 67,726.22 | (1.6)% | (22.7)% | down | down | neutral | |
| Gold Mining Stock Indices | ||||||||
| Gold Bugs Index (HUI) | 701.49 | 871.32 | 8.0% | 24.2% | up | up | up | |
| TSX Gold Index (TGD) | 817.76 | 991.79 | 7.4% | 21.3% | up | up | up | |
| % | ||||||||
| U.S. 10-Year Treasury Bond yield | 4.17% | 4.09% | 1.0% | (1.9)% | ||||
| Cdn. 10-Year Bond CGB yield | 3.44% | 3.22% | (1.2)% | (6.4)% | ||||
| Recession Watch Spreads | ||||||||
| U.S. 2-year 10-year Treasury spread | 0.69% | 0.60% | (4.8)% | (13.0)% | ||||
| Cdn 2-year 10-year CGB spread | 0.85% | 0.78% | flat | (8.2)% | ||||
| Currencies | ||||||||
| US$ Index | 98.26 | 97.71 | 0.9% | (0.6)% | neutral | down | down | |
| Canadian $ | 72.87 | 0.7313 | (0.4)% | 0.4% | neutral | up | neutral | |
| Euro | 117.48 | 117.93 | (0.6)% | 0.4% | neutral | up | up | |
| Swiss Franc | 126.21 | 129.99 | (0.2)% | 3.0% | up | up | up | |
| British Pound | 134.78 | 134.95 | (1.1)% | 0.1% | down (weak) | up | up | |
| Japanese Yen | 63.83 | 64.53 | (1.4)% | 1.1% | up (weak) | down | down | |
| Precious Metals | ||||||||
| Gold | 4,311.97 | 5,092.77 | 1.0% | 18.1% | up | up | up | |
| Silver | 71.16 | 83.93 | 8.7% | 18.0% | neutral | up | up | |
| Platinum | 124.81 | 2,171.00 | 5.0% | 6.1% | down (weak) | up | up | |
| Base Metals | ||||||||
| Palladium | 1,619.50 | 1,786.50 | 3.8% | 10.3% | down (weak) | up | up | |
| Copper | 5.64 | 5.86 | 1.2% | 3.9% | neutral | up | up | |
| Energy | ||||||||
| WTI Oil | 57.44 | 66.35 | 5.6% | 15.5% | up | up | down | |
| Nat Gas | 3.71 | 3.04 | (5.0)% | (18.1)% | down | down | neutral | |
__
(Featured image by Julie Ricard via Unsplash)
DISCLAIMER: This article was written by a third party contributor and does not reflect the opinion of Born2Invest, its management, staff or its associates. Please review our disclaimer for more information.
This article may include forward-looking statements. These forward-looking statements generally are identified by the words “believe,” “project,” “estimate,” “become,” “plan,” “will,” and similar expressions, including with regards to potential earnings in the Empire Flippers affiliate program. These forward-looking statements involve known and unknown risks as well as uncertainties, including those discussed in the following cautionary statements and elsewhere in this article and on this site. Although the Company may believe that its expectations are based on reasonable assumptions, the actual results that the Company may achieve may differ materially from any forward-looking statements, which reflect the opinions of the management of the Company only as of the date hereof. Additionally, please make sure to read these important disclosures.
Copyright David Chapman 2026
David Chapman is not a registered advisory service and is not an exempt market dealer (EMD) nor a licensed financial advisor. He does not and cannot give individualised market advice. David Chapman has worked in the financial industry for over 40 years including large financial corporations, banks, and investment dealers. The information in this newsletter is intended only for informational and educational purposes. It should not be construed as an offer, a solicitation of an offer or sale of any security. Every effort is made to provide accurate and complete information.
However, we cannot guarantee that there will be no errors. We make no claims, promises or guarantees about the accuracy, completeness, or adequacy of the contents of this commentary and expressly disclaim liability for errors and omissions in the contents of this commentary. David Chapman will always use his best efforts to ensure the accuracy and timeliness of all information. The reader assumes all risk when trading in securities and David Chapman advises consulting a licensed professional financial advisor or portfolio manager such as Enriched Investing Incorporated before proceeding with any trade or idea presented in this newsletter.
David Chapman may own shares in companies mentioned in this newsletter. Before making an investment, prospective investors should review each security’s offering documents which summarize the objectives, fees, expenses and associated risks. Although Artificial Intelligence (AI) may be deployed from time to time, AI output is monitored and adjusted, if necessary, for accuracy. David Chapman shares his ideas and opinions for informational and educational purposes only and expects the reader to perform due diligence before considering a position in any security. That includes consulting with your own licensed professional financial advisor such as Enriched Investing Incorporated. Performance is not guaranteed, values change frequently, and past performance may not be repeated.


The TopRanked.io Weekly Digest: What’s Hot in Affiliate Marketing [LiveChat Affiliates Review]
Quick Disclosure: We’re about to tell you how LiveChat Affiliates run a top-notch affiliate program. And we really mean it....


German SMEs Face Tighter Bank Lending, Turn to Alternatives
Access to bank loans for German SMEs is tightening despite strong financing needs. About 37.8 percent face restrictive lending, driven...


Bitcoin Stalls as Geopolitical Risks and Crypto Industry Tensions Persist
Bitcoin is moving sideways near $72,000 amid ongoing Iran tensions, while ETF inflows remain strong. Quantum security debates continue. Ethereum...


Geopolitical Tensions and Trade Disruptions Reshape Global Commodities Markets
Geopolitical tensions and disrupted trade routes, especially around the Strait of Hormuz, are reshaping global commodities markets. Agriculture faces supply...


Germany Sees 413 Cannabis Cultivation Clubs Two Years After Partial Legalization
Two years after partial cannabis legalization in Germany, 413 cultivation clubs have been established nationwide. Lower Saxony leads in clubs...
 |
|
 |  |
 |
|
-

 Markets4 days ago
Global Coffee Market Faces Price Drops Amid Strong Supply and Export Challenges
-

 Markets2 weeks ago
Dow Jones Tests Correction Zone Amid Bullish Momentum and Bubble Concerns
-

 Crowdfunding2 days ago
Argentina Introduces Automatic Authorization to Boost Crowdfunding and Investment Growth
-

 Crowdfunding1 week ago
Democratizing Farmland Investment: The Rise of Farm Fractions in Agritech