Markets
DJI and SPX in Focus: 2024 Still Promises To Be a Year of Turmoil
The DJI and SPX both made new all-time highs this past week. No other index unless you count the NY FANG Index that helped take the NASDAQ to new 52-week highs. But indicators continue to roll over with negative divergences. Dow Theory continues to support the sharp divergence between the DJI and DJT. EU indices fell and China was also down, but Japan keeps rising.
We are now over halfway through the month of January and the January barometer is pointing up. Naturally, it is too early to tell whether January will be an up month, as signs continue that the markets are tipping over with numerous negative divergences, Dow Theory non-confirmations, and extremely overbought indicators. The odds still favour a sell-off that could be irregular into month end. Wars are continuing and new ones are flaring up.
The U.S. election year chaos is underway with a solid win by former president Donald Trump in the Iowa caucus, almost ensuring he will be the Republican candidate. The divide in the U.S. is as big as ever. The big election date is Super Tuesday, March 5, when something like 15 caucuses and primaries take place. It will be a busy year. And a potentially volatile one.
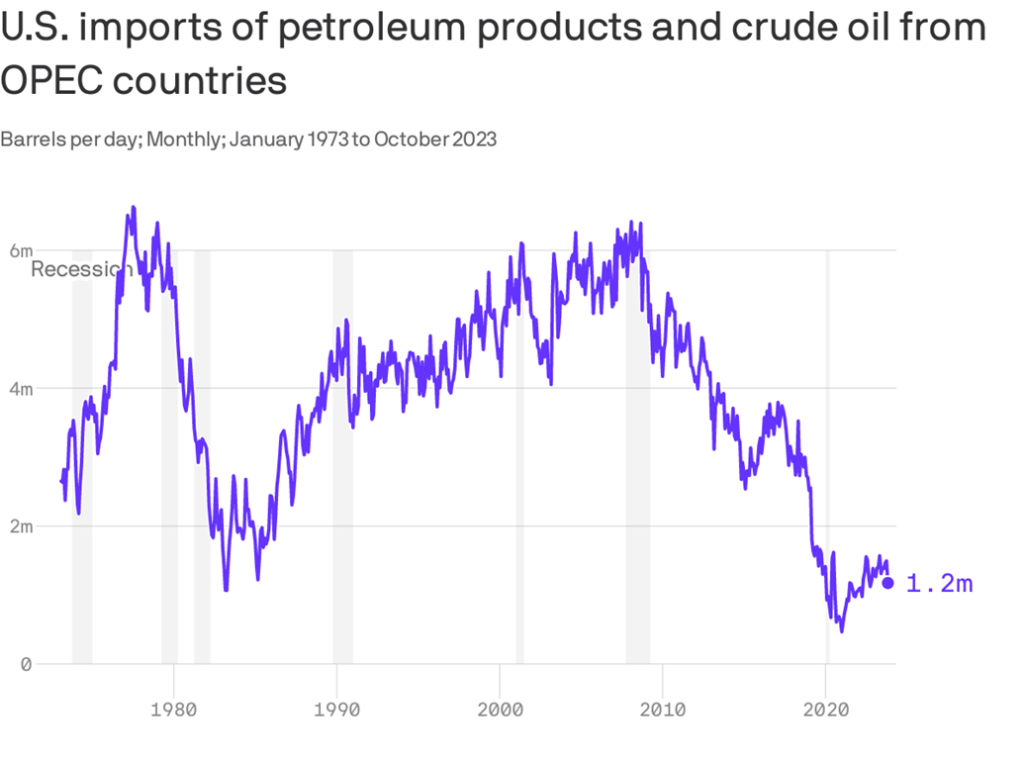
WTI oil prices have fallen 16% since the October 7, 2023 Hamas attack. Brent crude is down 11.7%. All that despite an escalation in the wars, particularly in the Red Sea/Straits of Bab-El-Mandeb vs. the Houthis that is starting to negatively impact world trade. Despite the goings-on in the Red Sea, oil prices have not responded. Seems one of the reasons is there is lots of oil. In a recent article from Axios (www.axios.com), they noted that the U.S. is not as dependent on OPEC, given the U.S. is the world’s largest producer of oil.
Yes, the U.S. produces over 13 million barrels per day, even as they consume almost 20 million barrels per day. But they get a lot less from the Middle East OPEC countries than they used to. Back in the 1970s, it was upwards of 70%, but today it is around 15%. Benefitting from that have been Canada, Brazil, and Guyana, amongst others. Too many OPEC countries are ones that the U.S. has frosty relations with, such as Iran, but even today the relationship with Saudi Arabia is not what it used to be.
OPEC has shifted its operations to providing China and other Asian nations. Russia is member of OPEC + and has shifted its focus eastward to China and Asia as well to avoid U.S. sanctions. Meanwhile, both the EU economy led by Germany and the Chinese economy have not been as robust as they once were. The EU is falling into recession.
However, low oil prices may not stay at these levels forever. The attacks in the Red Sea/Straits of Bab-El-Mandeb are becoming highly disruptive. The impact on the global economy may not be showing yet, but the odds are good it soon will be. The biggest problem is supply disruption as ships are forced at considerably greater cost and time to go around the Cape of Good Hope. CEOs of shipping companies have warned that this disruption could last weeks or months.
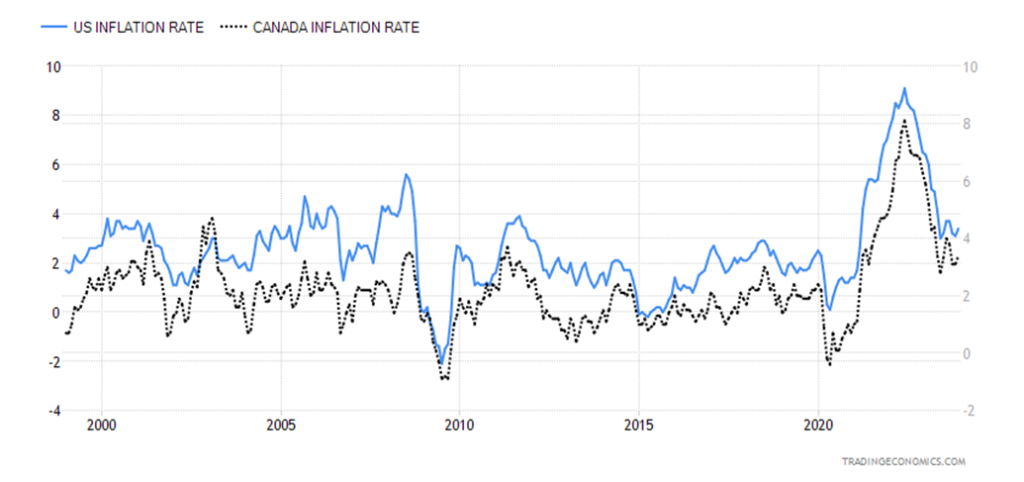
Supply disruption eventually translates into higher inflation. After falling from the June 2022 inflation high in both the U.S. and Canada, inflation ticked up in December. No, it is not yet clear that we are starting a new rise, but there is a good chance we may have seen the low. It’s not just the goings-on in the Red Sea that are a problem. Global trade is also being disrupted through the Panama Canal with a severe drought, and risks may be rising in the Persian Gulf/Straits of Hormuz, given Iranian proxy attacks on U.S. bases and consulates in Iraq and Syria. Blockage of the Straits of Hormuz could send oil prices soaring.
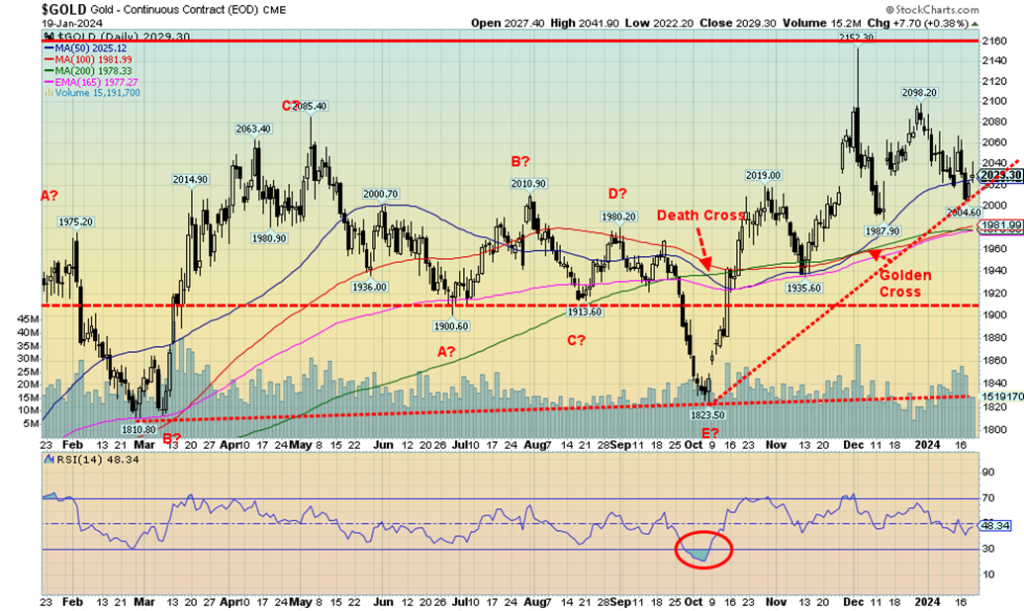
Oil has received a collective yawn (so far), but did gold? Usually, when geopolitical events get out of hand, gold rises. Gold did. After October 7, gold soared from $1,845 and peaked at $2,152 by December 4. Since then, gold has been on the skids, but is still up almost 9% from October 7. So far, all gold seems to be showing is that this is a correction to a run-up from October 7 to December 4.
Interestingly, we took a look at yearly lows for gold and discovered that gold has an interesting record of making a yearly low in the December, January, and February period. That period saw 20 of the yearly lows almost 48% of the yearly lows from 1981–2023. What usually followed was a good up year for gold when they made a low during that period. Only July saw no yearly lows for gold. Will lightning strike again for gold during this period? In 2023 the yearly low was made in February.
Inflation Rate U.S., Canada 1999–2023
The Month Gold Makes its Yearly Low 1981–2023
| Month | Number Yearly Lows | Month | Number of Yearly Lows |
| January | 8 | July | 0 |
| February | 7 | August | 4 |
| March | 4 | September | 2 |
| April | 2 | October | 2 |
| May | 3 | November | 3 |
| June | 2 | December | 5 |
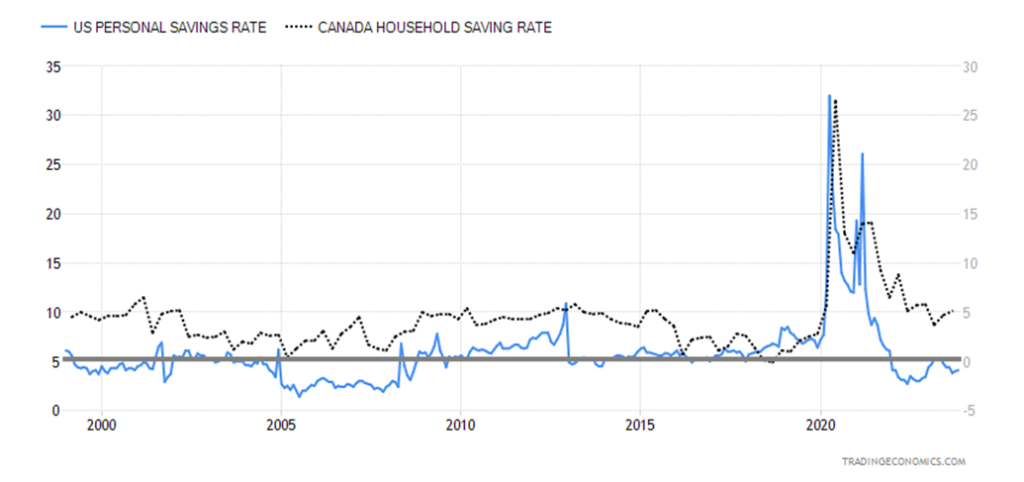
Overall, the consumer appears not to be in as bad a shape as one might think. Yes, savings rates have come down since the pandemic peak, but they are only down at levels largely seen throughout the 2000s and Canada’s savings rate remains elevated, compared to where it has been over the past 25 years.
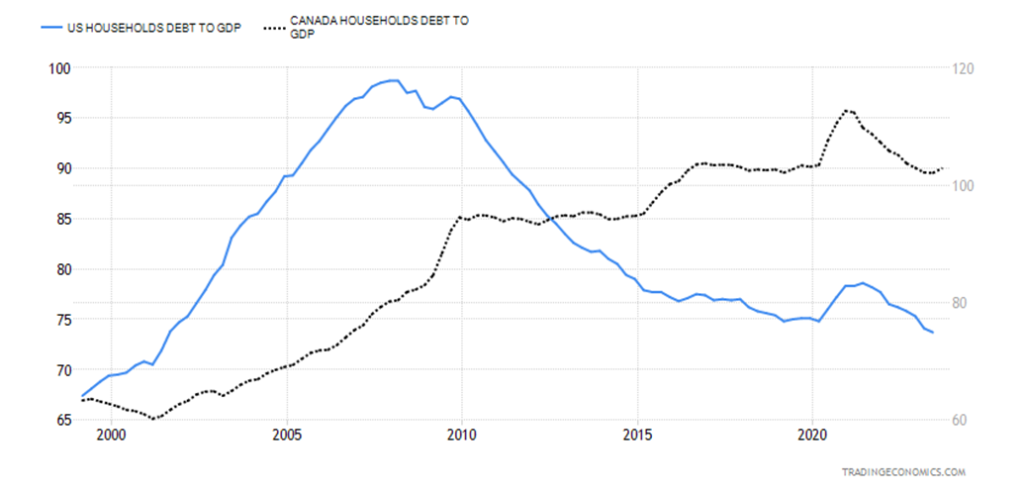
Employment is starting to wobble as we are seeing more layoffs and loan delinquencies and bankruptcies are rising. While household debt to GDP remains dangerously elevated in Canada, in the U.S. it is lower today than where it was before the financial crisis of 2008. Housing prices that soared following the huge surge in money as a result of the pandemic have started to come down. Once prices start to fall, that tends to feed on itself as distressed sales and defaults rise. That in turn could put pressure on the savings rate as more have to draw on savings.
Household Savings Rate U.S., Canada 1999–2023
However, the biggest risks we see going forward in 2024 are twofold. 1. The threat of war—not just Russia/Ukraine and Israel/Gaza/Hamas, but the increasing risk of escalation elsewhere. There are rising fears that the Israeli conflict will spread to Lebanon/Hezbollah, and increased risk of further escalation in the Red Sea between the U.S./U.K. and the Houthis.
As well, the constant attacks against the U.S. in Syria and Iraq could lead to wider conflict; Israel has attacked Iranian sites in Syria potentially opening another front; a new conflict front may be opening between Pakistan/Iran; there is an increase in Chinese patrols and military exercises in the Straits of Taiwan after the recent Taiwan election that elected an anti-China president; and North Korea is firing more missiles and threatening South Korea and Japan. 2. The growing divide in the U.S., which threatens the November election.
As well, another Republican speaker is under fire for co-operating with the Democrats; there is turmoil on the Texas/Mexico border over illegal immigrants where there have been near clashes between federal border agents and the Texas National Guard; and there are the ongoing political fights over funding of the government that could still lead to a shutdown—plus many other areas of conflict. The internal divides and domestic political strife is not limited to the U.S. as similar divides are being seen in the EU and even in Canada.
And dare we mention the negative impacts of extreme weather events that could cause supply disruptions and more.
Household Debt to GDP U.S., Canada 1999–2023
All these negative events could drive supply disruptions, which is inflationary. War is inflationary. It all suggests that the odds of inflation coming down further are most likely slim. Yet the global economy is also slowing and recession concerns remain.
Throwing more money at the problems is also inflationary as we saw as a result of the massive growth in money to prevent a collapse during the pandemic. The result—potential stagflation or “slugflation”, as some are calling it. Ultimately, all that is positive for gold.
CPI, M1, Gold – 1949–2024
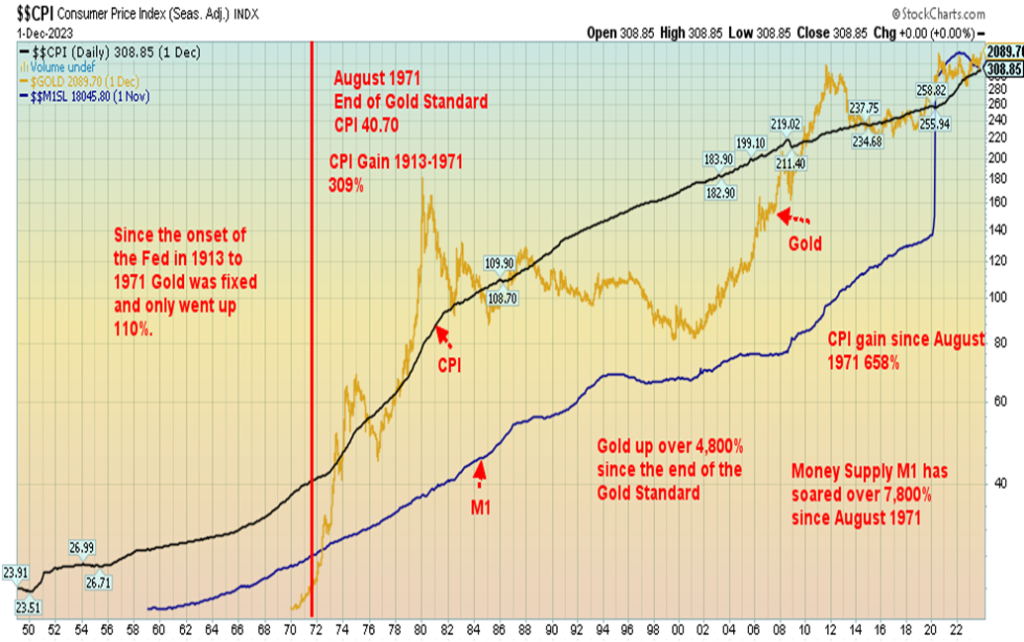
Chart of the Week
When it comes to the metals, copper is often overlooked. Yet it is the 25th most abundant element on earth. And often, if you find copper, you also find gold, silver, and iron. Copper is used in a host of things, including electric generators, households/cars for electric wiring, wires in appliances, computers, lights, motors, telephone cables, radios, TVs, and, of late, EV cars and trucks and green energy.
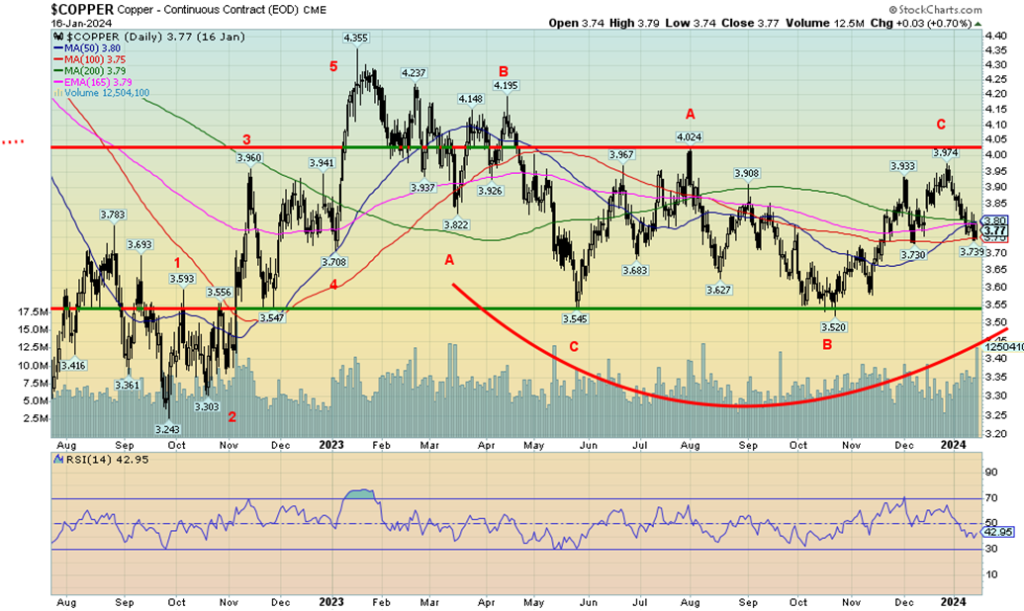
Add in as well nuclear plants that are quickly becoming a solution for green energy. Not only will those plants need uranium but also copper, lots of it. A combination of supply squeezes and increased demand, particularly out of China, could send copper prices a lot higher. Our daily chart above of copper over the past year suggests that copper has been going through a lengthy corrective phase that may soon be coming to an end.
In 2022 (the latest we could find figures for), some 22 million metric tonnes of copper were produced. Yet it is not unusual to find that demand actually exceeds supply. In 2021, some 25 million metric tonnes of copper were consumed. The world’s largest producer of copper is Chile, who produced some 5.2 million metric tonnes in 2022.
The second largest producer is Peru with 2.2 million metric tonnes, followed by the Democratic Republic of Congo, also with 2.2 million metric tonnes. The U.S. produced 1.3 million metric tonnes and is fifth, while Canada is well down the list, producing 530 thousand metric tonnes.
In terms of reserves, Chile once again leads with some 23% of the global supply. Australia holds 11% and Peru 9%. Global reserves are estimated at 890 million metric tonnes. Number four and five positions are occupied by Russia and Mexico. The largest user of copper in 2022 was China with 8.7 million metric tonnes. The EU and U.K. combined for a distant second at 2.1 million metric tonnes and North America was third at 1.4 million metric tonnes.
In terms of company production, the world’s largest producer was Codelco of Chile. It is a state-owned mining company. Number two is Freeport McMoran (FCX) in the U.S., followed by the BHP Group of Australia (BHP). BHP Group is, however, the largest company by market cap with one of $152.8 billion. Rio Tinto (RIO) is number two at $111.0 billion while China Shenhua Energy is number three at $90.4 billion. All three mine more than just copper.
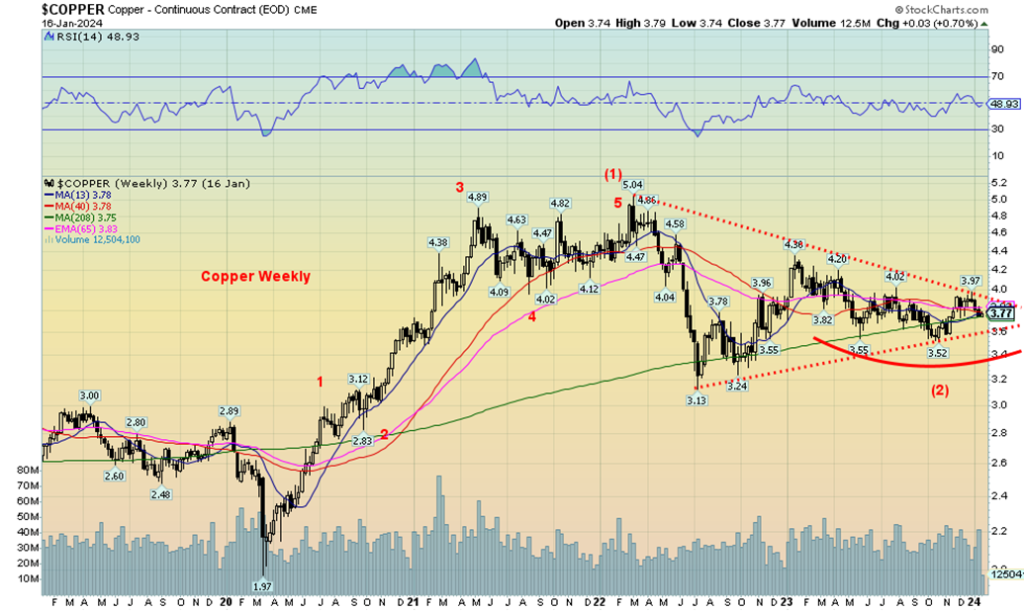
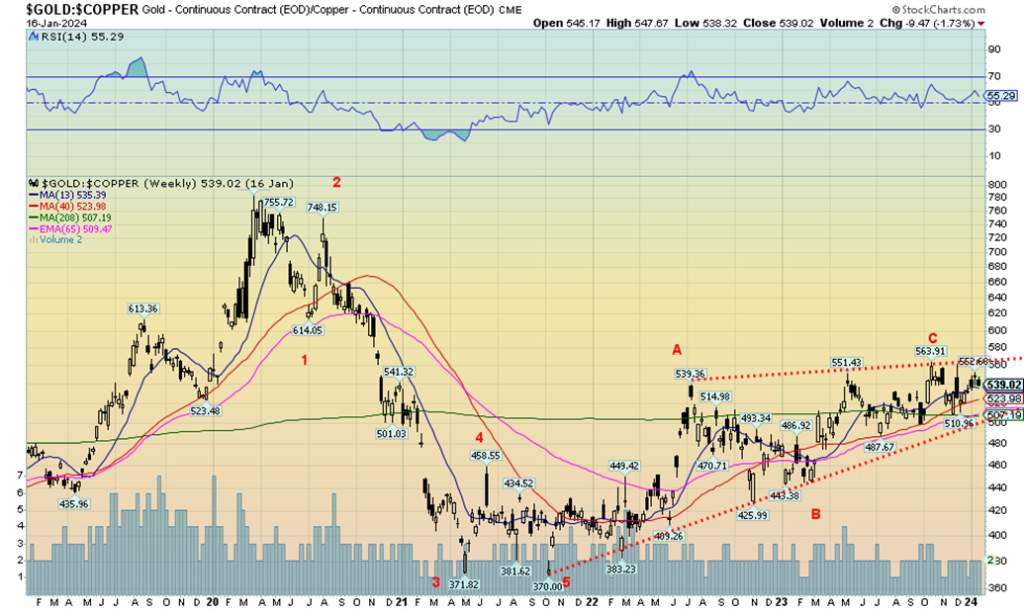
As we noted, copper prices have been going through what appears to be a lengthy corrective phase. That suggests a sideways trend over the past several months. Sideway trends are not unusual and usually the market is fairly neutral. It makes it hard to read which way it will break but, given we came off a high, the odds would seem to favor a breakout to the upside for a possible C wave up. The weekly chart suggests the same, only instead of a sideways pattern it appears as a potential consolidation symmetrical triangle. There appear to have been five waves up from that absolute low of $1.97 at the height of the pandemic crash. That topped in 2022 at $5.04 and since then we have been correcting.
Again, we should break in the direction of the former trend, which was up. The sideways pattern breaks out at around $4.05 and suggests a move to at least $4.55. The symmetrical triangle on the weekly chart breaks out at around $3.95 and suggests a move to at least $6.35. As to a breakdown point, we wouldn’t want to see copper under $3.50 and definitely not under the 2022 low of $3.13.
Our final chart below shows the gold/copper ratio. This ratio is often followed by technical market analysts who are watching for the trends of gold. Plus, gold and copper have a close relation in the earth so it makes perfect sense. In ancient times, coins were made of gold, silver, and bronze with bronze being mostly about 90% copper and 10% tin. Bronze is quite durable and not only do coins still exist but also bronze works of art and other artifacts. The gold/copper ratio appears as a potential rising triangle that appears to suggest that, going forward, gold should outpace copper. So, if copper is going up, gold will go up more. Our colleague Mike Ballanger of GGM Advisory has been touting copper as the potential number one play of 2024. Copper with gold as well are both pointing up. The question, of course, is when does it break out? The patterns suggest we could be nearing the end.
Markets & Trends
| % Gains (Losses) Trends | ||||||||
| Close Dec 31/23 | Close Jan 19, 2024 | Week | YTD | Daily (Short Term) | Weekly (Intermediate) | Monthly (Long Term) | ||
| Stock Market Indices | ||||||||
| S&P 500 | 4,769.83 | 4,839.81 (new highs)* | 1.2% | 1.5% | up | up | up | |
| Dow Jones Industrials | 37,689.54 | 37,863.80 (new highs)* | 0.7% | 0.5% | up | up | up | |
| Dow Jones Transport | 15,898.85 | 15,592.34 | 0.8% | (1.9)% | up | up | up | |
| NASDAQ | 15,011.35 | 15,310.97 (new highs) | 2.3% | 2.0% | up | up | up | |
| S&P/TSX Composite | 20,958.54 | 20,906.52 | (0.4)% | (0.3)% | up | up | up | |
| S&P/TSX Venture (CDNX) | 552.90 | 552.33 | (0.7)% | (0.1)% | up | down (weak) | down | |
| S&P 600 (small) | 1,318.26 | 1,270.34 | flat | (3.6)% | up | up | up (weak) | |
| MSCI World | 2,260.96 | 2,189.83 | (1.5)% | (3.2)% | up | up | up (weak) | |
| Bitcoin | 41,987.29 | 41,586.56 | (4.7)% | (0.1)% | up | up | up | |
| Gold Mining Stock Indices | ||||||||
| Gold Bugs Index (HUI) | 243.31 | 218.53 | (6.3)% | (10.2)% | down | down | down | |
| TSX Gold Index (TGD) | 284.56 | 258.23 | (6.1)% | (9.3)% | down | down | down | |
| % | ||||||||
| U.S. 10-Year Treasury Bond yield | 3.87% | 4.13% | 4.8% | 6.7% | ||||
| Cdn. 10-Year Bond CGB yield | 3.11% | 3.50% | 8.4% | 12.5% | ||||
| Recession Watch Spreads | ||||||||
| U.S. 2-year 10-year Treasury spread | (0.38)% | (0.26)% | (23.8)% | 31.6% | ||||
| Cdn 2-year 10-year CGB spread | (0.78)% | (0.60)% | (5.3)% | 23.1% | ||||
| Currencies | ||||||||
| US$ Index | 101.03 | 103.25 | 0.8% | 2.2% | up | neutral | up (weak) | |
| Canadian $ | 75.60 | 74.49 | (0.3)% | (1.5)% | neutral | neutral | down | |
| Euro | 110.36 | 108.95 | (0.5)% | (1.3)% | down (weak) | neutral | down (weak) | |
| Swiss Franc | 118.84 | 115.20 | (1.8)% | (3.1)% | down (weak) | up | up | |
| British Pound | 127.31 | 127.03 | (0.4)% | (0.2)% | up (weak) | up (weak) | neutral | |
| Japanese Yen | 70.91 | 67.52 | (2.2)% | (4.8)% | down | down | down | |
| Precious Metals | ||||||||
| Gold | 2,071.80 | 2,029.30 | (1.1)% | (2.1)% | down (weak) | up | up | |
| Silver | 24.09 | 22.71 | (2.7)% | (5.7)% | down | down | neutral | |
| Platinum | 1,023.20 | 907.00 | (1.5)% | (11.4)% | down | down | down | |
| Base Metals | ||||||||
| Palladium | 1,140.20 | 948.70 | (3.1)% | (16.8)% | down | down | down | |
| Copper | 3.89 | 3.79 | 1.3% | (2.6)% | down | neutral | down (weak) | |
| Energy | ||||||||
| WTI Oil | 71.70 | 73.25 | 0.8% | 2.1% | neutral | down | neutral | |
| Nat Gas | 2.56 | 2.25 | (32.0)% | (12.1)% | down | down (weak) | down | |
New highs/lows refer to new 52-week highs/lows and, in some cases, all-time highs.
- * New All-Time Highs
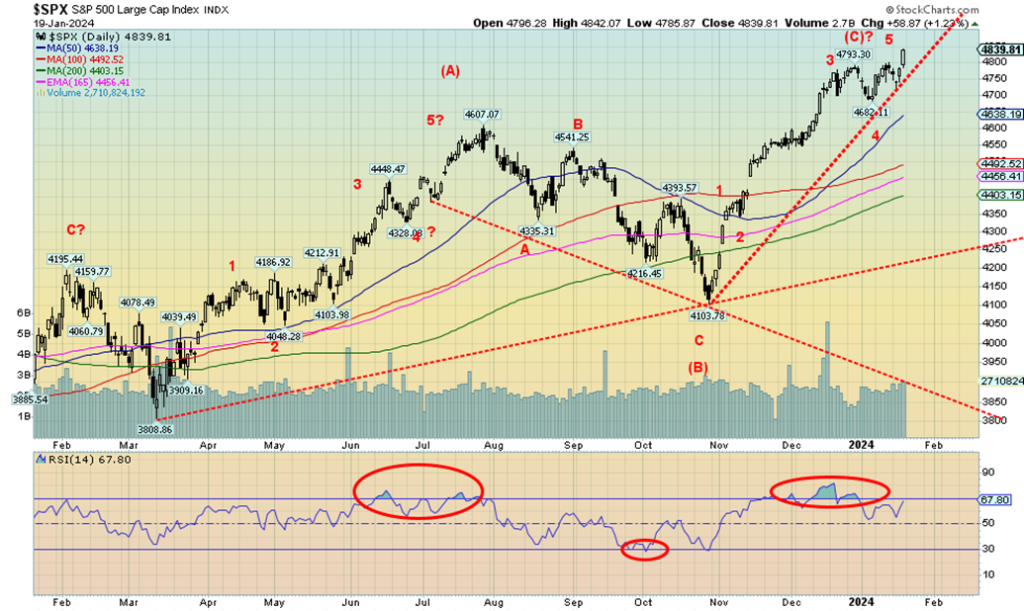
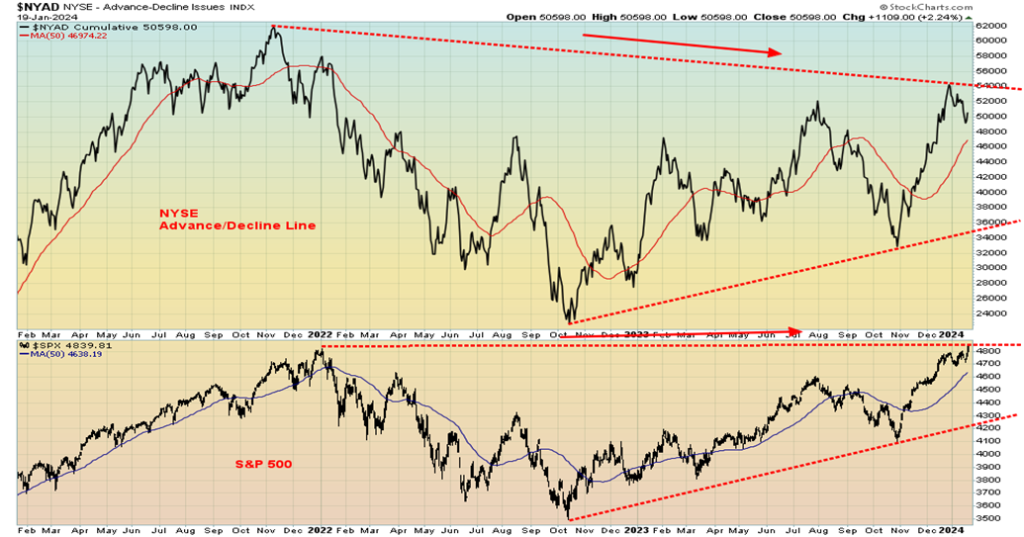
The S&P 500 (SPX) did it. Yes, the SPX joined the Dow Jones Industrials (DJI) and made new all-time highs this past week, hitting 4,842 above the January 2022 high of 4,818. No other index is making new all-time highs. Not even the DJI this past week made new all-time highs. A potential divergence? We couldn’t help but notice that the NYSE Advance/Decline line did not make new highs with the indices, so that might be another potential divergence.
On the week, the SPX was up 1.2% the DJI gained 0.7%, the Dow Jones Transportations (DJT) was up 0.8% and the NASDAQ gained 2.3% to fresh 52-week highs. It was all led by the NY FANG Index, up 2.7% to new all-time highs. The junior indices struggled as the S&P 400 (Mid) gained 0.5% but the S&P 600 (Small) was flat on the week.
The DJT continues its significant divergence with the DJI. While the DJI makes new all-time highs, the DJT is down 14.5% from its all-time high seen in November 2021. The DJT is also down 6.7% from its 2023 high. For the DJT, a breakdown under 15,000 could spell big trouble. Bitcoin may have topped with the ETF as it fell 4.7%, back to 41,500 after being as high as 49,000. Bitcoin is now down over 15% from that high.
In Canada, the TSX Composite did not join the party, falling 0.4%, while the TSX Venture Exchange (CDNX) was off 0.7%. The EU didn’t fare well, another divergence, with the London FTSE down 2.1%, the Paris CAC 40 off 1.3%, and the German DAX down 0.9%. The EuroNext was down 0.8%. The EU is slowly sliding into recession, well ahead of the U.S. In Asia, China’s Shanghai Index (SSEC) continues to struggle, falling 1.7%. Tokyo’s Nikkei
Dow Index continues to be a star, up 2.1% to new 52-week highs. Seems that 1990 high is getting closer. Hong Kong, however, is a mess as the Hang Seng (HSI) fell 5.8% and is down 10.2% in 2024 so far. The MSCI World Index was down 1.5%.
If you were trading on the U.S. indices, you had a good week once again. But if you were trading in the EU and China and especially Hong Kong, you were not having a good time. A divergence? We note divergences because they signal to us that something is amiss. With the indices up again this week, the January barometer is pointed up and that signals a good year (according to theory). But the month still has about two weeks to run. So, anything can happen.
The SPX breaks down first under 4,700. Under 4,680 a top is confirmed. That could also give us a weekly sell signal. The bigger picture monthly breakdown doesn’t happen until under 4,100. And under 3,790 we get a yearly sell signal. As to higher levels, a target could be 5,200 where the current wave up equals the wave up from October 2022 to the peak in July 2023 before a correction set in.
The four-year cycle low is due from March 2023 to March 2025. Maybe the October 2023 low satisfies that cycle low. The 6.5-year cycle low is due March 2025 to March 2028 and the 18-year cycle is due March 2024 to March 2030. The March 2009 low was an historic 72-year cycle low. So, we are in a new long-term up cycle and the lows of March 2009 are not in any danger of being surpassed. But that can’t eliminate a potential 50% correction if things go wrong to satisfy the next 18-year cycle low.
The trend is up, but divergences are mounting and the background is becoming less friendly.
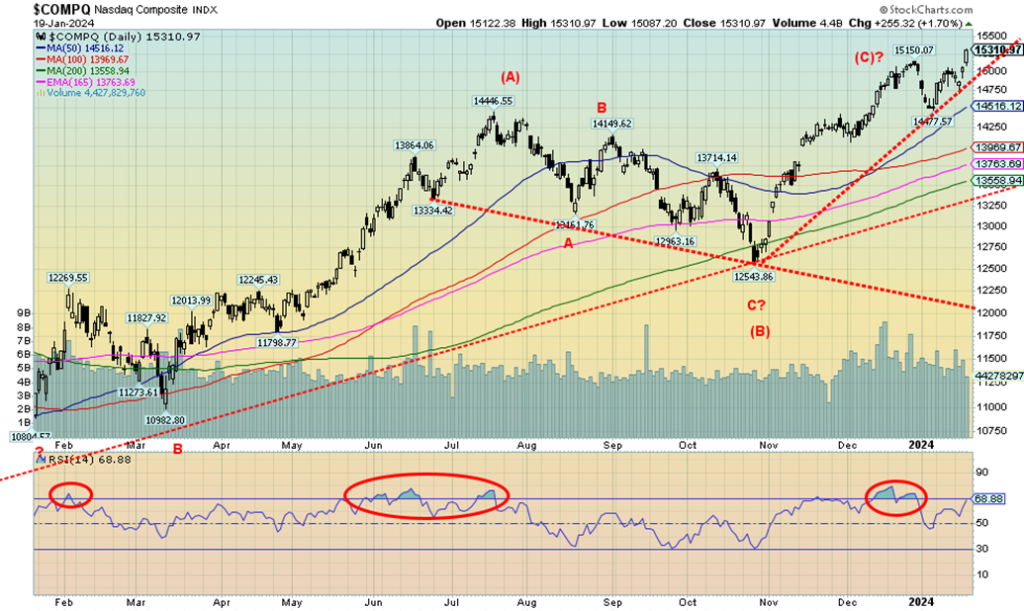
The NASDAQ joined the new highs this past week with a jump of 2.3%. It was, of course, led by the FAANGs as the NY FANG Index was up 2.7% to new all-time highs. The NASDAQ did not make new all-time highs and remains down 5.6% from its November 2021 all-time high. The FAANGs did see new all-time highs. Making new all-time highs were Meta (Facebook), Microsoft, Nvidia, Advanced Micro (AMD), and Broadcom. But not all FAANGs were up on the week.
Tesla fell 3.1% and the Chinese FAANGs were down again, with Baidu off 5.9% and Alibaba down 3.4%. Netflix fell 1.9%. The big winner on the week was AMD, up 18.9%, while Nvidia gained 8.7%. The FAANGs, AI, and tech are still the big winners and that’s all the talking heads at CNBC converse about. We won’t consider the NASDAQ making a high until we are back under 14,750. Better still would be break of 14,775. Under 14,500, a more significant top may be in. But, for the interim, the trend is up and the old highs loom. However, indicators are diverging, so committing new funds at this stage could be iffy.
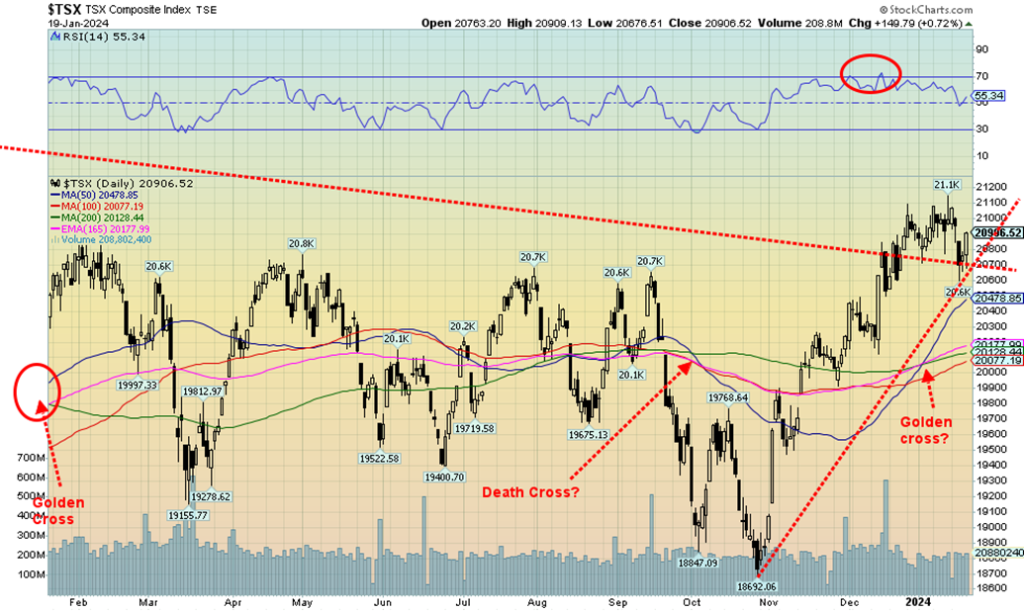
Thanks to a poor week for the commodity sector, the TSX Composite did not keep up with its U.S. brethren. The TSX Composite fell 0.4% this past week and remains below recent highs. The junior TSX Venture Exchange (CDNX) was also off by 0.7%. Both indices are now negative on the year with the TSX down 0.3% and the CDNX off 0.1%. The blue-chip TSX 60 fell 0.3% and is down 0.2% on the year. Five of the 14 sub-indices were down on the week, led by Golds (TGD), down 6.1%. Metals & Mining (TGM) fell 4.6% while Energy (TEN) dropped 4.3%. Materials (TMT) fell 4.5%. Not a good week for them. Of the winners, Consumer Staples (TCS) stood out, up 2.8% and new 52-week highs. Industrials (TIN) also hit new highs, up 1.0%.
The only other sub-index up over 1% was Telecommunications (TTS), up 1.4%. Telecommunications, a loser from 2023, is looking intriguing. Buy BCE? Pays a good dividend with a yield of 6.9%, and is down almost 16% from its all-time high. But it is now breaking out over its 200-day MA. No other sub-index was up over 1%. We continue to leave that old trendline in from the highs as the TSX has never really steamed over it. So, a drop a back under it and especially under 20,600 could signal that a top is in. The question is, what will break the index? We continue to like the commodity sector (golds, metals, energy) into 2024, despite their poor start.
U.S. 10-year Treasury Bond/Canadian 10-year Government Bond (CGB)
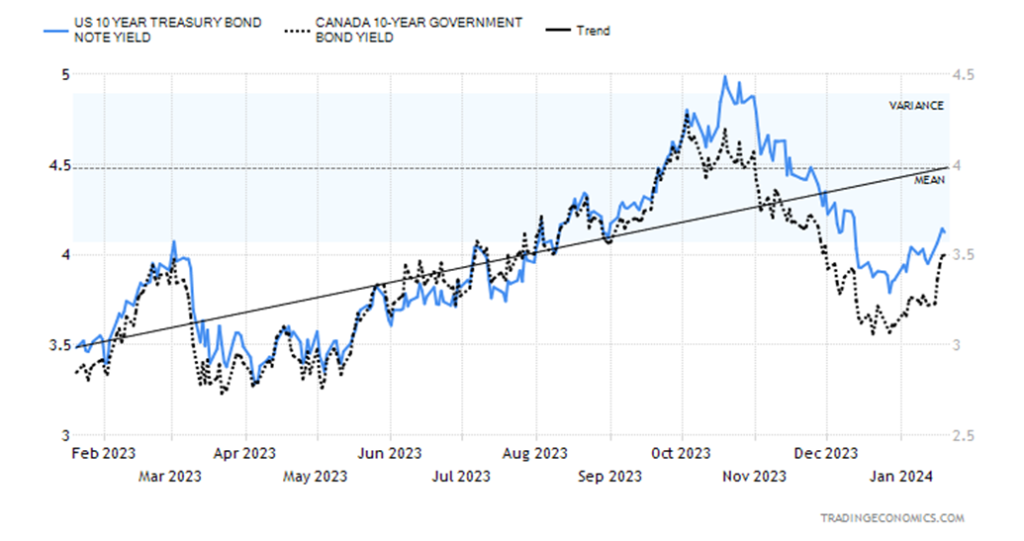
With an uptick in inflation and an uptick in economic indicators, the U.S. 10-year treasury note jumped back over 4.00%, hitting a high of 4.15% before settling back to 4.13%. It was a bit of a surprise for many. It didn’t help that Fed officials were talking hawkish and the odds of a rate cut in March were fading like the melting of snow in March. Canada, too, saw the Government of Canada 10-year bond (CGB) jump to 3.50%, up from 3.23% only a week earlier. Economic surprises came with retail sales up 0.6% in December vs. an expected 0.3% and year-over-year (y-o-y) up 5.6% vs. the expected 4.0%.
Weekly jobless claims shocked at 187,000 when they were expected to be 205,000 vs. last weeks 203,000. Although continuing claims were lower at 1,806 thousand vs. 1,832 thousand last week. We note the University of Michigan Consumer Sentiment Index next that also came in higher than expected. Not everything was rosy as the NY Empire State Manufacturing Index was negative 43.7 vs. last month’s negative 14.5 and the expected negative 9.0.
Industrial production, however, was up 1% in December vs. negative 0.6% in November and an expected negative 0.1%. Existing home sales slowed to 3.78 million vs. 3.82 million and an expected 3.83 million. In Canada, the CPI rose 3.6% vs. an expected 3.4% and the previous month’s 3.6%. Canada’s retail sales were also up 1.8% y-o-y vs. an expected rise of 0.8%.
Interest rate differentials also help as money flows out of the EU/UK/Japan/China to safety in the U.S. This coming week we get new home sales, house prices, durable goods, and PCE prices. Watch the latter number as that is one the Fed follows. In Canada, we get the Bank of Canada (BofC) interest rate decision, which is expected to be unchanged.
Michigan Consumer Sentiment, Michigan Consumer Expectations 1999–2024
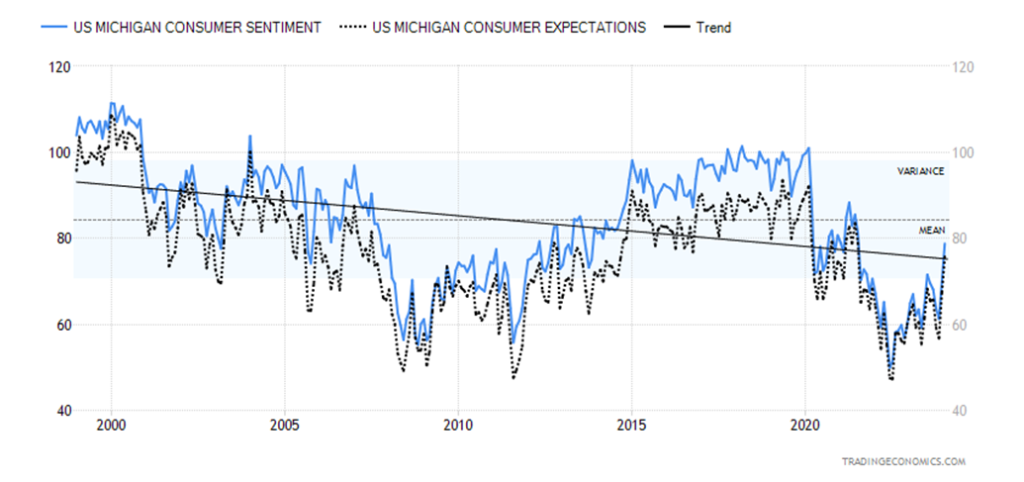
The unexpected jump in the Michigan Consumer Sentiment Index may have been the biggest economic surprise of the week. Wars, a divided America, rising layoffs, interest rates remaining high—who cares? The consumer is still happy with money in the bank, job losses are someone else’s problem, and inflation is coming down.
This past week, the University of Michigan Consumer Sentiment Index soared to 78.8%, the highest level seen since July 2021. The market had expected only 70%. The December reading was 69.7%. That’s way off the lows seen in 2022 under 50%. In Canada, consumer sentiment also improved to 49.5% from 46.6%. As well, the Michigan Consumer Expectations improved to 75.9% from 67.4%. Two months ago, it was at 56.8%. That’s a big jump.
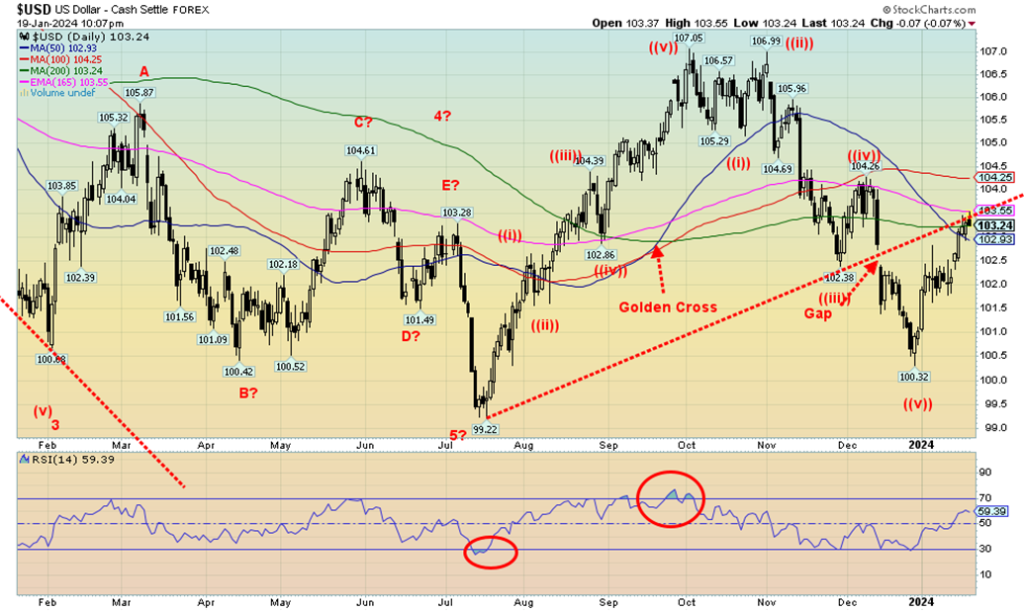
Up, up, and, well, not quite away. The US$ Index continued its recent climb, the events in the Red Sea helped send more funds over the U.S., and stronger than expected economic numbers helped support thoughts that high interest rates are here to stay. U.S. interest rates are decidedly higher than elsewhere. Three-month treasury bills in the U.S. are at 5.40%. In the eurozone the 3-month is 3.93%, in Canada it’s 5.03%, in Germany 3.84%, in the U.K. 5.26%, and in Japan negative 0.19%. Interest rates generally favour the U.S. over everywhere else.
As well, driving the US$ Index are stronger than expected economic data and hawkish statements from Fed officials. The odds of a rate cut in March are collapsing. On the week, the US$ Index was up 0.8%, the euro fell 0.5%, the Swiss franc was down 1.8%, the pound sterling dropped 0.4%, and the Japanese yen fell 2.2%. The Cdn$ dropped 0.3%. Right now, the U.S. dollar reigns. But it is also at a potentially good resistance zone, having rallied back to that former trendline before the gap down December.
But a break now over 103.60 could send the US$ Index higher towards key resistance at 104.25. We do appear to have fallen in five waves from that high back in September 2023 at 107.05, so we view this as a correction to that drop. A Fibonacci 61.8% retracement level can be found at 104.48, so a run towards that level would not surprise. Over 105.50, new highs are probable. Right now, we need to retreat back under 102 to suggest to us that a high is in. A stronger US$ Index weighs on gold prices.
The gold bugs did not have a good time this past week. Gold fell 1.1% and is now down 2.1% in 2024. An inauspicious start. Silver fell 2.7%, while platinum dropped 1.5% and is now down 11.4% in 2024. The near precious metals also did not fare well—okay, mixed. Palladium dropped 3.1% and is down 16.8% so far in 2024. But copper, featured in our chart of the week, rose 1.3% but is still down 3.1% in 2024. We’ll take our positives.
The unpleasant week was driven by a strong US$ Index, better than expected economic numbers, rising bond yields, and hawkish Fed members. Global conflicts were largely ignored. The only good news is gold is holding above $2,000 for now. On the economic front, retail sales were stronger than expected.
Consumer sentiment was stronger than expected and the weekly jobless claims came in much lower than expected, suggesting that, no matter how many layoffs are announced, the labour market is still strong. All that caused the U.S. dollar to rise, bond yields to rise, and Fed members make hawkish statements. The odds of a March rate cut are disappearing rapidly, if they were ever there. With little sign of a recession on the horizon, the pressure to at least maintain high interest rates remains.
The one consolation is that, as we noted in our opener, gold has some history of making yearly lows in the December, January, February period. Still, February doesn’t end for another month and half. And we can’t say we have made a low. We tested down to $2,000 this week and, so far, it has held. Better support can be seen at the confluence of the 100- and 200-day Mas, as well as the 165-day EMA, all between $1,970 and $1,980. That could still be a target zone. If we broke under $1,970 the next major stop could be $1,950.
To the upside, $2,100 remains elusive, but it is essential to overhaul that level if we are to see new highs above $2,152. We’d need to see a close above $2,120 to suggest new highs above $2,152. The commercial COT is no help as it is at 25.7%. That’s not horrible, but we’d like to see that at least over 30%.
None of this has stopped the gold bugs, who continue to pump out targets for gold of $2,500, $5,000, and $10,000. No, we are not denying that could happen, but only under the right conditions. And we are not there yet. Gold, silver, and gold stocks are not the topics of the talking heads, either. Nvidia is more important to talk about than gold. Portfolio managers barely mention the word. Gold—a barbarous relic?
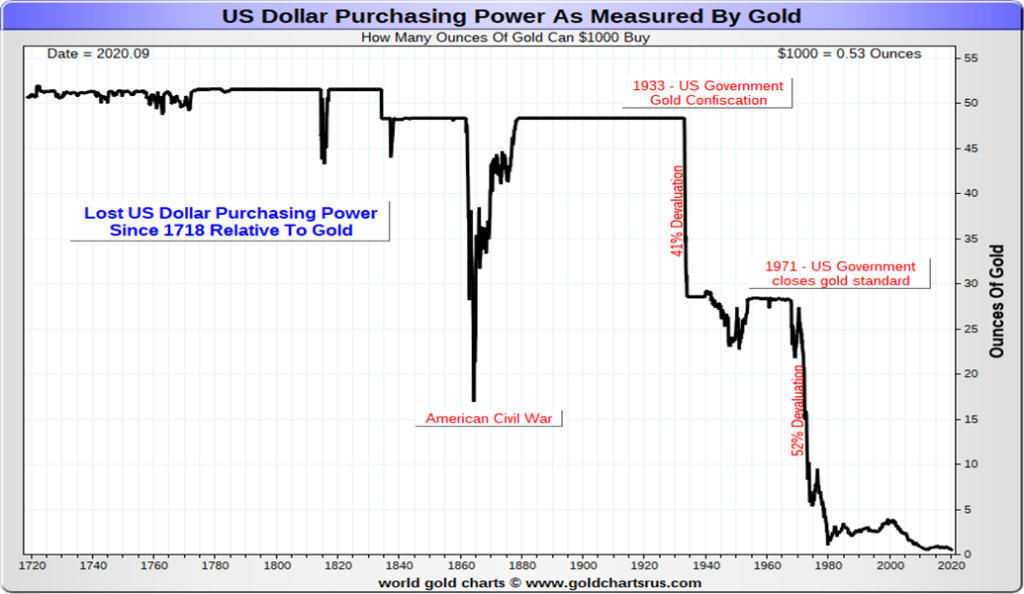
A reminder that gold has been money for over 5,000 years and it has no liability, unlike stocks. The current experiment in fiat currencies is still only 52 years old. That’s young. History shows that fiat currency experiments end in tears as money and debt explode, rendering the fiat currency worthless. Well, the currency is worthless as paper money has no intrinsic value except what the government says it is worth. A reminder that the dollar keeps falling in value in relation to gold. In 1971, US$1,000 bought 24.5 ounces of gold. Today it buys 0.53 ounces. That’s loss of purchasing power. Down 98%.
A Reminder
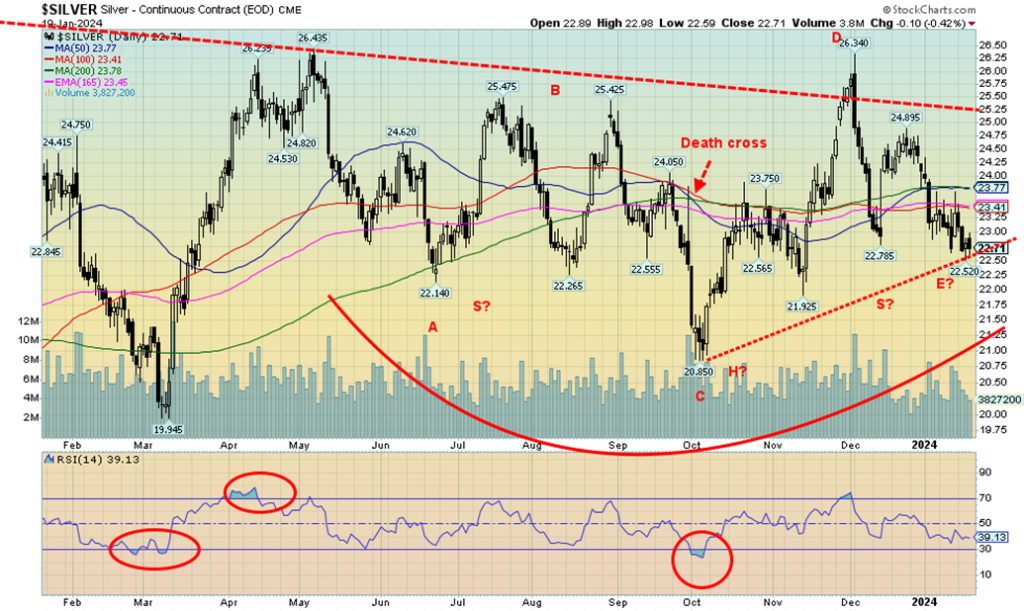
As with gold, silver prices were hammered lower this past week because of a rising US$ Index, rising bond yields, and hawkish statements from Fed officials. Higher U.S. retail sales didn’t help, nor did rising consumer sentiment. A sluggish Chinese economy also didn’t help as that lowers demand for industrial metals. While silver is a monetary metal like gold, it is also more so an industrial metal.
Silver fell 2.7% this past week and is now down 5.7% on the year. We are not as confident about that potential head and shoulders bottom any longer. It would be truly dead if silver prices broke below $21.93 the November low. The commercial COT is only at 31.3%, which in our opinion is not bullish enough. We’d need to see that over 40% preferably over 45%.
The only consolation we see is that we may be completing the E wave of a complex ABCDE-type correction from that high seen in May 2023 at $26.44. But again, we don’t want to break under $21.93. The $22.50 zone is a support zone and our preference is also to see that hold. $26/$27 remain our key breakout points and they have proven to be quite resilient now for some time. Only above $23.75 could we consider that a low is in.
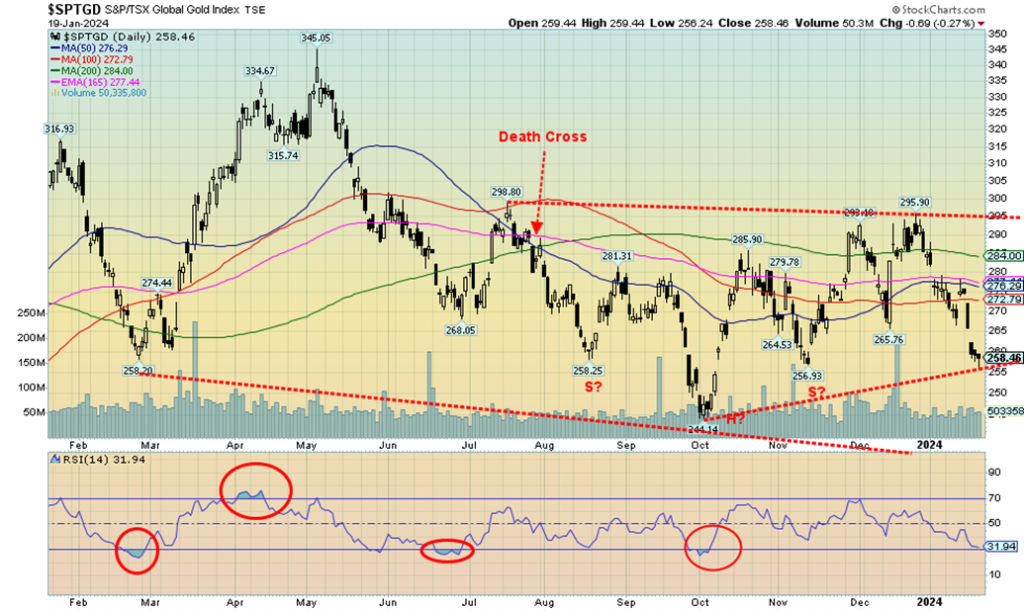
It was not a good week for the gold stocks. The TSX Gold Index (TGD) gapped down on Wednesday as gold prices fell. Both the TGD and the Gold Bugs Index (HUI) broke uptrend lines this past week as well. Only if we are now making a low could we re-establish an uptrend. That’s the bad news.
The good news, as we noted in our opener on gold and under our gold commentary, is that gold and gold stocks have some history of making yearly lows in the December/January/February period. On the week, the TGD fell 6.1% while the HUI was down 6.3%. Both are now negative on the year and it’s only two weeks. The TGD is down 9.3% while the HUI is off 10.2%. We don’t expect that to last.
We could argue that what appeared as a potential head and shoulders bottom formation could be broken. Or it could just be a more complex head and shoulders bottom pattern forming. We reserve judgment, but a further decline would undo the pattern. Under 256, the TGD could be set up to see new lows below the October 244.
The HUI suggests new lows below 210. However, if we start to recover from these levels, then we may have seen our low. The reality is that the TGD needs to regain back above 275 to suggest that a low may be in. The HUI needs to regain above 238. The Gold Miners Bullish Percent Index (BPGDM) is currently at 35.7 which, all things considered, is not bad. The October 2022 low was 3.45 and October 2023 low was 10.71. The recent high was at 53.6 while in that run-up to a top in May 2023 the BPGDM hit over 75. Sentiment is down but not out, despite the recent drop.
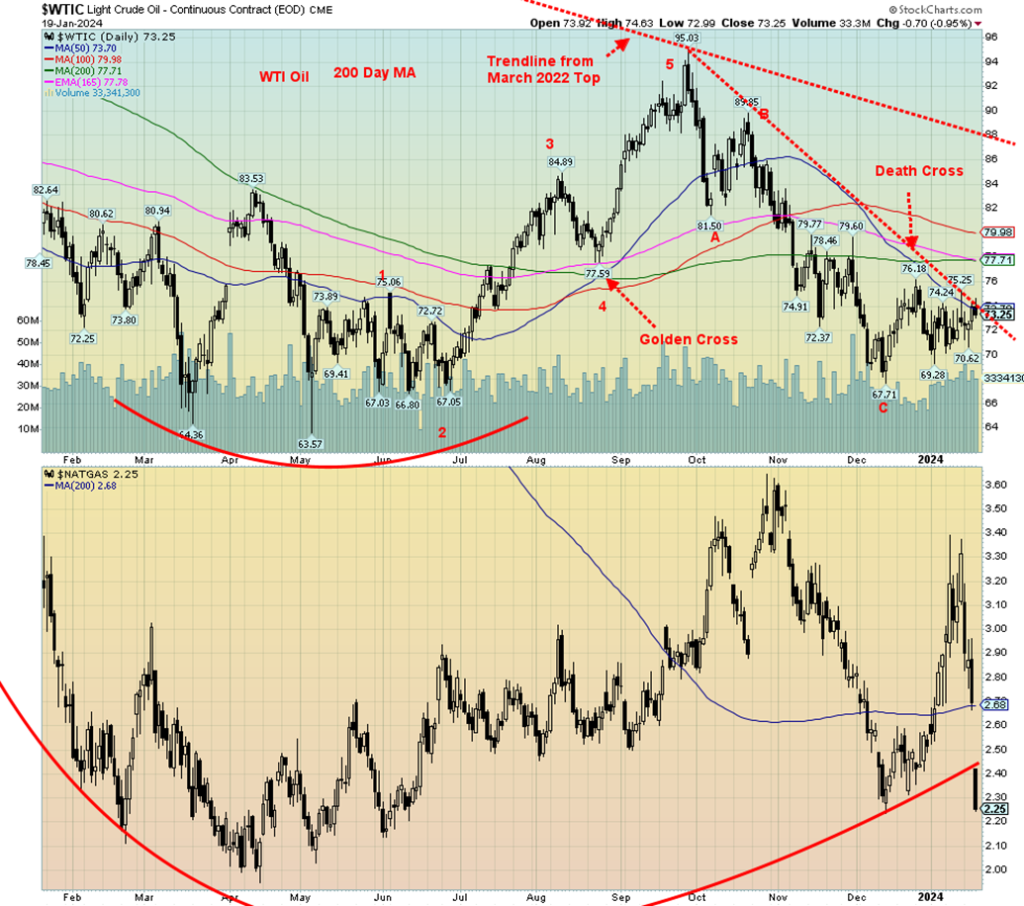
As we have noted, ongoing tensions in the Red Sea/Straits of Bab-El-Mandeb vs. the Houthis have helped raise oil prices this past week. But not by much. Also helping was a 2.5 million barrel draw of U.S. crude inventories this past week. The only offset was the EIA revising upward its daily demand for oil, citing better than expected economic numbers, along with lower oil prices that have translated into lower gas prices at the pump. On the week, WTI oil rose 0.8% while Brent crude was up a smaller 0.2%.
If there was a shock this past week it was natural gas (NG). It plunged on Friday, thanks to lower-than-expected draw on one hand and the extreme cold weather on the other. The cold weather is now starting to dissipate and warmer weather is forecast going forward. Not only was the draw lower than expected, but NG in storage is 11.2% above the seasonal norm. The EU has sizable reserves as the Russia/Ukraine war actually had them stocking up. Storage levels in the EU are still 70%–80% full. Demand there is also weaker, despite some colder weather. NG plunged this past week with the Henry Hub NG down a shocking 32.0%, while the EU Dutch Hub NG fell 11.1%.
All of this weighed on the energy stocks that did not fare well this past week. The ARCA Oil & Gas Index (XOI) fell 3.3% while the TSX Energy Index (TEN) dropped 4.3%. Despite the drop everywhere and oil prices barely rising, WTI oil still appears to be basing for higher prices. It is currently testing the downtrend line from the September 2022 high of $95 and the 50-day MA. Irrespective of this, a break above $75 could suggest that a low is in. However, we won’t consider the low is in until we clear $80. A small uptrend appears to be developing, but it could die quickly if we drop back under $70 and especially under $69. WTI Oil doesn’t really break out until over $88/$90.
NG now looks terrible and the shocking plunge this past week is not going to be repaired any time soon. That’s also a big gap to overcome, roughly between $2.40 and $2.70. The question now is, will the April 2022 low near $2 hold? Or are we in the process of making a potentially interesting double bottom? Is all this the last hurrah to the downside until NG prices rise again? We are into the period of the positive seasonals, but it is rather meaningless for NG if the weather stays warm and supplies remain high. NG is also less susceptible to a shock such as oil could experience if the Straits of Hormuz were blocked or even impacted. Both the TEN and XOI are approaching/testing the December low and, if that breaks, energy stocks could fall further.
On the positive side, the energy stocks are showing positive divergences in the indicators. That doesn’t mean a low is being made but instead suggests that shorting from these levels may not be the best strategy. However, we have no buy signals. The TEN doesn’t give us buy signals until we regain 250/255. We closed Friday at 235.
Copyright David Chapman 2024
__
(Featured image by Austin Distel via Unsplash)
DISCLAIMER: This article was written by a third party contributor and does not reflect the opinion of Born2Invest, its management, staff or its associates. Please review our disclaimer for more information.
This article may include forward-looking statements. These forward-looking statements generally are identified by the words “believe,” “project,” “estimate,” “become,” “plan,” “will,” and similar expressions. These forward-looking statements involve known and unknown risks as well as uncertainties, including those discussed in the following cautionary statements and elsewhere in this article and on this site. Although the Company may believe that its expectations are based on reasonable assumptions, the actual results that the Company may achieve may differ materially from any forward-looking statements, which reflect the opinions of the management of the Company only as of the date hereof. Additionally, please make sure to read these important disclosures.
David Chapman is not a registered advisory service and is not an exempt market dealer (EMD) nor a licensed financial advisor. He does not and cannot give individualised market advice. David Chapman has worked in the financial industry for over 40 years including large financial corporations, banks, and investment dealers. The information in this newsletter is intended only for informational and educational purposes. It should not be construed as an offer, a solicitation of an offer or sale of any security. Every effort is made to provide accurate and complete information. However, we cannot guarantee that there will be no errors. We make no claims, promises or guarantees about the accuracy, completeness, or adequacy of the contents of this commentary and expressly disclaim liability for errors and omissions in the contents of this commentary. David Chapman will always use his best efforts to ensure the accuracy and timeliness of all information. The reader assumes all risk when trading in securities and David Chapman advises consulting a licensed professional financial advisor or portfolio manager such as Enriched Investing Incorporated before proceeding with any trade or idea presented in this newsletter. David Chapman may own shares in companies mentioned in this newsletter. Before making an investment, prospective investors should review each security’s offering documents which summarize the objectives, fees, expenses and associated risks. David Chapman shares his ideas and opinions for informational and educational purposes only and expects the reader to perform due diligence before considering a position in any security. That includes consulting with your own licensed professional financial advisor such as Enriched Investing Incorporated. Performance is not guaranteed, values change frequently, and past performance may not be repeated.


Ecobnb Turns Sustainable Tourism Into Measurable Impact
Ecobnb’s sustainable tourism platform generated significant environmental and social impact in 2025, avoiding 58,207 kg of CO₂ and adding 583...


Sugar Markets Balance Biofuel Demand and Global Supply
Sugar markets in New York and London were mostly unchanged as the Iran conflict renewed interest in biofuels. Drought concerns...


The $40 Trillion Trap: Disinflation Is Not Deliverance
U.S. debt has reached $40 trillion, with $24 billion weekly interest, while deficits accelerate. Despite disinflation in CPI, from cooling...


FinTech Matures as AI and Infrastructure Drive the Next Growth Phase
Fintech markets are entering a mature phase, shifting from rapid growth to consolidation, specialization, and sustainable business models. Zurich and...


Bitcoin, and Ethereum Rise, While Cardano Enters Transition
Bitcoin and Ethereum posted modest weekend gains, supported by ETF inflows. A new proposal may protect Bitcoin from quantum threats....
 |
|
 |  |
 |
|
-
 Fintech1 week ago
Withings Achieves Profitability in 2025 with 90% Growth Since 2018
-

 Biotech2 weeks ago
Circulating Tumor DNA Guides Chemotherapy Decisions in Colorectal Liver Metastases
-

 Biotech5 days ago
Emily.AI: Personalized Oxygen Therapy Earns Global AI Recognition
-

 Fintech2 weeks ago
Revolut Updates Crypto Rules for Deposits and System Errors