Markets
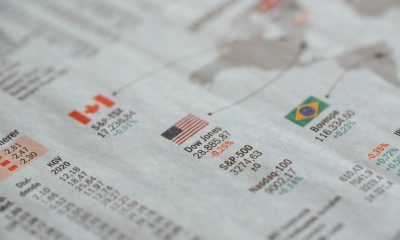
Markets Rebound, Dollar Wobbles, and Global Tensions Simmer
Stocks rebounded, gold wavered, and confusion reigns amid shifting Fed and China sentiment. Questions arise about the U.S. dollar’s future as reserve currency as its foundations face strain. Stock markets soared, led by MAG7 and Thomson Reuters. Gold faces seasonal weakness. Bond yields stay high, oil wavers, and geopolitical tensions simmer, while political spectacles unfold.
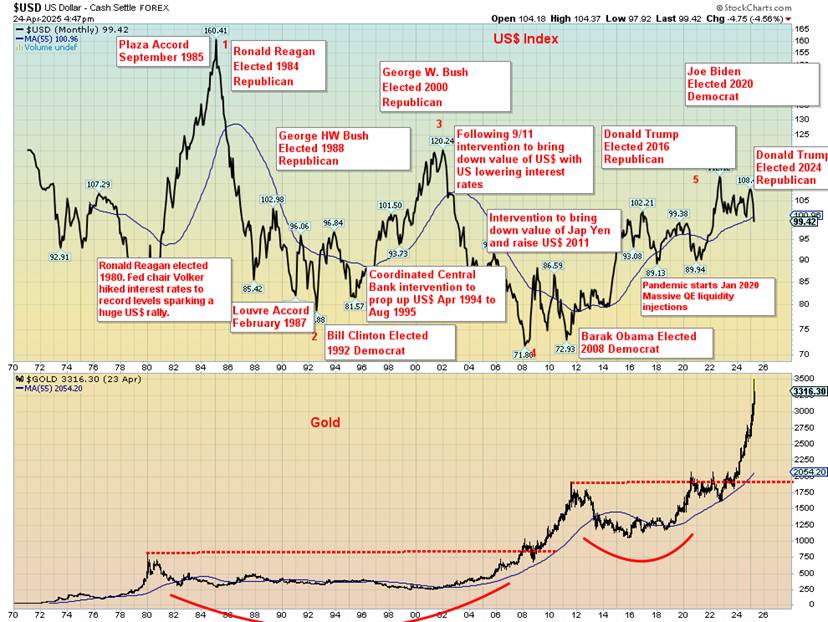
The U.S. dollar has been a source of stability and the world’s reserve currency—officially since 1945, but in reality, since 1920. Before that, the U.K. pound sterling was the world’s reserve currency for roughly 105 years from 1815 to 1920. Characteristics of the world’s reserve currency over the centuries have been political stability, steady economic growth, leadership in economic growth, a strong legal framework, and a dominant role in global trade and finance.
Given those characteristics, the U.S. dollar should continue its dominance, but its recent actions threaten that role.
No, the U.S. dollar as the world’s reserve currency won’t end tomorrow, but it is under strain
History has shown us that since 1400 AD a reserve currency has lasted on average roughly 94 years, with a range from 80 to 110 years. From the onset, that period could last at least 250 years. And no, it doesn’t mean it just disappears. Yes, the pound sterling is still with us. It’s just its role as the dominant currency diminishes.
In 2030, the U.S. dollar as the world’s dominant currency will have been around for 110 years—officially, the reserve currency for 80 years. The U.S. dollar as currency has been around since the time of the American Revolution or since the Coinage Act of 1792, roughly 233 years. Prior reserve currencies since 1400 include the Portuguese real or dinheiro, the Spanish real, the Dutch (Netherlands) florin, the French franc, and the U.K. pound sterling.
We could go back even further to ancient times when the Greek drachma and the Roman denarius were at the time the globally accepted currencies. Following the demise of the Roman denarius, the gold solidus came to prominence, which was also adopted by the Byzantine empire. With the demise of the Byzantine empire, first rose the Florentine florin around 1250 AD followed by the Venetian ducat as the world’s reserve currency. The world’s first central bank came about in 1609, the Bank of Amsterdam (Netherlands).
Since peaking on January 13, 2025, the US$ Index has already fallen about 10%. It’s down 8% since January 20, 2025 and down 4% since “Liberation Day” on April 2, 2025. At its low, it was down 11%, 9.5%, and 5.5% respectively. The U.S. dollar as the world’s reserve currency makes up roughly 59% of central bank’s reserves. (Note: it was 72% in 2000.)
Also held as reserve currency are the euro (19.8%), the Japanese yen (5.5%), the U.K. pound sterling (4.9%), the Chinese yuan (2.6%), the Canadian dollar (2.4%), and the Australian dollar (2.0%), plus a small assortment of other currencies (3.9%). Oh yes, and they also hold gold, some 36,194.8 metric tonnes or almost 1.16 billion ounces for a value of about $3.8 trillion with gold at US$3,300/ounce. Gold holdings represent at least 20% of total reserves. In addition to currencies and gold, central banks hold Special Drawing Rights (SDRs) and reserve positions in the International Monetary Fund (IMF).
Historical Timeline of Global Reserve Currencies 1250–2025
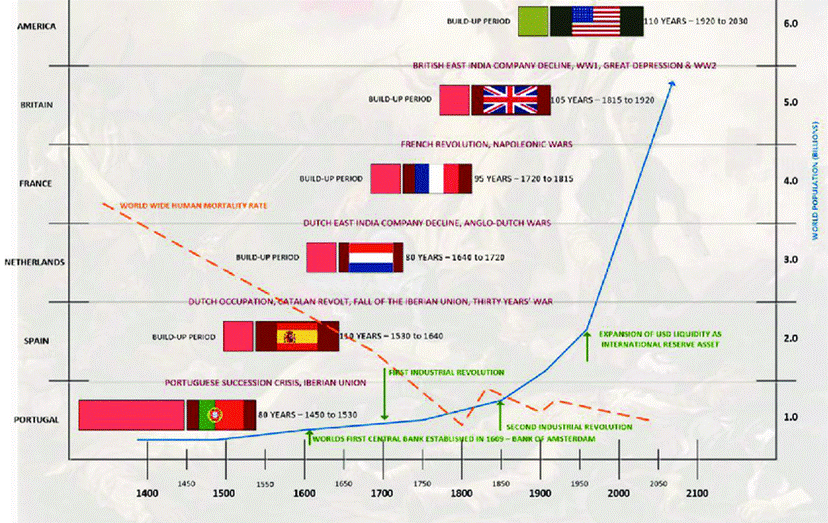
Source: www.cryptocharlie.eu/en/history-of-money/
With a declining US$ Index, the onset of a destabilizing and chaotic rollout of a global trade war, and unsustainable global debt and fiscal deficits, the question arises: could the U.S. dollar as the world’s reserve currency be under attack? As history has shown, a reserve currency does not last forever. Nor do empires. Since 1250, gone are the Portuguese, Spanish, Dutch, French, and British empires. And, less we forget, before that the Greek, Roman Republic, Roman, and Byzantine empires and the Italian empires of Florence and
Venice. There were also Asian empires such as the Qin Dynasty (China), the Song Dynasty (China), the Yuan Dynasty (China), and the Mughal empire (India). As well, the Persian empire 550–350 BCE, the Umayyad Caliphate 661–750 AD, and the Mongol empire 1206–1368 AD. And, more recently, the Russian empire 1721–1917. Each also had their coinage as reserve currencies. We could even go back to the ancient Lydian empire (around 600 BC; now Turkey). There was also the Egyptian empire of 1570–1609 BCE. In the Americas, there was the Mayan empire 250 BCE–950 AD, the Aztec empire (collapsed in 1519), and the Inca empire (collapsed in 1533). Empires come and go, as do their currencies. Is this time different?
What is stunning is the massive growth of debt in the U.S. and the world for that matter since World War II. In 1950 the U.S. debt to GDP ratio was 150%. Today it is 344%. That’s thanks to debt growth of 23,000% for debt vs. only 10,100% for GDP since 1950. Is that an unsustainable path, given today that it takes at least $3.50 of new debt to create $1 of GDP?
Yearly U.S. deficits currently represent 6.6% of GDP. Only a small handful of countries have a positive budget balance. There are few signs the U.S. actually intends to rein in its budget deficit over the next four years. U.S. debt is expected to rise $9.7 trillion by 2029. Can the U.S. keep adding debt at that pace, finance it, and allow the U.S. dollar continue as the world’s reserve currency?
Already, U.S. total debt, consisting of federal, state, and municipal governments, corporations (financial, non-financial), and households (mortgage, credit cards and lines, student debt, auto debt, etc.) is 344% of GDP. And it is not even the highest in the world. Japan’s is estimated at 1,279% of GDP as of 2024, according to CEIC data, but this includes derivatives. The U.S., according to CEIC, is 722% (www.ceicdata.com). CEIC is a global economic database. On a more nominal basis comparable to the U.S., Japan’s total to GDP is estimated at 526%.
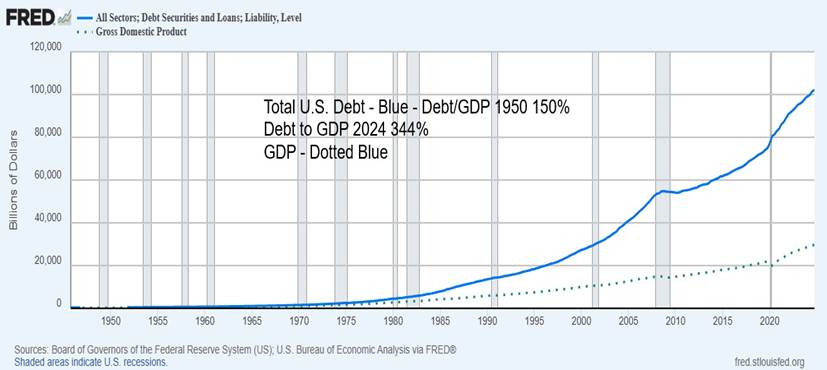
Source: www.stlouisfed.org
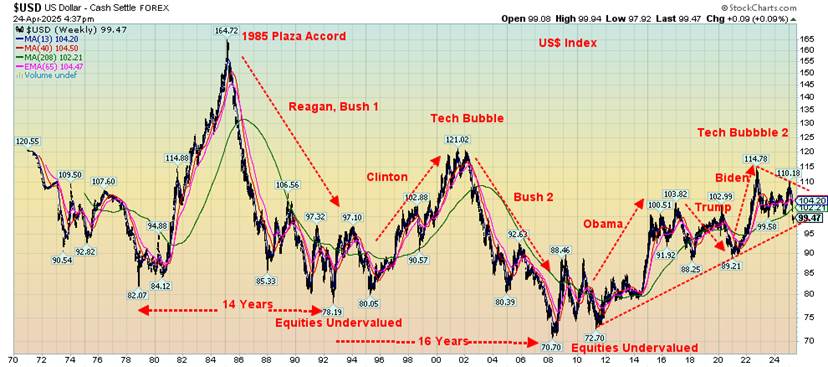
Source: www.stockcharts.com
The US$ Index has been around more or less in its present form since the world came off the gold standard in August 1971. The world used a gold standard from roughly 1870 although it was always shaky, especially during World War I, the Great Depression, and World War II, when at times it was suspended. Bretton Woods after World War II established the fixed rate of gold at $35/ounce with currencies fixed to the U.S. dollar within a range. That ended in August 1971.
Since then, what we’ve seen are fiat currencies centered around the U.S. dollar with currencies floating. A fiat currency is just a promissory note that a government will pay its face value—effectively an IOU. With the demise of the gold standard, the U.S. dollar was overvalued and it fell precipitously throughout the 1970s. It was a period of generally falling stock prices, rising gold prices, and inflation (stagflation).
That all came to an end when Fed Chair Paul Volcker hiked interest rates to 20%, sparking a steep recession (1980–1982), ending the gold bubble of 1979, and sparking a huge rally in the U.S. dollar. Stocks came out of their doldrums in 1982, slowly at first. But by 1985 it was clear the high U.S. dollar was causing problems, so the Plaza Accord was designed to lower the value of the U.S. dollar.
Of course, it caused other problems and in February 1987 came the Louvre Accord, designed to raise the value of the U.S. dollar once again. It was only partly successful and by 1994 there was coordinated intervention to spark an upward revaluation of the U.S. dollar as other currencies had become too expensive, negatively impacting global trade. The U.S. became the world’s export market and, as a quid pro quo, the world bought U.S. dollar debt.
Source: www.stockcharts.com
All that created another big rally in the U.S. dollar; however, that ended with the events of 9/11. The U.S. then lowered interest rates, sparking another sell-off of the U.S. dollar. By 2008 the US$ Index had fallen over 40% once again, causing other kinds of problems. Then came the global financial crisis and the collapse of Lehman Brothers in September 2008. Finally, out of the chaos of the financial crisis, the US$ Index began to rise again, peaking initially in 2016. The Trump administration’s desire for a lower dollar caused it to fall once again as Trump also initiated trade wars. The US$ Index only began to rise again with the return of the Democrats in 2020. That peaked in January 2025 following once again the election of Trump and the onset of trade wars.
Gold, a safe haven because of its long history (3000 years of use as money, with durability and no liability), was dormant for years following the bubble peak of 1980 with periodic rebounds. Central banks were actually divesting themselves of gold. But out of the chaos of the end of the tech bubble and the events of 9/11, gold started to rise again. After the global financial crisis of 2008, gold soared, peaking in 2011.
The global financial crisis, the European debt crisis, a debt limit crisis, and a U.S. credit downgrade all contributed to the rise of gold to over $1,900. A decline of gold as a safe haven, rising interest rates, the end of quantitative easing (QE), a strengthening U.S. dollar, and no inflation all caused gold to collapse to $1,045 by December 2015. The end of the gold era was predicted. That is, until it started to rise again.
Gold started to rise again in 2018 due to the destabilization of trade wars from the Trump administration. Gold then took off after the pandemic as QE soared and interest rates plunged. Following a correction into 2022, it really took off as geopolitical concerns soared with the outbreak of the Ukraine/Russia war. Inflation also started rising, a result of the huge stimulus of the pandemic along with disrupted supply chains. It was also the period of massive debt accumulation. Interest rates leaped.
The US$ Index topped out in October 2022 and started a slow decline. That decline is now starting to intensify as the trade wars break out and geopolitical tensions heat up, along with the potential destabilization of the U.S. and loss of faith in the U.S. government. Capital flight, a very unusual occurrence for the U.S., has been underway in 2025 as faith in the U.S. government teeters. Foreign creditors are also concerned that, given the current attack on immigrants, law firms, universities, and the judiciary, they too could see their rights attacked.
The US$ Index has a cycle that appears to be around 16–18 years. But evidence is slim. Note lows in 1978, a secondary one in 1980, followed by a major low in 1992 (14 years from 1978). A secondary low came in 1994 (16 years). The next major low came in 2008 (16 years from 1992), with the secondary low in 2011 (17 years from 1994). If that cycle is correct (on limited evidence), the next cycle low was to occur from 2024 to 2026. We are falling, but we are seeing no sign of a bottom. At least not yet.
Effectively speaking, the US$ Index has been in a long decline since the world came off the gold standard in 1971. That’s irrespective of huge rallies into 1985, 2001, and 2022. Each high has been lower than the previous high and each low has been lower than the previous low: the definition of a downtrend. Notably, the US$ Index has been strong during Democrat administrations but weak during Republican administrations.
Trade wars that create geopolitical tensions, economic uncertainty, and loss of faith in government are bad for the US$ Index, bad for the stock market, bad for the bond market (as interest rates rise to stem capital outflows), and bad for currencies, but good for gold and commodities.
For the record, many believe that cryptocurrencies, specifically Bitcoin, could replace the U.S. dollar and become the reserve currency. Is it money, a currency, a safe haven, or just another form of fiat currency?
Over the centuries, every fiat currency has eventually collapsed.
Chart of the Week
Source: www.stockcharts.com
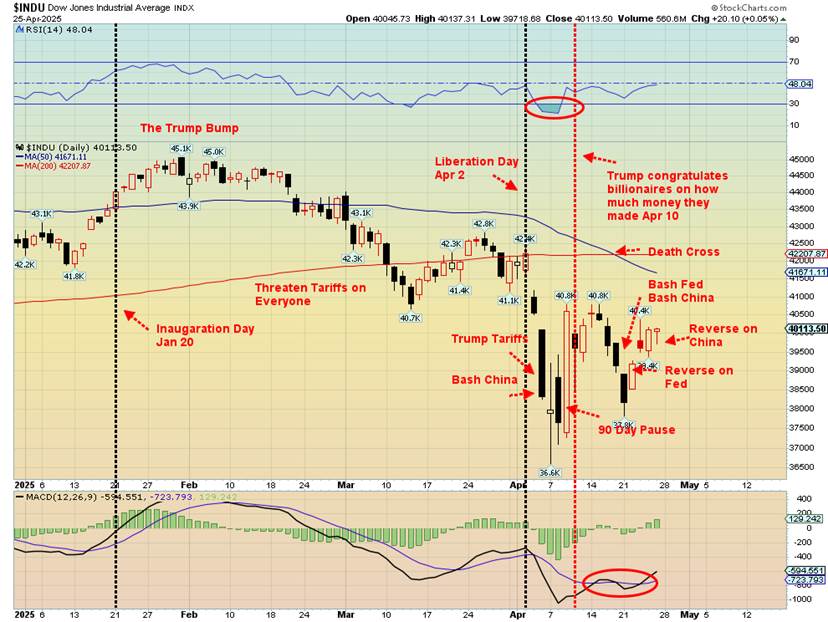
Tactical U-turns or something more nefarious? One can’t help but notice the sudden reversals. Bash China, bash the Fed one day. Market sinks, gold soars. The next day flip-flops; Trump has “no intention” of firing Fed Chair Powell after a few days of threats and insults. He ups the ante on tariffs on China, then floats lowering tariffs on China.
Of course, it isn’t the first time with Trump’s on-again, off-again tariffs or bashing of Fed Chair Powell. Which is it? Bashing the Fed Chair is not a wise idea as it threatens the independence of the central bank. Add in Trump threats against government agencies and universities and one has the potential for the destabilization of not only the U.S. dollar but also the bond market.
One wonders why, after putting tariffs on everyone including China, he suddenly reverses and announces a 90-day pause, a mere four hours after urging everyone on Truth Social to buy stocks. The next day in the Oval
Office he congratulates billionaires on how much money they made. It seems someone filmed it. Others have raised the potential for manipulation to the benefit of some as a number of stories have appeared, mostly in international newspapers. Normally we call it inside information. But is it, when the president is the one issuing the on-again, off-again tariffs and doing the bashing? Or did he just become nervous about the market volatility and the potentially negative impact on the economy? Or, is all just a part of the chaos and volatility we were expecting for 2025? So far, we’re getting it in spades.
Even gold has not been immune to all this volatility as it soars over $500 from April 7 to an all-time high peak near $3,500 in a matter of 10 days, then—poof—drops over $200 over the next two days. Gold’s rise was a response to the chaos of the tariffs, the Trump/Powell dispute, potential for more inflation raising the cost of debt, and a coming recession. Gold most likely needs a new reason to rise as all those were built into the market. Buy the rumour, sell the news? We suppose this is all par for the course. But when U.S. executives panic and call out the president for potentially destroying the economy, he reverses course. Either he doesn’t know what he is doing, or the chaos results in buying opportunities.
Then we have, lurking in the background, the potential for the Russia/Ukraine war to escalate and a U.S./Israeli attack on Iran. War always gets gold rising and makes markets nervous.
Markets & Trends
| % Gains (Losses) Trends | ||||||||
| Close Dec 31/24 | Close Apr 25/25 | Week | YTD | Daily (Short Term) | Weekly (Intermediate) | Monthly (Long Term) | ||
| ne | ||||||||
| S&P 500 | 5,881.63 | 5,525.21 | 4.6% | (6.1)% | neutral | down | up | |
| Dow Jones Industrials | 42,544.22 | 40,113.50 | 2.5% | (5.7)% | down | down | up | |
| Dow Jones Transport | 16,030.66 | 13,497.05 | 0.4% | (15.1)% | down | down | down | |
| NASDAQ | 19,310.79 | 17,382.94 | 6.7% | (10.0)% | neutral | down | up (weak) | |
| S&P/TSX Composite | 24,796.40 | 24,710.51 | 2.1% | (0.1)% | up (weak) | neutral | up | |
| S&P/TSX Venture (CDNX) | 597.87 | 653.82 (new highs) | 3.2% | 9.4% | up | up | neutral | |
| S&P 600 (small) | 1,408.17 | 1,219.01 | 3.8% | (13.4)% | down (weak) | down | down (weak) | |
| MSCI World | 2,304.50 | 2,493.38 | 3.1% | 8.2% | up | neutral | up | |
| Bitcoin | 93,467.13 | 95,048.38 | 12.3% | 1.7% | up | neutral | up | |
| Gold Mining Stock Indices | ||||||||
| Gold Bugs Index (HUI) | 275.58 | 389.13 (new highs) | (2.6)% | 41.2% | up | up | up | |
| TSX Gold Index (TGD) | 336.87 | 472.61 | (3.7)% | 40.3% | up | up | up | |
| % | ||||||||
| U.S. 10-Year Treasury Bond yield | 4.58% | 4.26% | (1.6)% | (7.0)% | ||||
| Cdn. 10-Year Bond CGB yield | 3.25% | 3.20% | 1.9% | (1.5)% | ||||
| Recession Watch Spreads | ||||||||
| U.S. 2-year 10-year Treasury spread | 0.33% | 0.49% | (5.8)% | 48.5% | ||||
| Cdn 2-year 10-year CGB spread | 0.30% | 0.60% | (3.2)% | 100.0% | ||||
| Currencies | ||||||||
| US$ Index | 108.44 | 99.62 | 0.2% | (8.1)% | down | down | down | |
| Canadian $ | 69.49 | .7217 | (0.2)% | 3.9% | up | up (weak) | down | |
| Euro | 103.54 | 113.51 (new highs) | (0.1)% | 9.7% | up | up | up | |
| Swiss Franc | 110.16 | 120.80 (new highs) | (1.0)% | 9.7% | up | up | up | |
| British Pound | 125.11 | 133.11 | 0.4% | 6.4% | up | up | up | |
| Japanese Yen | 63.57 | 69.58 | (0.9)% | 9.5% | up | up | neutral | |
| Precious Metals | ||||||||
| Gold | 2,641.00 | 3,305.69 (new highs) * | (0.6)% | 25.2% | up | up | up | |
| Silver | 29.24 | 33.04 | 1.6% | 13.0% | up (weak) | up | up | |
| Platinum | 910.50 | 966.20 | 0.2% | 6.1% | neutral | neutral | neutral | |
| Base Metals | ||||||||
| Palladium | 909.80 | 921.00 | (2.3)% | 1.2% | down (weak) | down | down | |
| Copper | 4.03 | 4.84 | 3.0% | 20.1% | neutral | up | up | |
| Energy | ||||||||
| WTI Oil | 71.72 | 63.22 | (1.9)% | (11.9)% | down | down | down | |
| Nat Gas | 3.63 | 2.96 | (8.9)% | (18.5)% | down | neutral | neutral | |
* New All-Time Highs
Source: www.stockcharts.com
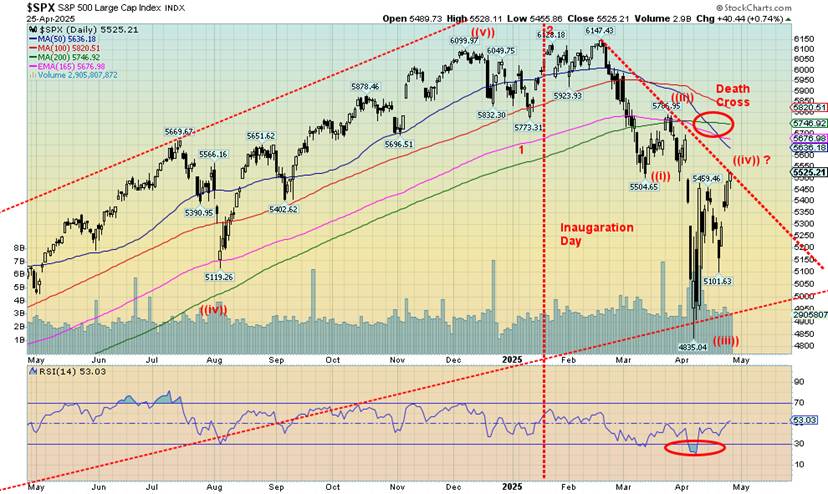
Are you loving the chaos and volatility yet? If markets aren’t plunging on fear of tariffs, inflation, Powell firings, Russia/Ukraine war, threats against Iran, and the chaos of the Trump White House, markets are rebounding in a hurry as they think a deal might be made with China over tariffs, Trump won’t fire Powell, Trump will get a deal with Russian/Ukraine, and Tehran will succumb to sign a nuclear deal. The good news is we’re up 14.2% from the lows and we’re over 5,500. The bad news is we’re still down 10.1% from the all-time high in February. Is the glass half full or half empty?
On the week, the S&P 500 (SPX) gained 4.6%, the Dow Jones Industrials (DJI) was up 2.5%, the lagging Dow Jones Transportations (DJT) was up a small 0.4% while the NASDAQ gained 6.7%. The S&P 400 (Mid) was up 3.2% while the S&P 600 (Small) gained 3.8%. The S&P 500 Equal Weight Index gained 2.9% while the NY FANG Index was up almost 11%. Bitcoin soared again, up 12.3% back over $95,000 as Trump Media was engineering some crypto deal.
In Canada, the TSX was up 2.1% while the TSX Venture Exchange (CDNX) made 52-week highs, up 3.2%. In the EU, the London FTSE was up 1.7%, the Paris CAC 40 was up 3.4%, the German DAX was up 4.9%, and the EuroNext was up 3.0%. In Asia, China’s Shanghai Index (SSEC) gained 0.5%, the Tokyo Nikkei Dow (TKN) was up 3.9%, and Hong Kong’s Hang Seng (HSI) was up 2.7%. All in all, a good week. But will it hold?
We suspect it won’t, but in the short term we’re enjoying a classic bear market rebound. Overall, this up move is too much, too soon to be really sustainable. A test of the lows is usually inevitable before a better rebound could get underway. In 2008, everyone thought it was all over in October/November 2008, and then came the collapse into March 2009 for the final low. The Fear & Greed Index, once showing maximum extreme fear, is now just fear.
The SPX is at down trend line resistance. If we break through above 5,550, we could rise to near 5,800. New highs could be seen above 5,850. We’re not expecting that, but anything is possible as the chaos goes from extreme fear to extreme euphoria. If Trump suddenly changes his mind again and announces that the tariffs were all an April Fools’ joke, markets would scream higher and gold would probably collapse. But, given the chaos that has already happened, expect the volatility to continue. However, that death cross (50-day MA falling below the 200-day MA) is usually a good sign that the bear should continue to roam for the time being, at least.
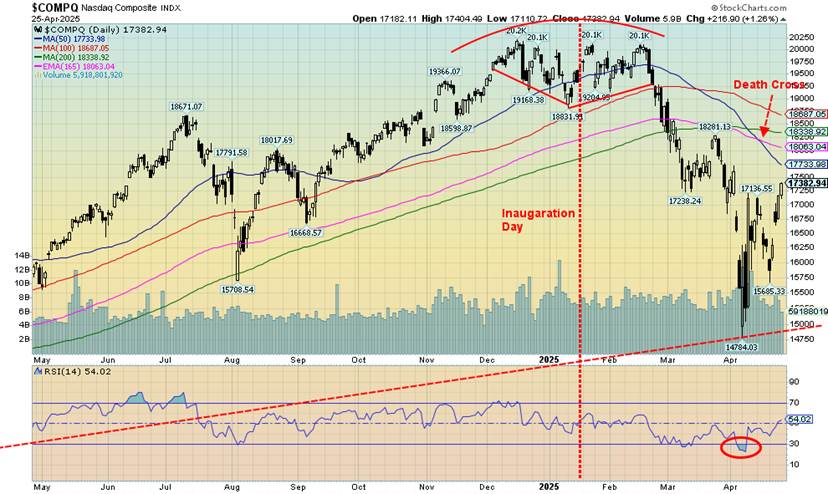
Happy days are here again as the NASDAQ and MAG7 all leaped this past week. The on-again, off-again volatility of Trump’s tariffs and on-again, off-again firing of Jerome Powell has markets either tanking or roaring upward. This past week was roaring upward. The NASDAQ gained 6.7% this past week as the NY FANG Index was up almost 11%. MAGS, the ETF representing the MAG7, rose 9.4%. The big winner on the week was Tesla, up 18.1% as Musk announced he was stepping back from DOGE to concentrate on the sinking Tesla.
Tesla is still down 29.4% in 2025. Netflix also did well, up 13.2% to new all-time highs. We guess lots of people are watching Netflix rather than going out. Trump Media (DJT) leaped 18.6% as excitement mounted over a crypto deal. Trump made millions as cries of conflict-of-interest mount. Others up over 10% included Alibaba (10.5%), Snowflake (10.4%), AMD (10.5%), and Broadcom (12.5%). Too much, too fast? Probably. Resistance for the NASDAQ doesn’t hit until 17,750. We need to get above 19,000 to confirm a low and suggest new all-time highs. A gap below between 16,750 and 16,250, if filled, could instead suggest lower prices. Below 15,685 we’re headed for new lows. Major support is at 15,000.
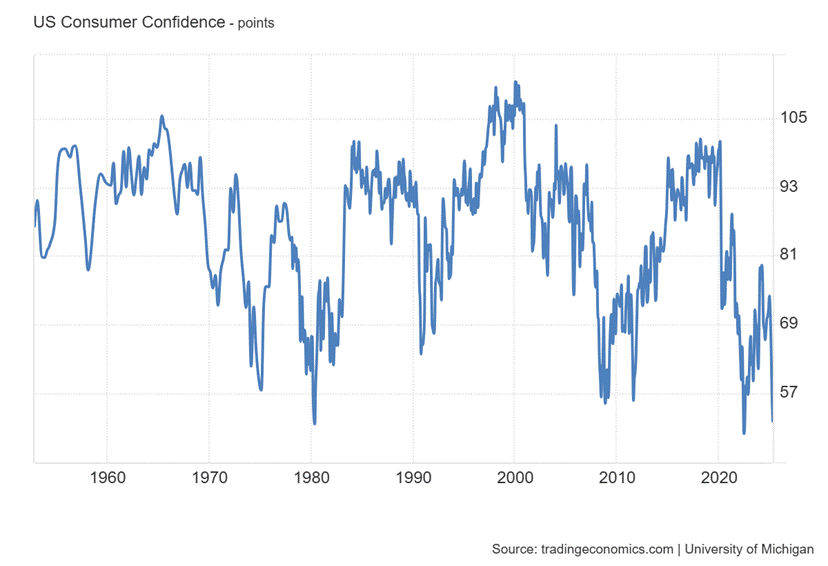
Source: www.tradingeconomics.com, www.umich.edu
Once again, consumer confidence fell with the final release of the April Michigan Consumer Sentiment Index. It fell to 52.2 in April from 57 in March. That was actually a slight improvement from the previously reported 50.8. Consumer expectations and consumer inflation expectations were also lower on the month. We are now perilously low, near the levels seen in 1980 and 2008, and we are not even in a recession (official) yet. Could new lows not be far behind?
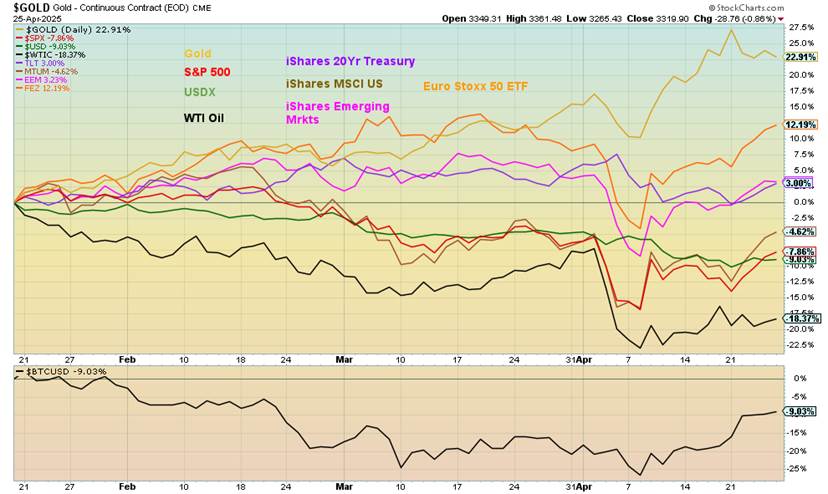
Source: www.stockcharts.com
It’s been 95 days since Inauguration Day and the chaos still has gold in the lead, up 22.9% during the period. The gold stock indices would be up even more. Most others remain in the red with oil continuing to be the worst performer, down 18.4%. The US$ Index is next down 9.0%. Behind gold, the best performer has been the European stock markets. The Euro Stoxx 50 ETF (FEZ) is up 12.2%. Emerging markets (+3.2%) and the iShares 20-year treasury bond (3.0%) are the only other winners.
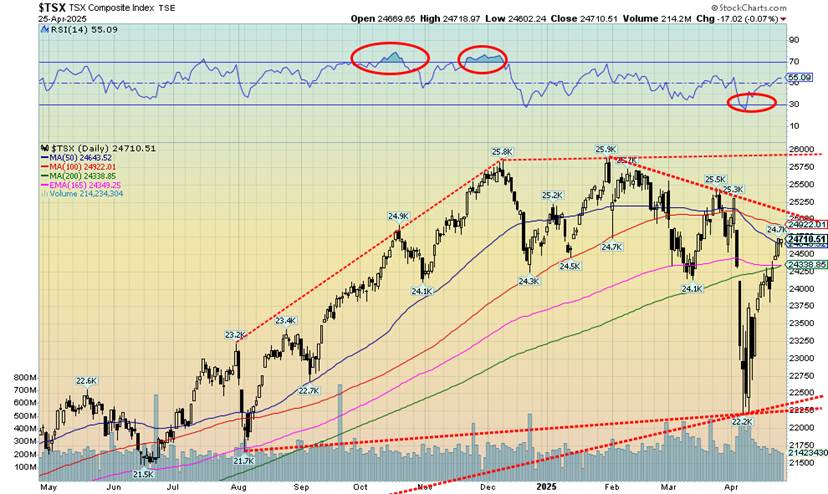
Source: www.stockcharts.com
The TSX continues its recent outperformance. This past week the TSX Composite rose 2.1%, not as much as the U.S. indices, but on the year the TSX is down only 0.1%, outperforming the S&P 500, the DJI, the DJT, and the NASDAQ. The strong materials along with golds and metals helps. Over at the TSX Venture Exchange (CDNX), we were surprised as the CDNX rose 3.2% on the week and eked out a fresh 52-week high in the process. Never mind that the CDNX remains down 80% from its 2007 all-time high; we’re up 100% from the pandemic low.
Still, the CDNX has been an outrageously poor performer and the junior gold and metals mining stocks that dominate the index have been outright miserable. But they are also dirt cheap, even if grossly unnoticed. Will they remain that way forever? Not likely. We just can’t say with clarity when they will really come to life. Downside is minimal.
Of the 14 sub-indices, four were down and 10 up. Leading the way down was Golds (TGD), off 3.7%. We’ll forgive Golds for their pullback, given they lead all the sub-indices with a gain of 40.3% in 2025. Of the winners, Information Technology (TTK) led the way, up 6.7%. Health Care (THC), the worst performer, followed, up 5.8%. THC is down 23.1% in 2025. Nine of the sub-indices are down on the year while Golds (TGD), Materials (TMT), Metals (TGM), Consumer Staples (TCS), and Utilities (TUT) are up on the year. As noted, THC is the worst while TGD is the best.
The TSX is fast approaching major resistance near 25,000. Steep rises such as we’ve seen are usually not sustainable without a retest. On any retest, a break of 22,250 is quite bearish. First good support comes in around 23,750.
U.S. 10-year Treasury Note, Canada 10-year Bond CGB
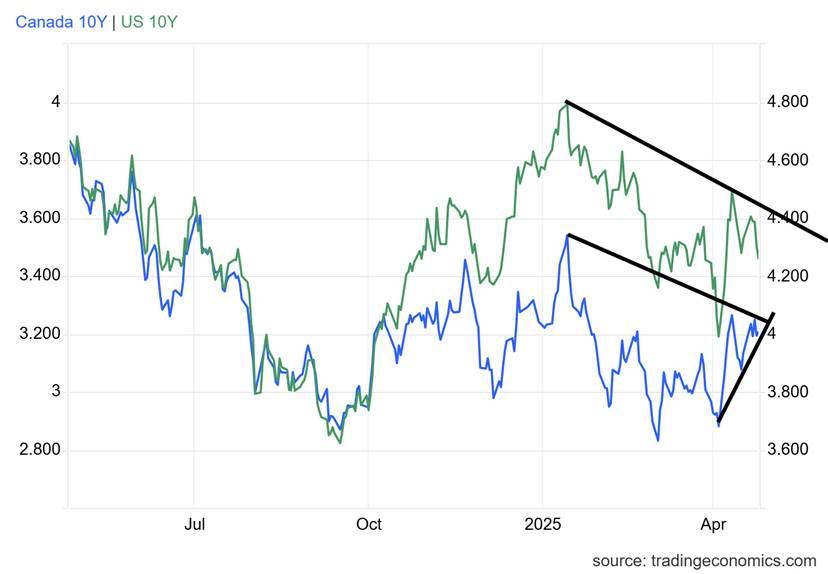
Source: www.tradingeconomics.com, www.home.treasury.gov, www.bankofcanada.ca
Bond yields can’t get out of the way of themselves. All the tariffs were supposed to spark a recession and a major benefactor would be that bond yields would fall. Yes, since Inauguration Day on January 20, the U.S. 10-year treasury note has fallen from 4.65% to 4.24%, including being down from 4.33% the previous week. But since “Liberation Day” on April 2, bond yields are up from 4.20%. After first falling, the bond market changed its mind and rose instead. Evidence of capital outflows are emerging as the rest of the world gets nervous about the trade policies of the U.S. and the surrounding chaos of on-again, off-again tariffs.
In uncertainty, the best get out. Some $8.8 trillion of U.S. federal debt of $36.7 trillion is held by foreigners. As of last reports, China holds $784 billion, the second highest behind Japan which has $1.1 trillion. This past week’s action left us on the edge of potentially seeing rates fall further, but then they could also rise instead. A break of 4.20% could send rates lower. Above 4.40% and especially above 4.50% and we are headed higher. Trump needs lower rates to lower the cost of mortages and the amount of interest the U.S. has to pay for its massive debt. As well, they have $9 trillion of debt to roll over along with a possible deficit of $3 trillion to finance. Will the market demand higher premiums; i.e. interest rates to refinance and finance?
There are over $3 trillion of BBB-rated corporate bonds outstanding. With rising interest rates, many of them could fall below BBB-rated and into junk territory. That would spark a wave of selling corporate bonds. The U.S.’s credit rating could also be downgraded from the current AA+. Even down to AA translates into higher rates the U.S. needs to finance. Trump wants lower interest rates. The Fed controls the short end of the yield curve, but the market controls the long end. Even as the Fed lowers short rates, long bond yields remain sticky to the upside. The closely followed 2–10 spread is currently at 0.49, still pointing towards a recession.
For the record, Canadian bond yields as represented by the Government of Canada 10-year bond (CGB) rose to 3.20% from 3.14%. The Canadian 2–10 spread was off 2 bp to 60 bp.
This coming week is chock full of numbers, starting off with home prices, JOLTs job openings, and consumer confidence from the Conference Board. We also see the Q1 advance GDP (expected to be 0.5%), the Chicago PMI (expected as a recessionary 46), personal income and spending for March, PCE prices (expected up 2.2% year over year), pending home sales, and S&P Global manufacturing.
Then on Friday, May 2 we get the big one: the April nonfarm payrolls and unemployment numbers. Nonfarm payrolls are expected to rise 140,000 after last month’s rise of 228,000. Expect downward revisions for March. Unemployment is expected to remain steady at 4.2% (U3), but the U6 unemployment is expected to rise to 8.0%. Initial jobless claims are just not rising the way many expected. Last week it was 222,000 and this coming week they are expecting 225,000.
Yes, there is weakness in anticipation of a recession. But there is also strength, surprising many to say recession, what recession? Certainly many are struggling right now, but many are also still doing well.
Watch our levels for bonds for clues as to whether we are going lower or higher. The bond market remains more important than the stock market, even if the latter gets all the headlines.
Source: www.stockcharts.com
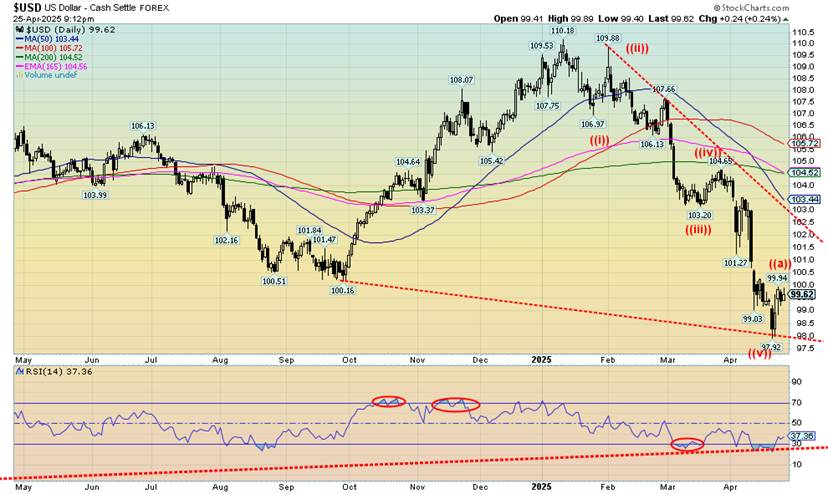
We covered the US$ Index in our opening essay. Still, one can’t help notice the big drop for the US$ Index since a peak in January. Since then we’ve fallen a bit over 11%. We note what appears to be a five-wave decline to the low at 97.92. The recent bounce, even if it hasn’t been much, may be the start of at least a short-term rebound from oversold levels. But that short-term rebound could get up to that downtrend line near 102.00/102.50. Above that, further gains could be seen. Initially, we need to regain over 100. While the US$ Index has been falling, the other currencies have been rising.
This past week the US$ Index bounced 0.2% but is down 8.1% in 2025. The currencies fell this past week with the euro off 0.1%, the Swiss franc down 1.0%, the pound sterling bucking the trend and gaining 0.4%, while the Japanese yen fell 3.7%. The Cdn$ was off just under 0.2%. But 2025 gains have the currencies in some cases making 52-week highs. The euro and the Swiss franc made new highs before closing lower.
On the year, the euro is up 9.7%, the Swiss franc 9.7%, the pound sterling 6.4%, and the Japanese yen 9.5%. The Cdn$ is up 3.9%. A rising US$ Index does not bode well for gold and commodities. At least for the short term. However, the reality is the decline from January to April for the US$ Index is mostly likely the first decline and the pending rebound the second wave. After that comes another sharp drop.
Source: www.stockcharts.com
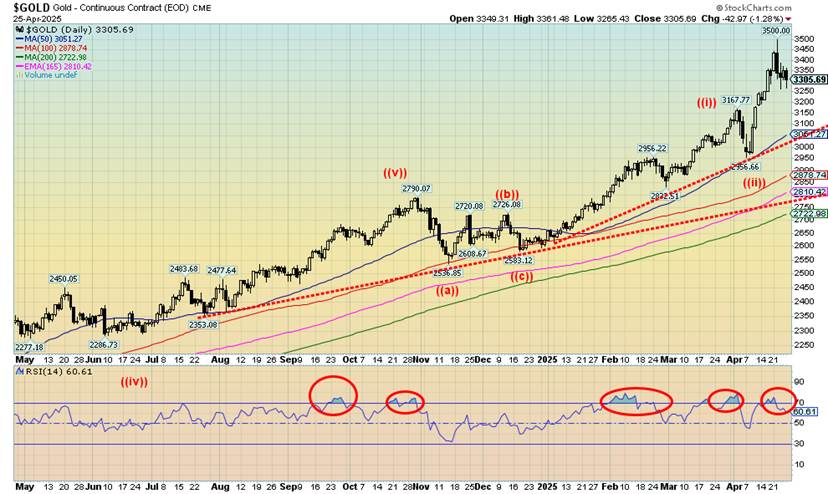
How do you read this week’s action for gold prices? Once again, we saw a new all-time high for gold, this time getting over $3,500, a number unheard-of only a year or two ago. But all the volatility with on-again, off-again tariffs and the ever-changing mind of President Trump sparked the spike, then a scary reversal. No, the reversal was not a key reversal week; meaning, new all-time highs, a collapse below the low of the previous week, and a close below the previous week. Instead, it left what we call a huge doji candlestick on the weekly charts. Meaning, we made a high a low and in the middle with the open ($3,348) and close ($3,319) close to each other. That normally signals a hesitation but not a potential major top.
However, the pattern rarely signals a major top. Our key point to watch becomes $2,950 as we would not want to see that level broken. That would signal to us that we may have made a significant top. Support can be found down to the $3,250 and then $3,050. A 10% or so correction is not unusual. We are coming down from overbought levels and a period of eurphoia for gold. Buy the rumour: continued tariffs, firing of Powell, inflation from tariffs, global recession. Sell the news: tariffs keep changing, trade deals are being struck (but no evidence), Powell is not being fired, inflation is to be determined, and the global recession is not yet here. Therefore, take profits and sit on the sidelines.
Gold was down 0.6% on the week after all the gyrations. For a change, silver outperformed, gaining 1.6%. Platinum can’t seem to find its way and was up a tiny 0.2%. Palladium fell 2.3% but copper rose 3.0%. The gold stocks wavered and fell with the Gold Bugs Index (HUI) down 2.6% and the TSX Gold Index (TGD) off 3.7%. The HUI made 52-week highs before reversing.
We expect that gold should continue higher. But we are moving into a seasonal period where gold tends to be weak. This weak period can last into June/July before another advance gets underway. Only new all-time highs for gold, new highs for silver over $35, along with new highs confirming from the HUI and TGD will tell us the current correction is over. Otherwise, be prepared for at least a soft period with the potential for a 10% correction for gold. That would take us to $3,150. But we don’t want to see a break of $2,950 as that would signal a steeper correction and even a bear market.
Source: www.stockcharts.com
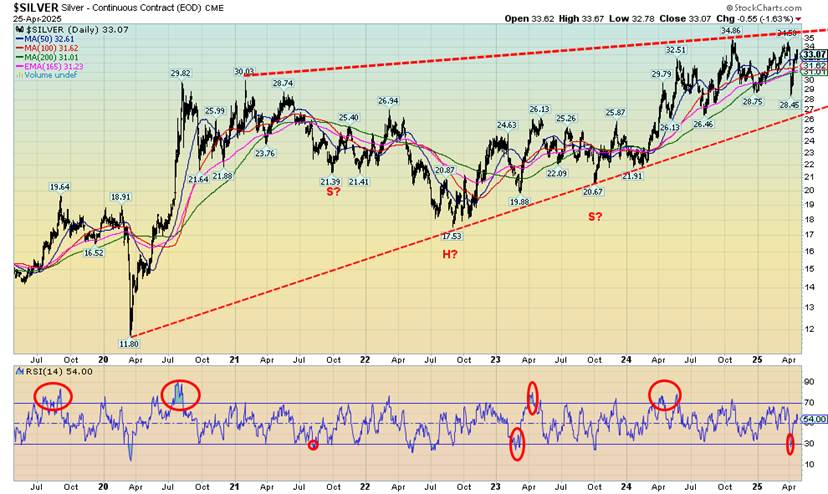
For a change, this past week silver took a lead role, gaining 1.6% to gold’s loss of 0.6%. Silver has been very frustrating. An industrial metal as well as a monetary metal, it is governed by the huge futures market that is three, four times the size of the physical market. While gold consistently makes new all-time highs, silver can’t even take out recent highs near $35. We had noted before the potential head and shoulders pattern that appeared to form in 2021/2022. But it was a very awkward one and may not fufill its look the way we would like.
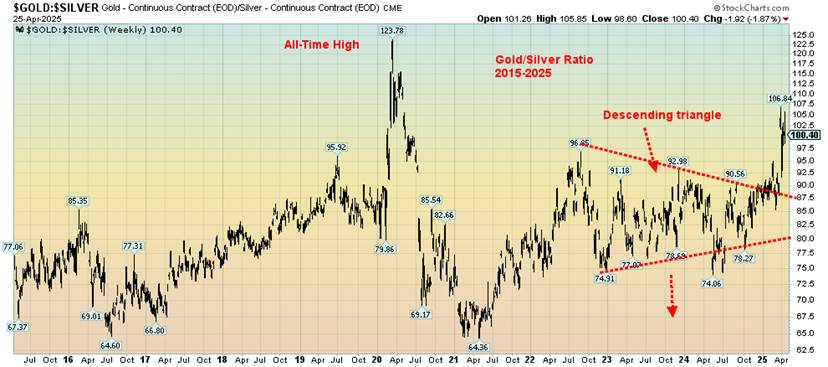
Why? Because the right shoulder was below the left shoulder when it should be the other way around. The targets appeared to be up around $38/$39, but so far all we’ve managed is a high of $34.86. Worse, we appear to be forming a potentially bearish huge ascending wedge triangle. It breaks down under $27. Could it happen? Yes. Will it happen? That’s less clear as the going forward outlook remains bullish. Taking out $35 would go a long way to giving the bulls the upper hand. The gold/silver ratio hit a recent high of 106.84, marking only the second time the ratio went over 100.
In the 2020 pandemic crash, the gold/silver ratio hit an unheard-of level of 123.78, then when the rally got underway it fell to 64.36. An incredible run. In 2011, at the top of the market for precious metals it fell to 31.14. That was when silver hit $50 and gold $1,900. But since then it has been all gold and we’ve gone through 10 years of gold outperforming silver. In nature, the gold/silver ratio is supposed to be around 15%. The Romans set the ratio at 12:1. Our suspicion is that the ratio may have seen its top. But confirmation is needed with silver breaking out over $35 and the ratio falling below 80.
Gold Silver Ratio 2015-2025
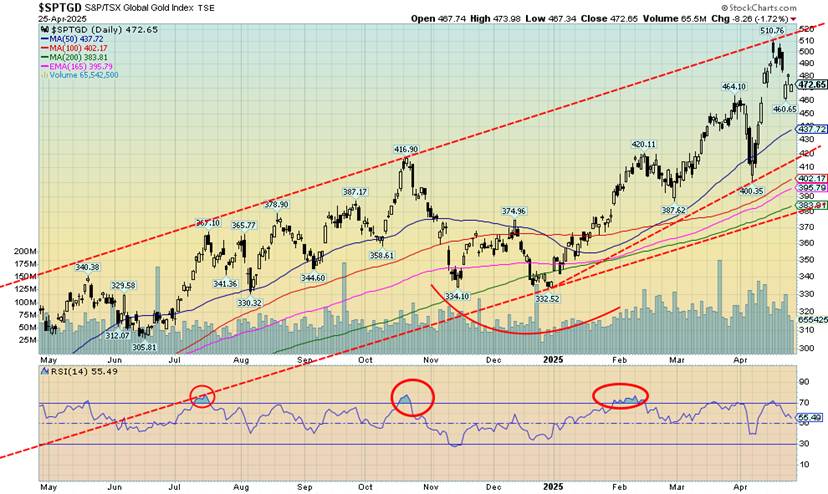
It probably is no surprise that, with the gyrations of gold prices this past week, profit-taking took hold with the gold stocks. This past week the TSX Gold Index (TGD) fell 3.7% while the Gold Bugs Index (HUI), despite making new 52-week highs, fell 2.6%. A key reversal week? That’s a hard call as we did make new weekly highs followed by the downside reversal and lows below the previous week.
However, we did not close below the lows of the previous week so it was a reversal but probably not a key reversal. Nonetheless, it does signal a possible correction period for the gold stocks. Despite the fall, the TGD remains up 40.3% on the year while the HUI is up 41.2%. A normal 10% correction would leave both indices still quite positive on the year. During the 2009–2011 bull market there were four corrections over 10% and up to 25%. Yet the HUI rose 325% during the period.
Nonetheless, that channel line near 420 or, being more optimistic, the 50-day MA near 437 could easily beckon. A reminder that the correction that took place last year between October high and the December saw the TGD lose 20%. Even that swift drop in March 2025 saw the TGD fall almost 14%. It then quickly recovered. Since the pandemic low in March 2020 the TGD has gained 173%. From the last major low in 2015 the TGD is up 313%. But it has been very choppy with sharp gains in 2016 and 2019/2020, followed swiftly by big drops in 2017/2018 and 2020/2022. Such is the nature of the gold stocks. A drop now below 460 most likely could send us down towards 420/430. Major support lies near 385 with interim support near 400.
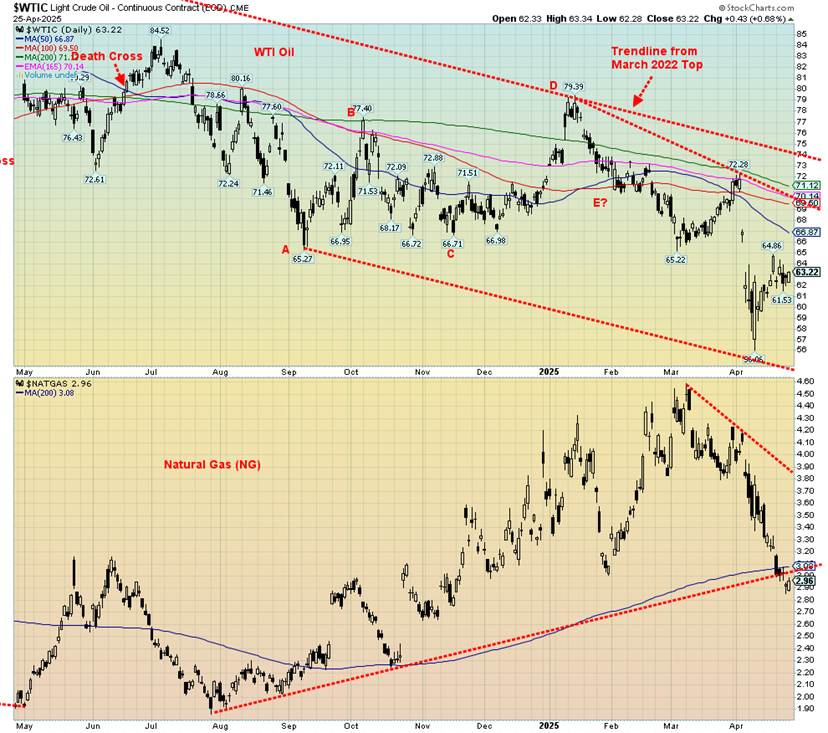
Whither oil prices? They have bounced back and forth, fearful over the impact of the trade wars and an impending recession, but also listening to threats to attack Iran if the U.S. and Iran can’t come to an agreement over nuclear weapons. This past week saw WTI oil fall 1.9% while Brent crude was down 0.9%. More than ample supplies plus the uncertainty of demand due to the trade wars sent natural gas (NG) prices tumbling as well.
NG at the Henry Hub fell 8.9% while NG at the EU Dutch Hub was down 9.6%. None of that seem to bother the energy stocks as the ARCA Oil & Gas Index (XOI) rose 2.3% while the TSX Energy Index (TEN) was up 1.3%. No, not a lot, but up in the face of falling oil and gas prices that’s a positive. Oil stocks a harbinger?
NG now appears to have broken down and we don’t see any strong support emerge until down around $2.30/$2.40. Breakout is way up around $3.90. NG prices look done for the time being. Oil prices are struggling to rise and the past week’s action was a consolidation of the recent jump. Still, the bottom of that channel near $55 could still beckon. There are a lot of gaps to fill as a result of that swift drop earlier. Effectively, it has created an island. The pattern can sometimes be bullish if a low or bearish if a high. But only a gap up that swiftly takes us above $70 would suggest the low is in. A big breakout could occur over $74.
__
(Featured image by Live Richer via Unsplash)
DISCLAIMER: This article was written by a third party contributor and does not reflect the opinion of Born2Invest, its management, staff or its associates. Please review our disclaimer for more information.
This article may include forward-looking statements. These forward-looking statements generally are identified by the words “believe,” “project,” “estimate,” “become,” “plan,” “will,” and similar expressions, including with regards to potential earnings in the Empire Flippers affiliate program. These forward-looking statements involve known and unknown risks as well as uncertainties, including those discussed in the following cautionary statements and elsewhere in this article and on this site. Although the Company may believe that its expectations are based on reasonable assumptions, the actual results that the Company may achieve may differ materially from any forward-looking statements, which reflect the opinions of the management of the Company only as of the date hereof. Additionally, please make sure to read these important disclosures.
Copyright David Chapman 2025
David Chapman is not a registered advisory service and is not an exempt market dealer (EMD) nor a licensed financial advisor. He does not and cannot give individualised market advice. David Chapman has worked in the financial industry for over 40 years including large financial corporations, banks, and investment dealers. The information in this newsletter is intended only for informational and educational purposes. It should not be construed as an offer, a solicitation of an offer or sale of any security.
Every effort is made to provide accurate and complete information. However, we cannot guarantee that there will be no errors. We make no claims, promises or guarantees about the accuracy, completeness, or adequacy of the contents of this commentary and expressly disclaim liability for errors and omissions in the contents of this commentary. David Chapman will always use his best efforts to ensure the accuracy and timeliness of all information. The reader assumes all risk when trading in securities and David Chapman advises consulting a licensed professional financial advisor or portfolio manager such as Enriched Investing Incorporated before proceeding with any trade or idea presented in this newsletter.
David Chapman may own shares in companies mentioned in this newsletter. Before making an investment, prospective investors should review each security’s offering documents which summarize the objectives, fees, expenses and associated risks. David Chapman shares his ideas and opinions for informational and educational purposes only and expects the reader to perform due diligence before considering a position in any security. That includes consulting with your own licensed professional financial advisor such as Enriched Investing Incorporated. Performance is not guaranteed, values change frequently, and past performance may not be repeated.


Vexuvo Secures €7.4M to Boost Agrivoltaic and Storage Growth
Vexuvo and the Sella Group have reached 7.4 million euros in total funding to support renewable energy growth. A new...


CAR-T Cell Therapy Induces Remarkable Remission in Patient with Multiple Autoimmune Diseases
A 47-year-old woman with three severe autoimmune diseases received CAR-T cell therapy at a German hospital, achieving one-year remission without...


Markets Rebound Briefly as War Risks and Inflation Persist
Artemis II’s safe return contrasted with failed peace talks, ending hopes of a sustained ceasefire. Markets briefly rallied on optimism,...

Dow Jones Near Highs Amid Low Volatility but Caution Signals Emerging
The Dow Jones recently closed near record highs after only a mild 10% correction, suggesting market strength. However, a few...


The TopRanked.io Weekly Digest: What’s Hot in Affiliate Marketing [LiveChat Affiliates Review]
Quick Disclosure: We’re about to tell you how LiveChat Affiliates run a top-notch affiliate program. And we really mean it....
 |
|
 |  |
 |
|
-
 Crypto4 days ago
Bitcoin Leads Crypto Rally as Iran Ceasefire Boosts Markets
-

 Africa2 weeks ago
Casablanca Climbs the Global Financial Ranks
-
 Biotech2 hours ago
CAR-T Cell Therapy Induces Remarkable Remission in Patient with Multiple Autoimmune Diseases
-

 Business1 week ago
Dow Jones Rebounds as Markets Shrug Off Iran Conflict