Business
The Dow Jones Teeters Below Highs as Market Uncertainty Grows
The Dow Jones rebounded to a BEV of -2.61%, but remains below its last all-time high from December. A decisive drop below -10% could signal a downturn. Financial indexes show divergence, with concerns over commercial real estate mortgages looming. Gold remains strong, but markets are fragile. A crisis may unfold as 2025 progresses.

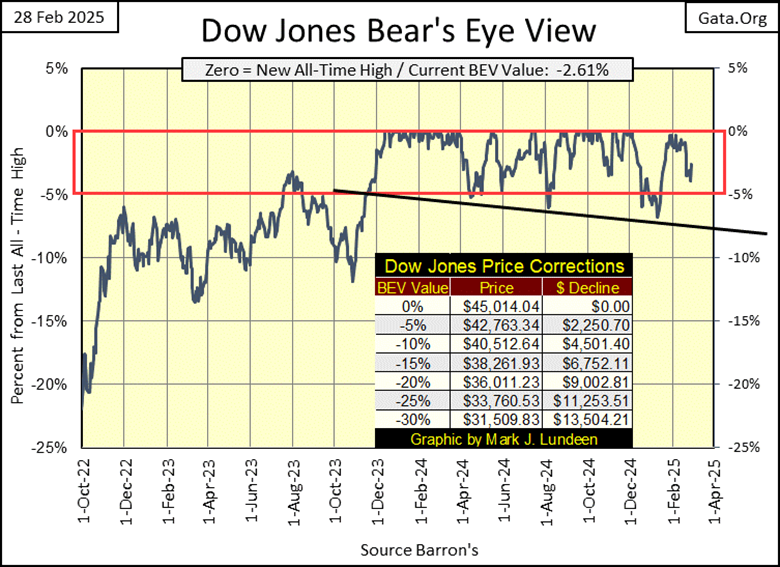
Last week, we were wondering whether the Dow Jones could manage staying above its BEV -5% line in its BEV chart below. This week it closed with a BEV of -2.61%, a nice advance above last week’s close.
Still, the Dow Jones’ last BEV Zero (0.00% = New All-Time High) in its BEV chart below, occurred on December, 4th, three months ago. That seems like a long time for the Dow Jones to be marching in place inside scoring position; daily BEV closings between -0.01% and -4.99%. If it makes you feel any better, in January the Dow Jones closed a few days below its BEV -5% line, before once again closing less than 5% from its last all-time high.
Is it time to call a top for the Dow Jones? That its last BEV Zero (December 4th, 45,014) will be its Terminal Zero (TZ = last all-time high of a major market advance), of an advance that began in August 1982, that took the Dow Jones from less than 800, to over 45,000, in forty-three years?
That may prove to be the thing to do, as 2025 now turns from February to March. What I’m going to do is simply wait until the Dow Jones finally closes, decisively below its BEV -10% line below, before I get too bearish. Looking at the table on the chart, that would be decisively closing below 40,512. When the Dow Jones finally sees some BEV values below -6%, or -7%, you may want to sell off a good portion of your holdings, to lock in whatever profits, your position currently holds.
Next is my table for my major-market indexes’ BEV values. No BEV Zeros this week, and the week closed with only ten of these indexes in scoring position, within 5% of their last all-time high. What is a bit odd is seeing the NYSE Financial Index close the week at #1 below, only 0.08% from making a new all-time high, when the NASDAQ’s Banking Index closed the week at #20. Don’t tell me the NYSE Financial Index doesn’t have any banks in their mix of financial companies, as I’m sure it does.
So, what to think of this? Well, I do think it’s odd, and I’m willing to leave it at that. One thing to note; the NYSE Financial Index looks at stocks trading at the New York Stock Exchange, while the NASDAQ Banking Index looks at banks trading at the NASDAQ.
I doubt there is much of Wall Street itself included in the NASDAQ Banking Index, which I assume are mostly regional banks. Regions currently not doing as well, as is Wall Street, or so I’m inferring from the difference in performance between these two financial indexes.
One pending problem for banks, wherever they trade, seems to be nonperforming mortgages on commercial real estate. The bogus covid crisis forced many, if not most businesses, to allow their employes to work at home, via the internet. How much office space now lays empty because of that? Abandoned office spaces with a mortgage on it.
It seems this issue with abandoned office space, may come to a crisis sometime in 2025. If so, we’ll see the valuations for the NASDAQ Banking, and NYSE Financial indexes begin to deflate, as 2025 moves on to summer.
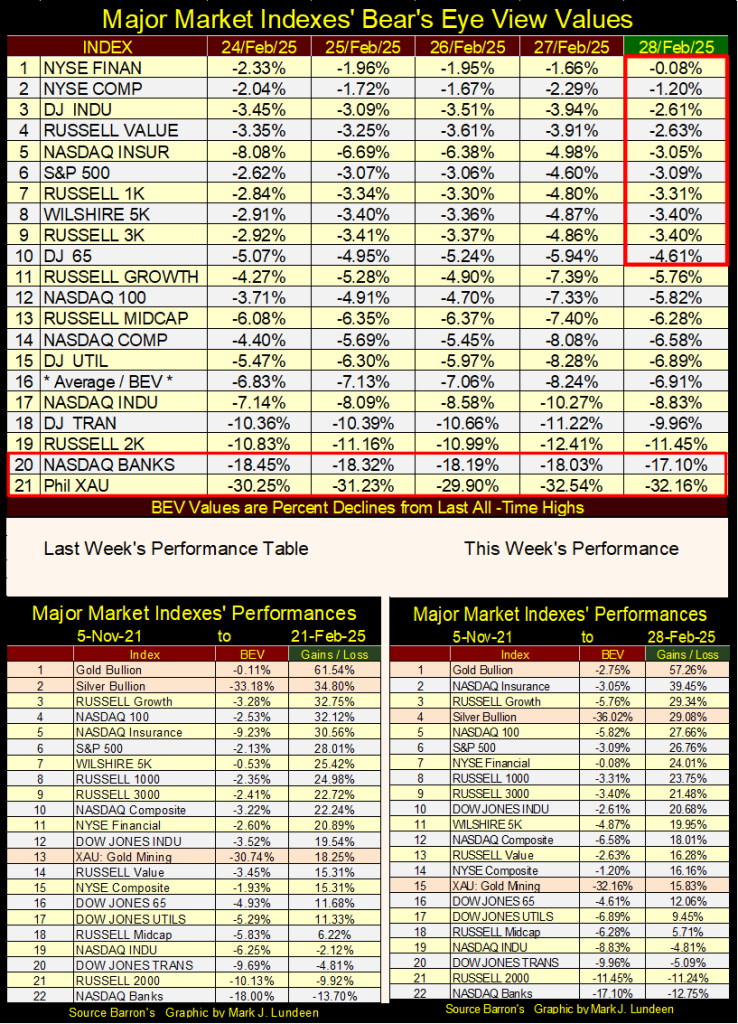
Looking at the performance tables above, gold remains at the #1 position in the table, as it has for a long time. But this week, gold was down a few percentage points for the week, as was everything else.
What is so important about 05 November 2021, the day I use as a basis in these performance tables? That week, the first week of November 2021, was the top of the Post March 2020 Flash-Crash Boom. The market advance that followed Chairman Powell’s multi-trillion dollar, Not QE#4 twenty months earlier.
Below is what that week looked like in BEV terms. For the entire week, these indexes were more likely to close at a new all-time high, than not. Except for the XAU, which held steady at #21 below.
The truth is, when seeing such extremes in bullishness, as seen below, it’s an excellent time to sell into market demand. The bulls wanted your stocks, which in November 2021, they were willing to pay top dollar for.
As it turned out, the stock market had more to the upside, following this week in early November 2021, as seen in my weekly performance tables above.
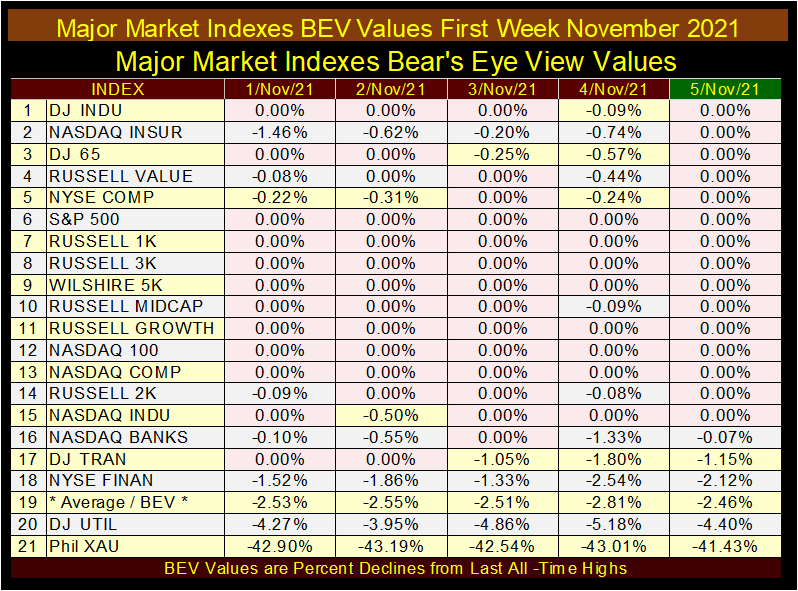
However, to answer the question I asked above, the reason I use 05 November 2021 as a basis for my performance tables, is because on that Friday, fifteen of these major market indexes closed at a new all-time high, while the remaining indexes closed well inside scoring position; BEV ranging from -0.01% to -4.99%.
On that fateful Friday’s close, the only index seen above that wasn’t flying high from the intoxicating flow of monetary inflation from the FOMC, were the gold and silver miners in the XAU (#21), down over 40% from its last all-time high.
I constructed the table below to show how far the stock market has advanced since some key bear-market bottoms;
- NASDAQ High Tech Bust, October 2002,
- March 2020 Flash Crash.
Note, not a Bear’s Eye View (BEV) value in either table, but these indexes’ actual published dollar values, and a factor for their performance.
For the table below on the left, on the close of 09 October 2002, “high-tech” was just another dirty four-letter word to most investors. The losses sustained by investors on the NASDAQ were crushing. The NASDAQ Composite was down by 78% from its highs of two and a half years before, as the NASDAQ 100 was down by 83% from early 2000.
What was there to like about investing in high-tech at the NASDAQ? In October 2002, it was hard finding anything good said by “market experts” about the NASDAQ. But here in February 2025, we see the virtues of buying low, for instance; the lows of October 2002.
This week, for every $1.00 invested in October 2002;
- NASDAQ 100 is now worth $26.17,
- NASDAQ Composite is now worth $17.12.
Proving a point frequently made by the old timers of market commentary; knowing when to buy is important. So, when is the best time to buy? In the 140-year history of the Dow Jones, the best time to buy has always been when everyone else is selling during a market panic.
Oh, don’t buy during the selling panic itself; wait a bit for the market to bottom. Remember; if you buy within 10% of the market’s bottom, you did good! As is selling within 10% of a market’s top, which is something we must be close to now, or so I would think.
That is why I’m always saying; for money already in the market, as long as the Dow Jones remains in scoring position, and until it breaks below its BEV -10% line, let your profits ride; don’t be in a hurry to sell. But for new money coming into the market, this is a horrible time for it to be exposed to the market. At this time, its best for new money be invested in gold or silver bullion.
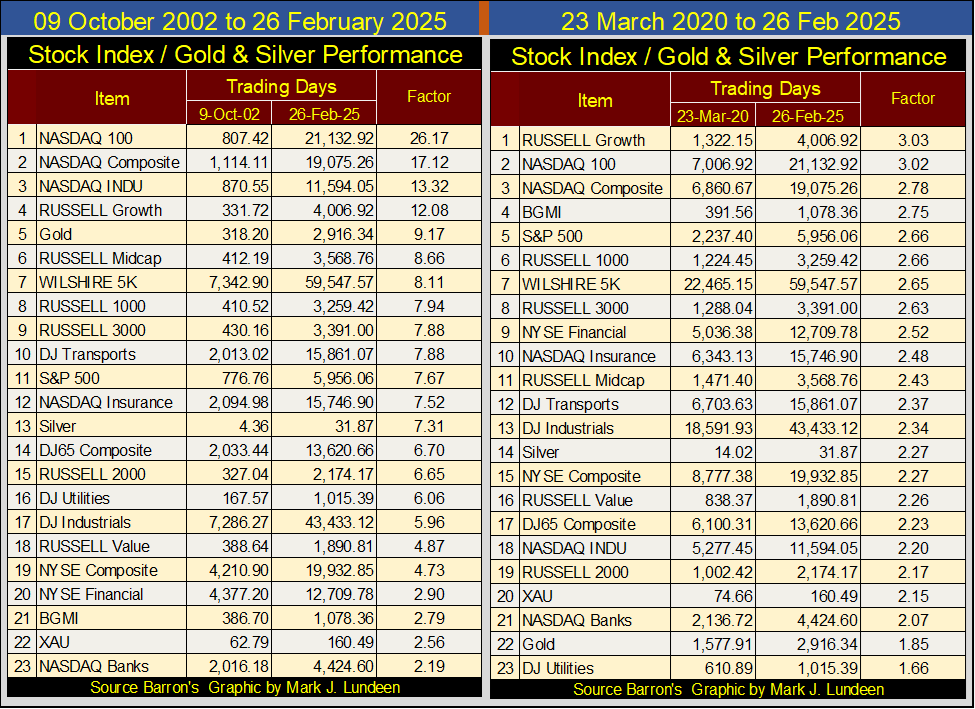
For the table above on the right, we see the advances of these indexes from the bottom of the March 2020 Flash Crash; something that happened five years ago. Most of these indexes are up by over 200% in the past five years. I don’t know about you, but I’m a bit disappointed by these little gains. I was thinking these indexes would have advanced more since March 2020.
But before August 1971, before the US took its dollar off the Bretton Wood’s $35 gold peg, major indexes such as these, didn’t advance by even 100% in only five years. That they do today, that someone like me thinks a five year, 200% advance as subpar, is only because the nature of the stock market has changed greatly since 1971.
Today, market valuations are set by that Great Engine of Inflation: The Federal Reserve System, that can, and has flooded the market with trillions-of-dollars of monetary inflation, as they did in the Spring of 2020.
In the quote below, this was early in the Greenspan Fed, where the markets were still getting over the shock of the October 1987 Flash Crash. Fed Governor Heller was comforting the market by assuring it, that the Fed is in control.
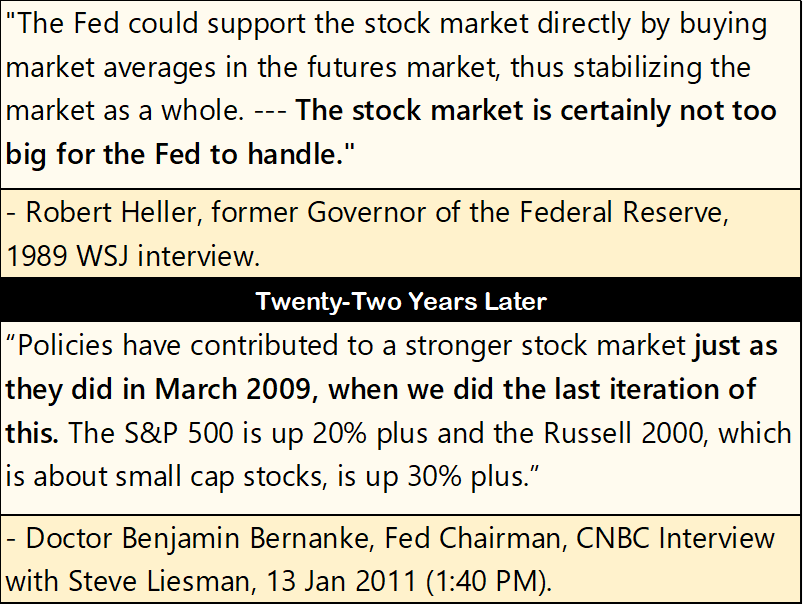
The above quote from Fed Chairman Bernanke, is three years after the Sub-Prime Mortgage Debacle, where he personally implemented his QE#1. In January 2011, he was implementing his QE#2, to further “stabilize market valuations.”
If I’m always writing about the stock market, within the context of the FOMC in the background, its because this is how it is. Having prices fixed by a free market on Wall Street, is something from long ago, not today.
Should the market crash in 2025, that is only possible should the Federal Reserve allows it to, most likely as a response to President Trump attempting to make the Federal Government honest again. Something you can be sure the Federal Reserve, with its license to print as many dollars as it wants, would never approve of.
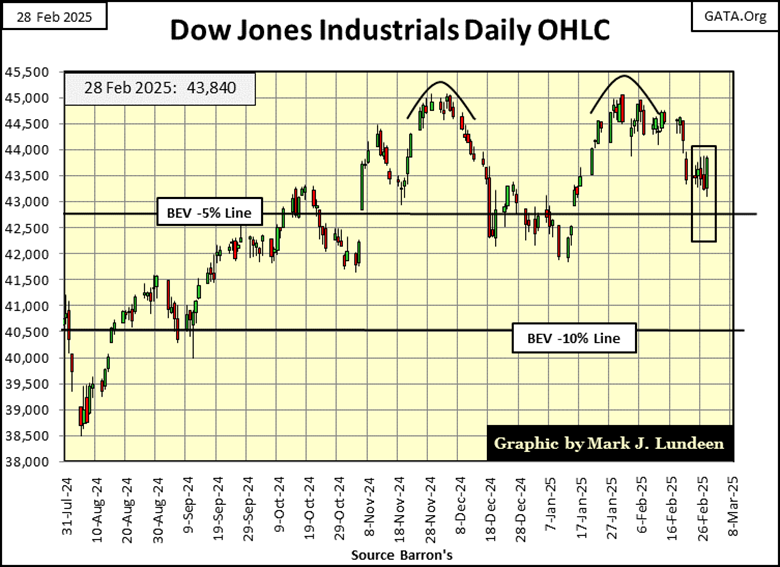
Here’s a chart of the Dow Jones in daily bars. The Dow Jones is currently dominated by a very bearish double top. In the four weeks since its second top, the Dow Jones has seen some market weakness, but has managed to remain in scoring position, above 42,762.
What happens from here? Lots of possibilities. The one possibility I’m favoring is the Dow Jones in the weeks and months to come, will once again see new all-time highs. As it’s been in scoring position since November 2023, fifteen months where the Dow Jones has made fifty-five new all-time highs, I have to figure this advancing trend still has some room to the upside.
What could change that, would be seeing the Dow Jones break below its BEV -10% line (40,512), in the chart below. But until that, I’m bullish on the stock market.
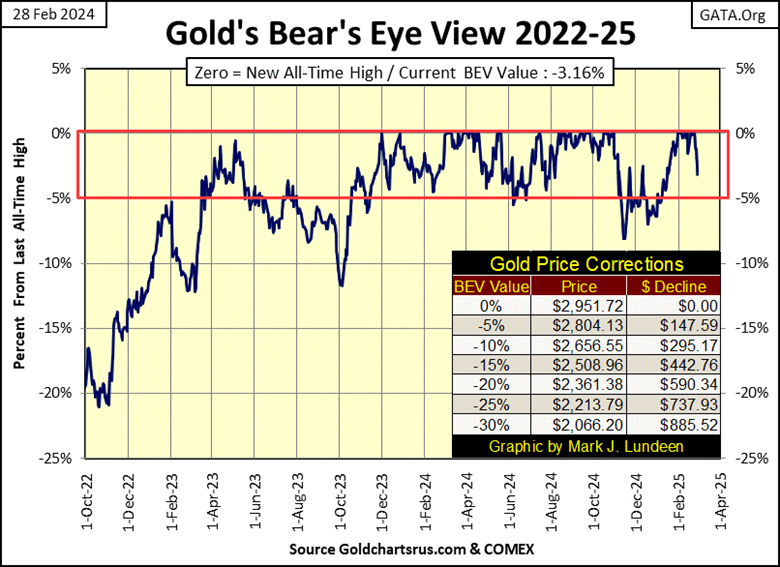
Last week, it was the Dow Jones that appeared to be making a plunge to lower levels. This week, it’s gold’s turn to add some drama to the market. In both cases, the question to ask is; did it close within scoring position? In both cases, for the Dow Jones last week, and gold this week, the answer is; yes, it did.
That is a comforting thing to know, as this week gold saw day after day, big down days of unrelenting selling. But for all that, gold in its BEV chart below remains bullish at this week’s close.
Next is a chart plotting gold and silver indexed to 1.00 = 02 January 1969. Indexing these market series allows us to follow them as in a horse race, and silver is far behind gold in this race. But this chart is wildly bullish for silver.
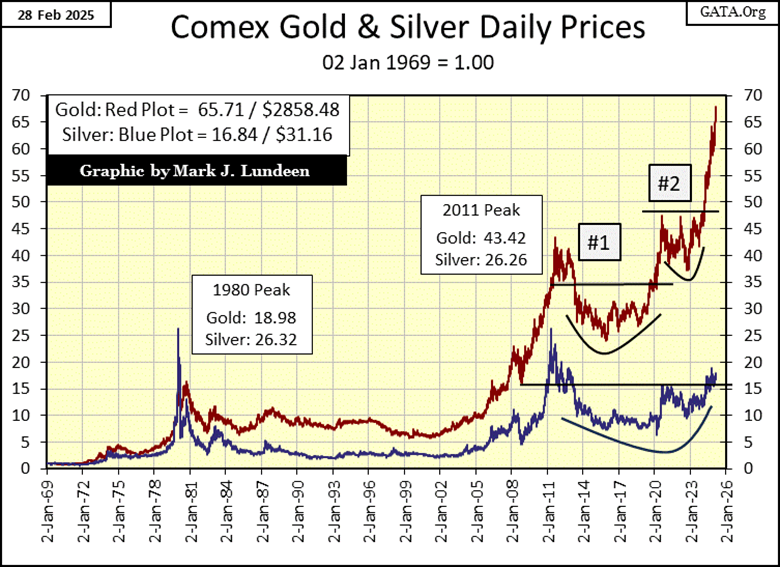
I’m positive for silver, because of the technical formations seen in this chart, something I call a Bowl & Breakout formation. Gold has seen two of these formations since 2011, where following a major decline, gold struggles to break above a line of resistance. But once that line of resistance is taken out, gold sees a very nice advance.
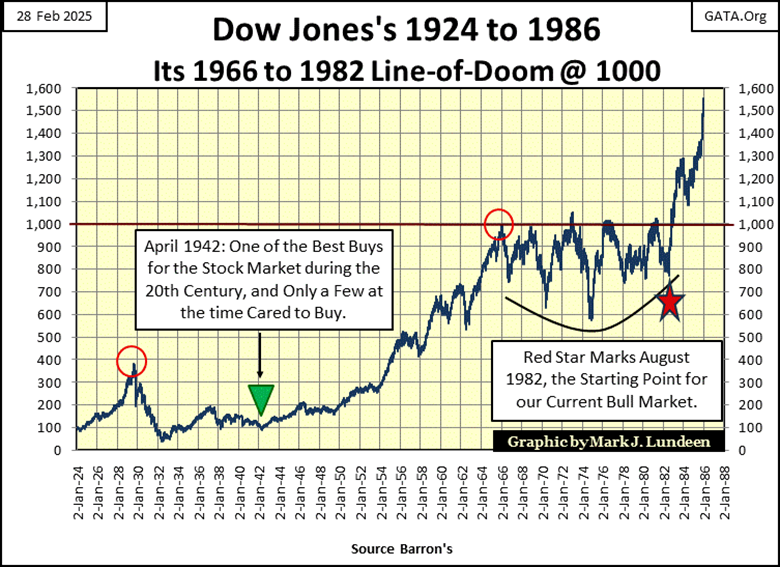
The Dow Jones began its current bull market from such a technical formation. In the chart below, from 1966 to 1982, the Dow Jones struggled with breaking above 1,000. For sixteen years, the Dow Jones on five occasions, failed to break above, and stay above 1,000.
Then in August 1982, with the Dow Jones trading below 800 (Red Star), it made its sixth attempt to break above 1,000, but this time it stayed above 1,000 for the next forty-three years. This week, the Dow Jones closed at 43,840, thanks to the efforts of the FOMC, keeping “market valuations stabilized.”
Going back to silver’s bowl and breakout formation (two charts above), silver’s last all-time high is still from 1980. For the past forty-five years, it hasn’t been able to close above $50, and stay above $50, though it has tried.
But the day is coming when silver will break above, and stay above its current line of resistance at $50. When it does, I expect what follows will be quite a show. People will be happy to have some Silver Eagles in hand, the more the better.
Last week, with its 15-count at a +7, gold was overbought. I thought it may stay that way for a while longer, I was wrong. On Monday, gold made a new BEV Zero, just before it saw four consecutive down days, taking gold’s 15-count down to a neutral -1.
Looking at gold’s step sum table below, there is nothing bearish to be seen. Gold for over a month was overbought, as it continued to make new all-time highs (Blue BEV Zeros below). That this week gold would sell of after all that, is something to be expected.
Now what? Does gold take a well-deserved breather, after making ten new all-time highs in less than a month’s trading? In the weeks to come, will gold begin seeing down days overwhelm its daily advances, taking its 15-count into oversold territory, down to -7, or more?
Or maybe, starting next week, gold resumes its bullish ways; seeing its daily advances overwhelm its daily declines, and more new BEV Zeros in the weeks and months to come, as its price soars far, far above $3,000 before the end of August.
Which will it be? I haven’t a clue. I’m content waiting to see what is coming for gold, and silver in the months to come. Though to be honest, I’d like to see gold trade for over $4000 an ounce before Christmas this year. That is only a 30% advance from gold’s last all-time high. If major stock indexes can advance by 30% in a single year, why can’t gold?
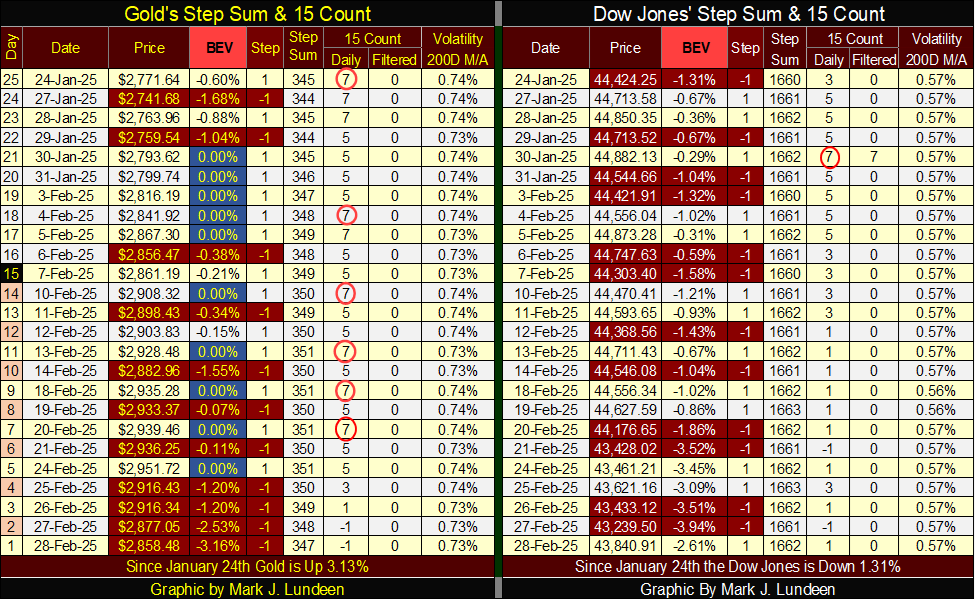
Taking a quick study of the Dow Jones’ side of the table above, we’re seeing what usually happens following a market becoming overbought, as with the Dow Jones’ +7 seen on January 30th. The market begins to correct for being overbought, by seeing declining days become as numerous, or actually overwhelm advancing days, exactly as seen above, for both gold and the Dow Jones.
But note, for all those down days the Dow Jones has seen since the end of January, its valuation is still firmly in scoring position; within 5% of its last all-time high, as seen in the BEV column. The Dow Jones in its step sum table above, is showing us some excellent market action.
Yes, I know its last all-time high was on December 4th, three months ago. But at this week’s end, looking at what we’ve seen above, I expect the Dow Jones will see some, maybe many additional BEV Zeros before 2025, comes to its conclusion.
Of course, should the Dow Jones break below its BEV -10% level, a daily closing of 40,512, or lower, I’d recommend exiting the market as soon as possible. At the close of February 2025, that is how I see it. A month from now, I may see things differently. But I don’t think that will happen.
__
(Featured image by LeeLoo The First via Pexels)
DISCLAIMER: This article was written by a third party contributor and does not reflect the opinion of Born2Invest, its management, staff or its associates. Please review our disclaimer for more information.
This article may include forward-looking statements. These forward-looking statements generally are identified by the words “believe,” “project,” “estimate,” “become,” “plan,” “will,” and similar expressions, including with regards to potential earnings in the Empire Flippers affiliate program. These forward-looking statements involve known and unknown risks as well as uncertainties, including those discussed in the following cautionary statements and elsewhere in this article and on this site. Although the Company may believe that its expectations are based on reasonable assumptions, the actual results that the Company may achieve may differ materially from any forward-looking statements, which reflect the opinions of the management of the Company only as of the date hereof. Additionally, please make sure to read these important disclosures.


FinTech Matures as AI and Infrastructure Drive the Next Growth Phase
Fintech markets are entering a mature phase, shifting from rapid growth to consolidation, specialization, and sustainable business models. Zurich and...


Bitcoin, and Ethereum Rise, While Cardano Enters Transition
Bitcoin and Ethereum posted modest weekend gains, supported by ETF inflows. A new proposal may protect Bitcoin from quantum threats....


Dow Jones’ Record Run Faces Early Signs of Potential Shift
Since November 2023, the Dow Jones has logged 95 all-time highs, rising 43% from 37,090 to 53,056 over 32 months—a...


Oil Surge, Weak Stocks, and a Potential Turn for Gold
Oil surged sharply, a trend supporting waste management and energy infrastructure firms like Secure Waste Infrastructure Corp., which reported higher...


Avant Devices Moves Toward Electric Wheelchair Kit Production with New Funding Drive
Murcia-based Avant Devices is seeking €260,000 in crowdfunding to launch mass production of its electric wheelchair conversion kit. The funds...
 |
|
 |  |
 |
|
-

 Africa2 weeks ago
Fes-Meknes Sees Strong Recovery in Cereal Production Thanks to Increased Rainfall
-

 Fintech5 days ago
Advanced Blockchain Under Pressure Amid Crypto Market Shifts
-

 Impact Investing2 weeks ago
ICSC Raises €500M Social Bond, Expanding Sustainable Investment Reach
-
 Fintech10 hours ago
FinTech Matures as AI and Infrastructure Drive the Next Growth Phase