Markets
Dow Jones Tests Correction Zone Amid Bullish Momentum and Bubble Concerns
The Dow Jones has slipped just below its 10 percent correction threshold after a two month decline, raising questions about whether it will rebound to new highs or signal deeper risk. While low volatility supports bullish momentum, concerns about a long term inflationary bubble persist, with potential upside limited compared to possible severe downside scenarios.

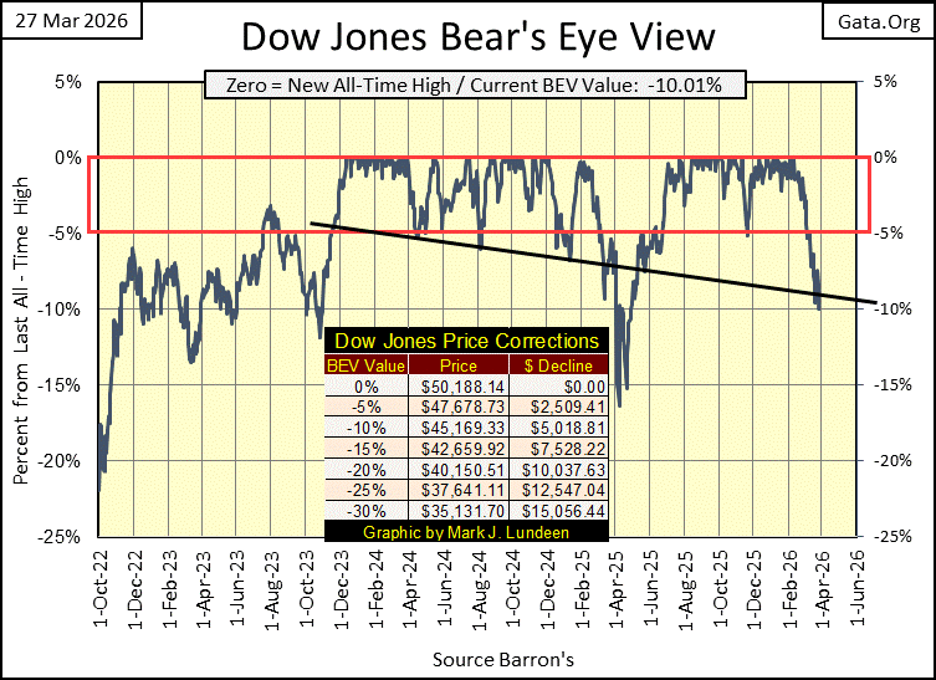
At this week’s close, the Dow Jones (my proxy for the broad stock market) closed below its BEV -10% line in its BEV chart below. Only 0.01% below its BEV -10% line, but below it nonetheless.
What comes next? Does the Dow Jones soon bounce back into scoring position, back above its BEV -5% line, and then on to new all-time highs? That is what the Dow Jones did last year, following its April decline below its BEV -15% line. Will it do this one more time?
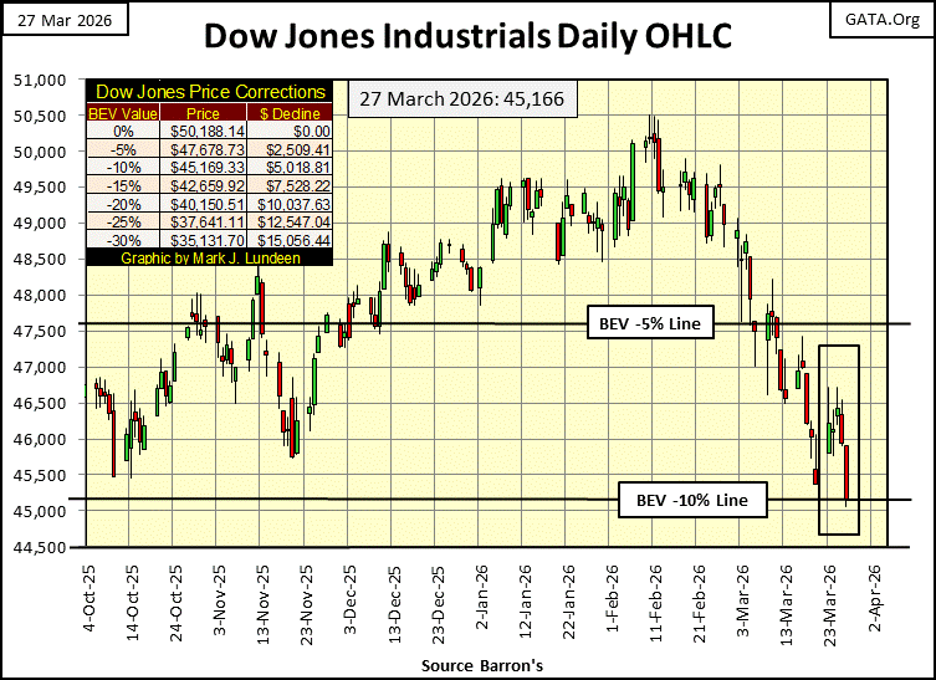
Let’s next look at the Dow Jones in daily bars, below. Since its February last all-time high, the Dow Jones below looks very heavy. Following a two-month decline, has now closed below its BEV -10% line.
For your information, this is exactly what a correction in a market advance looks like, a 10% to 25% pullback from an all-time high. And as we’ll see later on, daily volatility for the Dow Jones remains subdued, which is bullish.
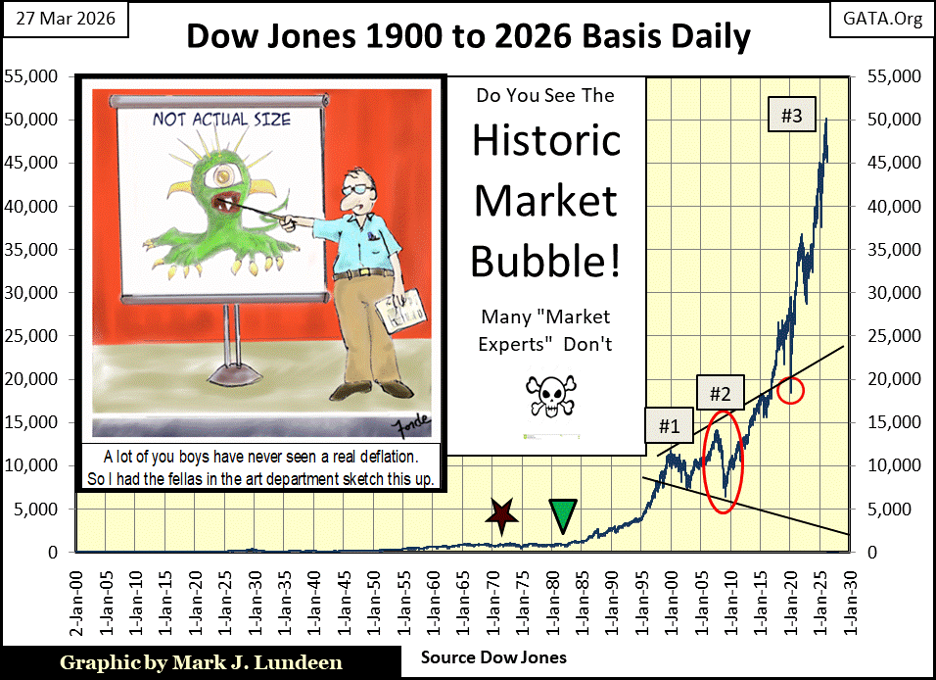
Still, in the back of my mind (chart below), I can’t get the following image out of it; that in March 2026, the Dow Jones remains near the top of a historic, inflationary market bubble. One day this inflationary boom, will go bust, but not necessarily in 2026.
But when? I’m not the guy to answer that question, whether the Dow Jones will see additional new all-time highs, possible above 60,000, or if in the years to come, will deflate below 10,000.
However, being a rational person, I have to consider the following; should the Dow Jones resume its advance, to above 60,000, that would be an advance of 33% or so from this week’s close. While a market decline that took the Dow Jones dividend yield back up to 6%, as was typical of all bear market bottoms before 1987, would see the Dow Jones deflate to 14,227, or a 71.65% bear market decline, based on its current dividend payout of $853.65.
Its been many years since this bull market advance began in August 1982, inverted green triangle above. Do you believe the next four decades will look anything like the last four? I don’t. In 2026, there is something compelling about taking a few steps back from this gambling table, taking some, or possibly most of your chips with you, and not returning until the Dow Jones sees a historic devaluation, say like a 70%, or greater bear market bottom. But until daily volatility once again rises, the bulls have the stronger argument in the stock market.
Now on to my table listing the BEV values for the major market indexes I follow. Note; the Wilshire 5000 is no longer listed, as it was discontinued. No new all-time highs seen this week, or last week. On Friday this week, only one index closed in scoring position, within 5% of its last all-time high, the Dow Jones Utility Average.
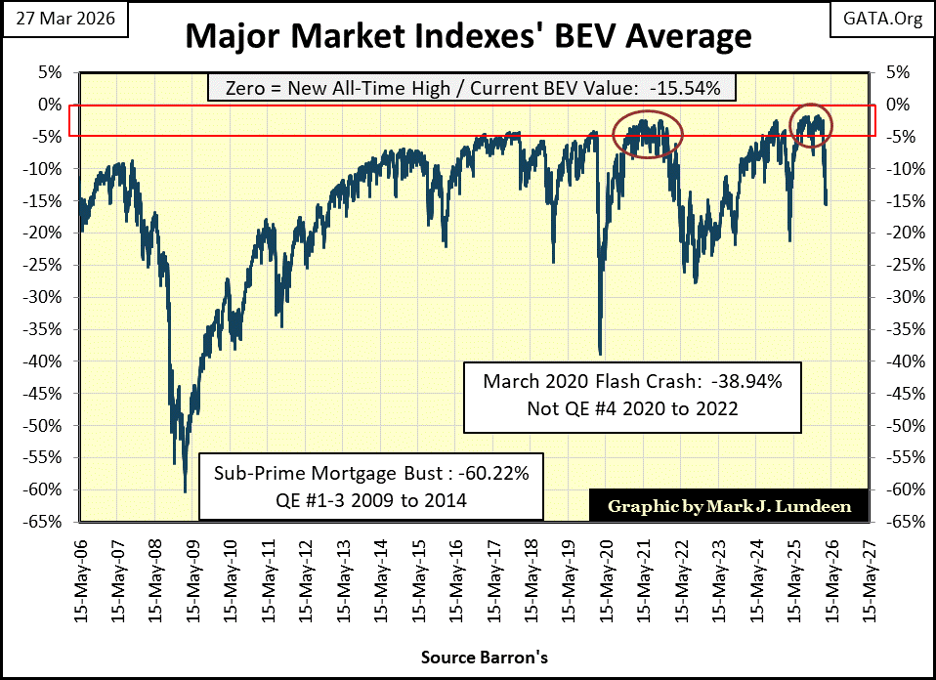
The Average BEV of these indexes (#16), is going down, closing the week at -15.54%. Last April 2025, a year ago this average BEV closed below its BEV -20% line, to then rebound to scoring position.
Should we expect the same for 2026? Until we see the Dow Jones once again make multiple days of extreme market volatility, days the Dow Jones moves +/- 2%, or more from a previous days closing price, I can’t get too short-term bearish on this market. But don’t confuse that for a buy recommendation from me, because I really don’t like this market.
When was the last time the Dow Jones saw a 2% day? A month ago, on February 6th when the Dow Jones advanced by 2.47% from the day before, making a new all-time high as it did. Before that, the Dow Jones hadn’t seen a 2% day since last May 12th, when it advanced by 2.81% from the day before.
Seeing the Dow Jones almost free from 2% days in the past year, isn’t the stuff of a Big Bear Market waiting just around the corner. So, I’m still thinking of new all-time highs for the Dow Jones, and other major market indexes before 2026 comes to its conclusion.
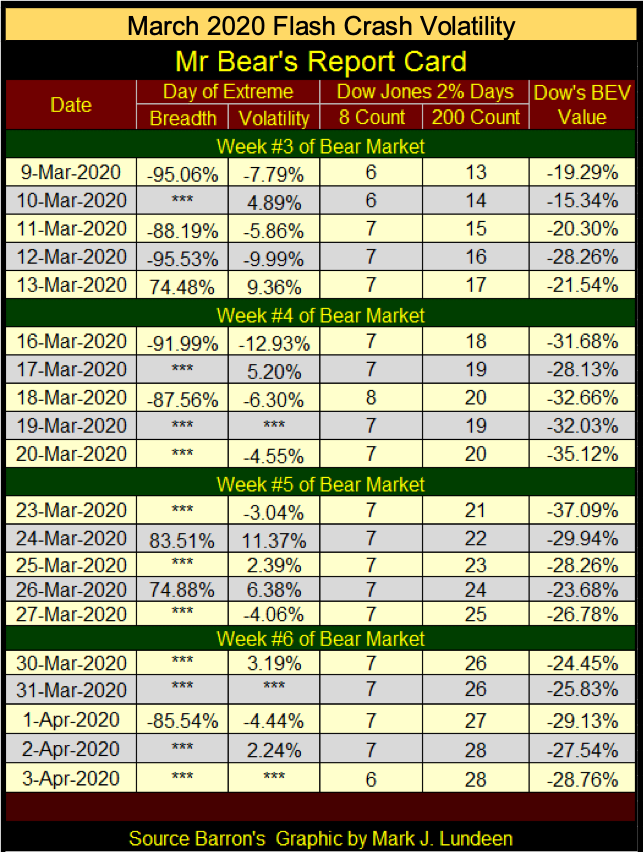
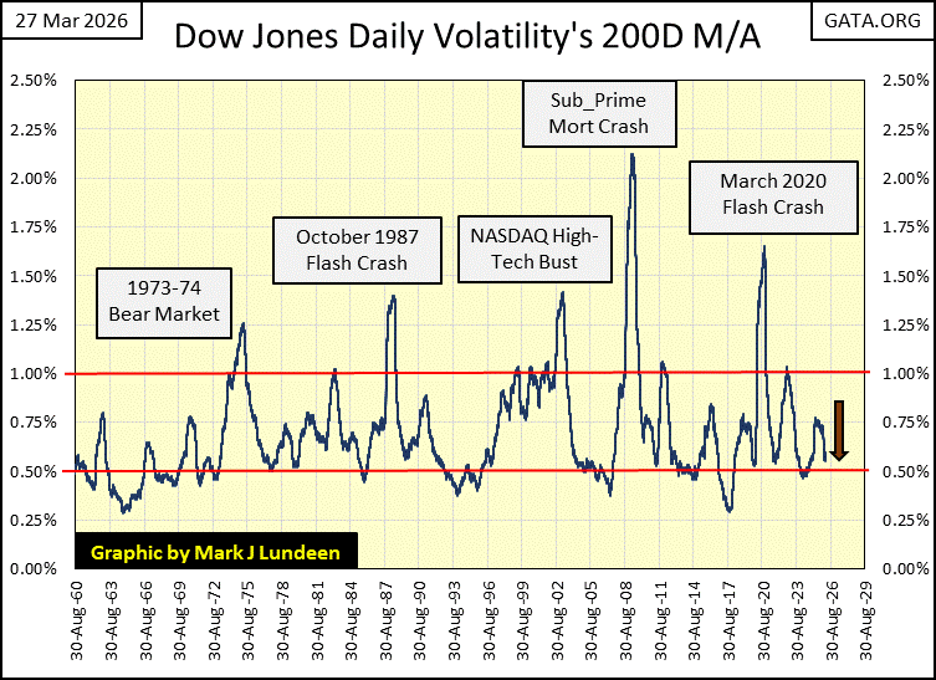
What a bear market decline looks like in terms of extreme volatility, in Dow Jones 2% days, can be seen during the March 2020 flash crash below. Look at the daily percentage moves from six years ago, moves both up and down in excess of 2% from a previous day’s close. With market volatility as we see below, no one needed me to tell them the market was crashing.
After a long delay, as promised, here is my table listing the BEV values for the major market indexes I follow. At this week’s close, half of them have declined 10%, or more from their last all-time highs. As of right now, I’m inclined to see the declines below as a market correction during a market advance, rather than the early stages of a big bear market. But should the Dow Jones begin to see days of extreme volatility, Dow Jones 2% days, I’ll change my mind very quickly.
Look at who is Tail-End Charlie (#20) in the table below. The gold and silver miners of the XAU have lost 25% of their valuation, from their last all-time high of exactly one month ago, on February 27th. Welcome to investing in gold and silver mining, probably the most volatile stock group in the market.
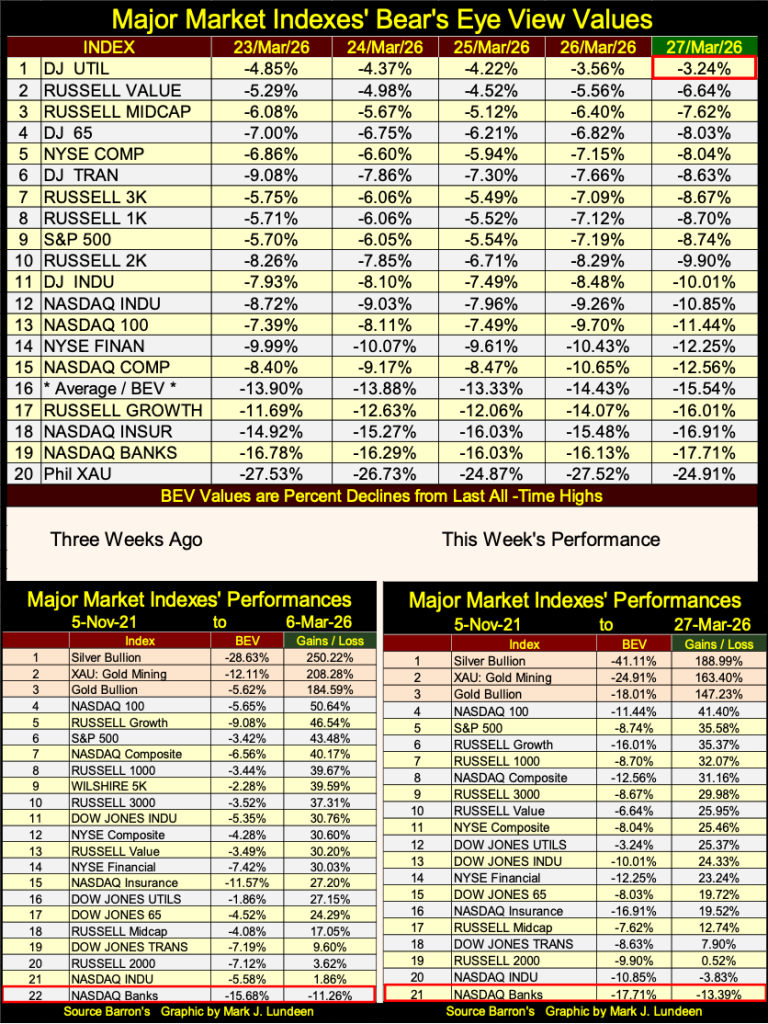
In this week’s performance table seen above, silver bullion, the XAU and gold bullion remain in the table’s top three spots. But from the table posted for 06 March 2026 (from three weeks ago), these precious metal assets have declined by a significant amount.
I question these declines, that have occurred while President Trump began bombing Iran in late February. Long ago, wars were a reason for gold and silver to go up, not down. But, it is what it is, and I believe these declines in gold, silver and the XAU are normal corrections in the precious metal assets.
Following the advance they’ve seen since May of 2025, they were due for a correction, as seen in the XAU below. Oh yeah, I’d prefer seeing an uncorrected XAU close above 600 this week, instead of the corrected 353 seen below.
But that isn’t how bull market advances work. Markets advance, attracting the unwary to risk their money based on their emotions, inspired by advancing prices. They then correct, go down to shake these weak hands off the advancing bull. That done, bull markets once again begin to advance. Market psychology is cruel.
It will probably take some weeks, maybe a few months before we see the advance in the gold and silver miners resume. But by June, or July, I’m anticipating the gold and silver miners in the XAU, will once again be making new all-time highs.
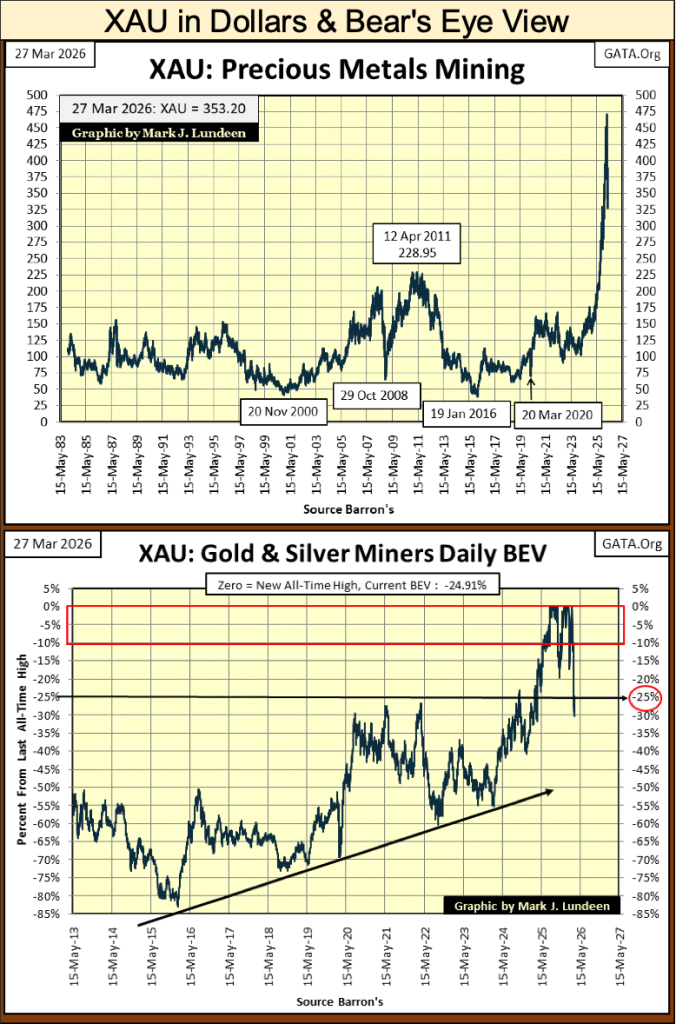
Looking at the XAU above, volatility in the XAU is much greater than it is for the Dow Jones. I think scoring position for the XAU should be above its BEV -10% line, in its BEV chart above. Anyway, how much farther can this correction go down? Maybe down to the XAU’s -40% line, and then maybe not.
Note; in 2015-2016, the XAU was down by 80% from its last all-time highs of April 2011. Up here in the market’s peanut gallery, where I currently reside, I have more than a couple of beers and hotdogs it won’t get that bad in 2026!
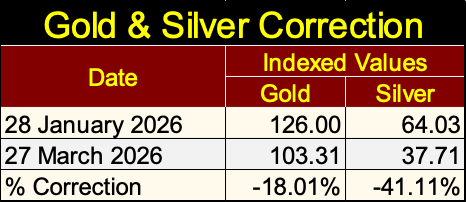
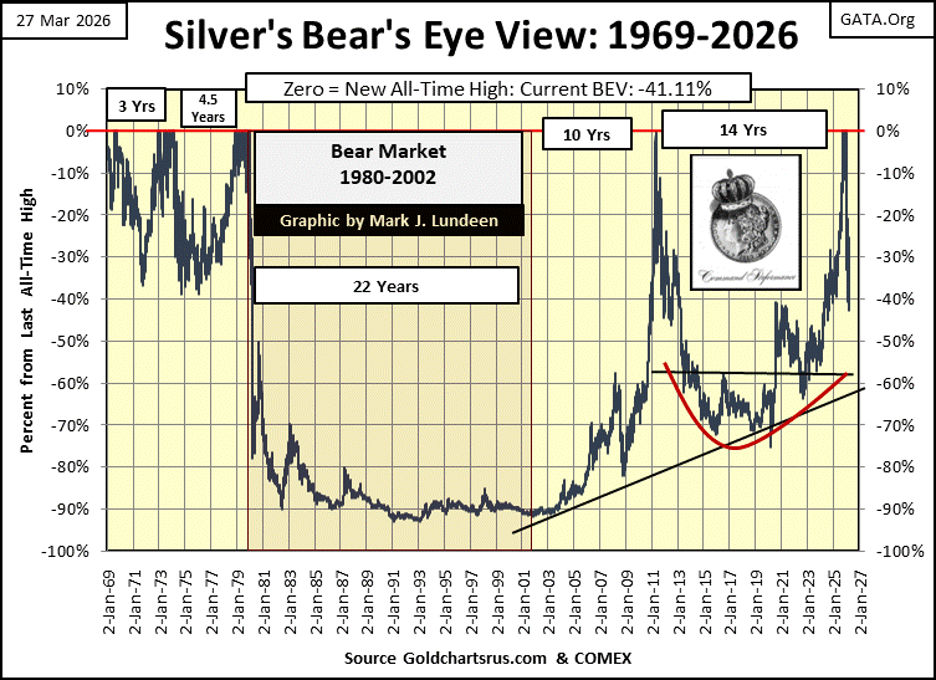
Below are the indexed values for gold and silver, going back to 1969. Both have corrected significantly from their last all-time high on January 28th of this year. But that is hard to see on this chart. On January 28th, gold’s indexed value was 126, and silver’s was 64. This week gold’s indexed value closed at 103.31, and silver’s at 37.71.
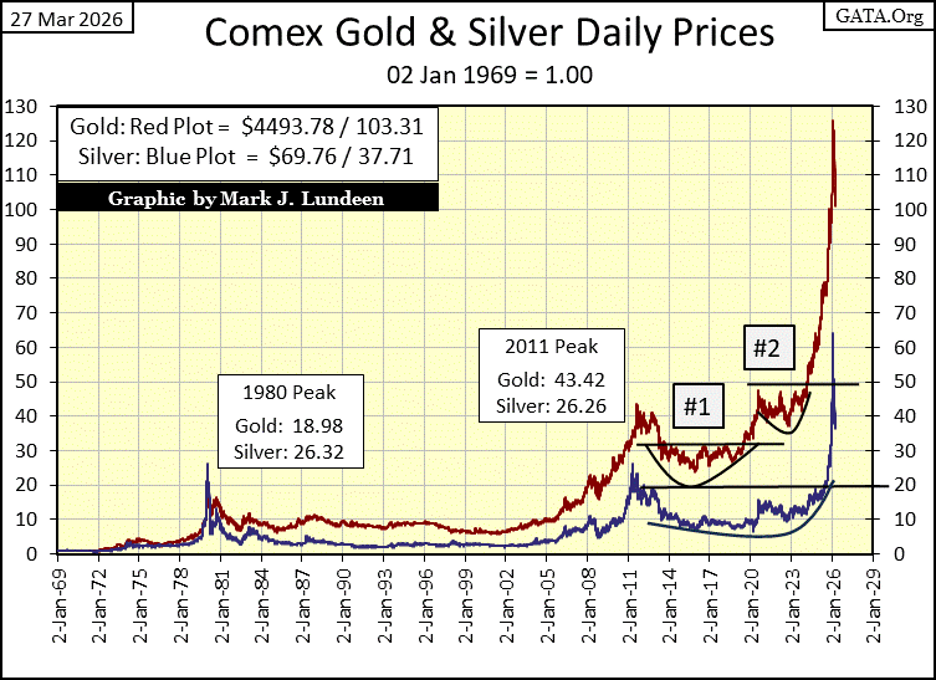
So, as seen above, and the table below, since late January gold has corrected by 18.01%, while silver has corrected by 41.11%.
Is this advance in gold and silver for real? Could the January 28th top in the old monetary metals be at levels, gold and silver won’t see for many years to come, if ever?
I don’t think so, and I base that on the increase in daily volatility for gold and silver. Below are two charts, plotting days of extreme volatility, days gold has moved +/- 3% from a previous day’s close. So far in 2026, 3% days for gold have come fast and furious.
Keeping in mind that rising volatility for the stock market is * ALWAYS BEARISH. * But that is not so for gold and silver, markets that see rising volatility during both bear, and bull markets. I like to think of it this way; when funds are flowing out of gold and silver (Bear Markets) volatility rises, when funds are flowing into gold and silver (Bull Markets), volatility also rises.
In other words; when the gold and silver markets have something exciting happening in them, either up or down, daily volatility rises. And so, as serious students of the market, we have to look at price trends to see if rising daily volatility is bullish or bearish. Looking at the rising daily volatility seen below, is happening as the price of gold and silver have spiked in the past year, tells me gold and silver are in bull markets.
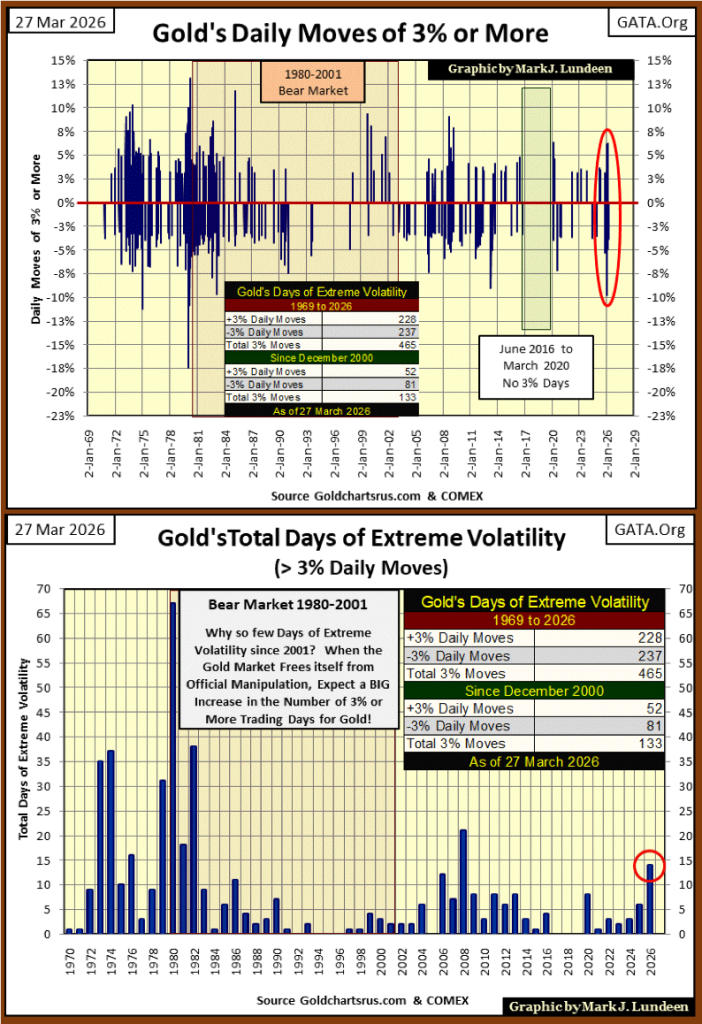
Look at 2026 in the chart above. So far in the first three months of 2026, gold has seen fourteen days of extreme volatility (3% days). That tells me, that something has changed in the market. As gold has done so well so far in 2026, I believe that something has changed in favor of the precious metal bulls.
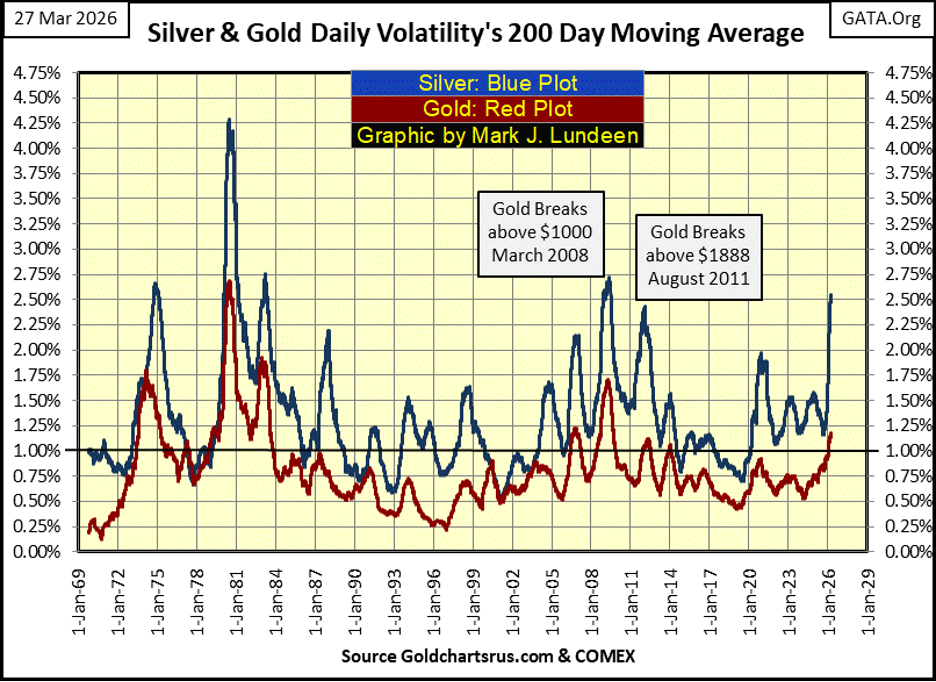
Next is a chart plotting gold & silver’s daily volatility’s 200D M/A. I take this big increase in daily volatility, as bullish for gold and silver. But looking at this chart, it could also be argued that gold and silver are approaching a top.
One thing not shown below, is the US National Debt is now over 39 trillion dollars, and once again bond yields are trending upward. The rising National Debt places the US dollar at risk, and rising bond yields, indicates the multi-tens-of-trillion in market capitalization these bond markets represent, are shedding market valuation.
These two trends;
• growing national debt,
• rising bond yields,
are very bullish for gold, silver, and their miners.
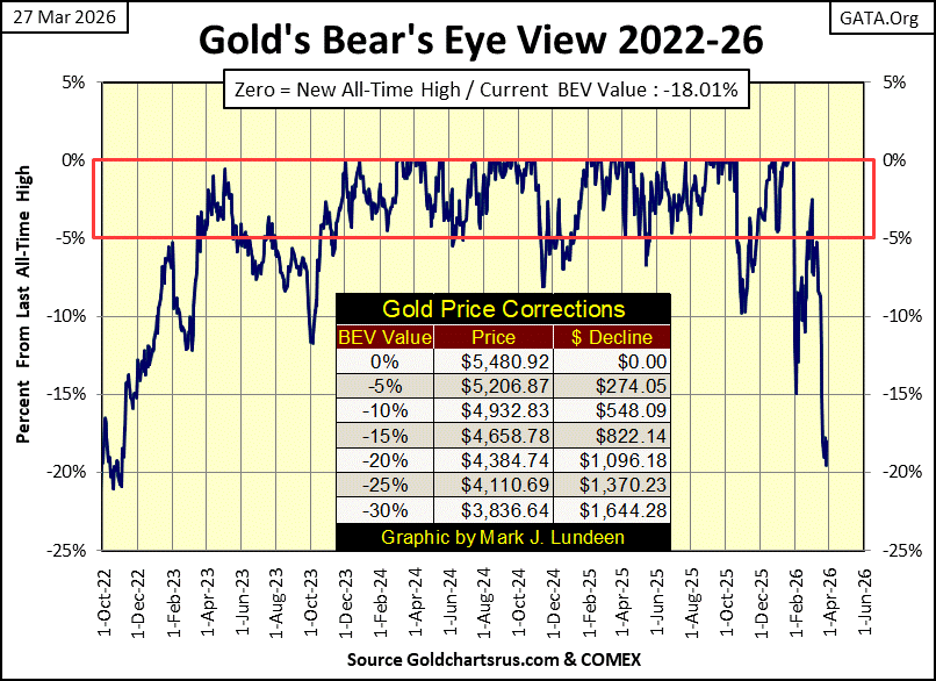
Here is gold’s BEV chart. Since gold’s last BEV Zero on January 28th, the bears have done some serious selling, the two downward plunges in the price of gold in the past two months. The first took gold down to its BEV -15% line, the second its BEV -20% line. Do the bears have what it takes to take gold down to, and below its BEV -25% line?
We’ll soon find out. But I think this correction is almost over, maybe a month from now, we’ll see gold, silver too at higher prices.
Here is silver’s BEV chart. What can I say, but to note that silver is a much more volatile market, than is gold, or the Dow Jones. In the past two months, silver has corrected by 41%. But in the five decades of daily volatility seen below for the silver market, seeing silver decline by 40% in a short time, is something to be expected.
But for all silver’s faults on display below, I still like it more than gold, as during a precious metals bull market, silver is a leveraged play on gold.
Now on to gold’s step sum table below. Someone, somewhere, has placed a lot of pressure on the price of gold below. I note that gold’s 15-count went from +9, very overbought, to a -9, very oversold in only sixteen trading days in the table below.
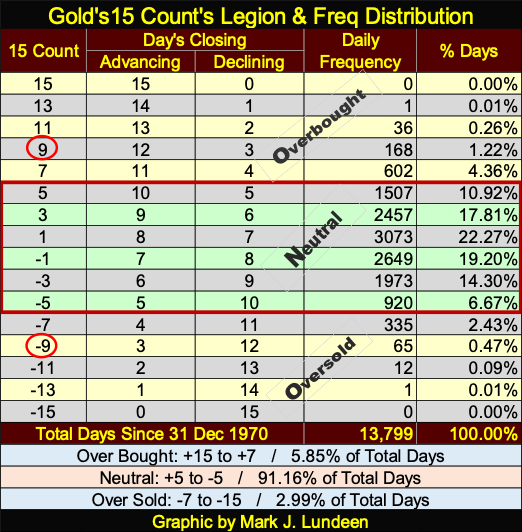
What’s with that? Maybe those nine, consecutive daily declines in the price of gold, almost two trading weeks had something to do with the sixteen day, +9 to -9 plunge in gold’s 15-count. How often does something like that happen? I don’t know, but I know what we see below on gold’s side of the table, is very unusual, something not to be seen again, for a very long time.
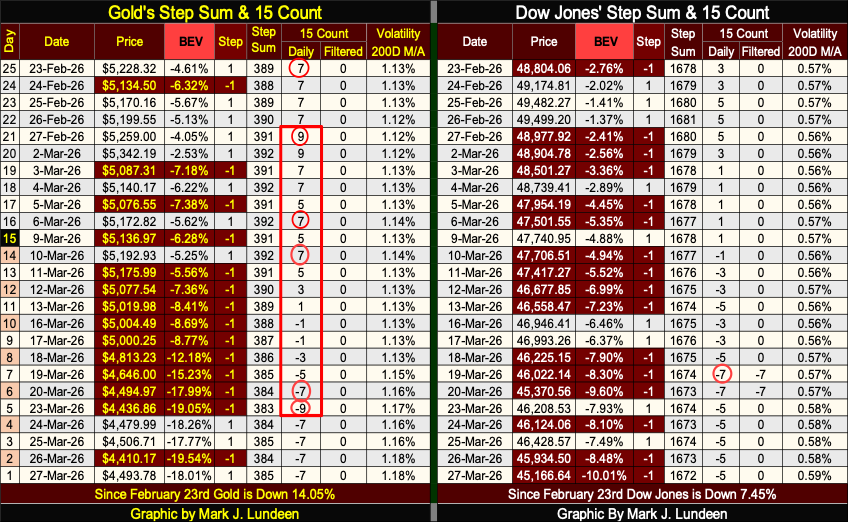
For the Dow Jones side of the table, I see lots of selling, no shortage of daily declines. But after all that, the Dow Jones only broke below its BEV -10% line on the close of this week. Maybe the BEV -10% line is a line of support, that once broken, valuations for the Dow Jones will find it increasingly easy to deflate ever downward in the days and weeks to come.
And then maybe not. In the chart below plotting daily volatility for the Dow Jones, it’s easy to see when bull and bear markets have begun, and terminated. Bull markets begin following spikes in daily volatility, above the 1.00% line, and continue until this plot declines below, or near the 0.50% line.
So, where is this plot for Dow Jones daily volatility at this week’s close? As seen in the table above, and chart below, at 0.59%. If we aren’t at the top of a bull market advance, we are damn close to one. Making this an excellent time to begin exiting the market, and not come back until we see the next spike in daily volatility form in the chart below. That is something that most likely will not happen for a couple of years.
Until then, with the XAU down by 25% from its last all-time high, this is an excellent time to begin shifting funds from the stock market, into the gold and silver miners.
__
(Featured image by Jakub Zerdzicki via Unsplash)
DISCLAIMER: This article was written by a third party contributor and does not reflect the opinion of Born2Invest, its management, staff or its associates. Please review our disclaimer for more information.
This article may include forward-looking statements. These forward-looking statements generally are identified by the words “believe,” “project,” “estimate,” “become,” “plan,” “will,” and similar expressions, including with regards to potential earnings in the Empire Flippers affiliate program. These forward-looking statements involve known and unknown risks as well as uncertainties, including those discussed in the following cautionary statements and elsewhere in this article and on this site. Although the Company may believe that its expectations are based on reasonable assumptions, the actual results that the Company may achieve may differ materially from any forward-looking statements, which reflect the opinions of the management of the Company only as of the date hereof. Additionally, please make sure to read these important disclosures.


Markets Volatility, Geopolitics, and Signals of a Potential Trend Shift
Markets swung amid shifting statements from Trump and geopolitical tensions with Iran. Initial threats moved stocks, gold, oil, and yields...


Dow Jones Tests Correction Zone Amid Bullish Momentum and Bubble Concerns
The Dow Jones has slipped just below its 10 percent correction threshold after a two month decline, raising questions about...


TopRanked.io Weekly Affiliate Digest: What’s Hot in Affiliate Marketing [1xBet Affiliate Program]
If you thought nobody liked cricket, then this week, we're proving you wrong. And by the time we're done, you'll...


Tether Seeks Big Four Audit to Boost USDT Transparency
Tether, issuer of USDT, plans a full audit by a Big Four firm to address transparency concerns over its $184...


H&M Advances Sustainability and Cuts Emissions by 2025
H&M Group reported that by 2025, 91% of materials were recycled or sustainably sourced, with recycled content reaching 32%. Emissions...
 |
|
 |  |
 |
|
-

 Biotech1 week ago
Italy’s Pharmaceutical Sector Drives Innovation, Sustainability, and European Leadership
-

 Markets2 weeks ago
Oil Surge Sparks Market Turmoil and Shadow Banking Fears
-

 Crowdfunding4 days ago
Crowdfunding Evolves into Core Financial Infrastructure in Europe
-

 Fintech2 weeks ago
PayPay Targets Global Expansion After Landmark IPO