Markets
Dow Jones, Debt Bubbles, and the Madness of Crowds
Charles Mackay’s 1841 insights on crowd madness remain relevant today. Irrational manias fuel bubbles in housing, crypto, AI, and debt, now the most dangerous bubble. U.S. debt exceeds $37 trillion with soaring interest costs, raising sustainability doubts. Geopolitical tensions, rising authoritarianism, and cult-like movements amplify risks. Despite turmoil, stocks soar—perhaps delusion, perhaps madness.

Each week we try and determine what to write about. It’s never an easy task. In looking at where we are today, we are always reminded of Charles Mackay’s book Extraordinary Popular Delusions and the Madness of Crowds (written in 1841) that sets out how humans, when caught up in crowds, often abandon reason and instead act irrationally. This is especially true when it comes to money, beliefs, and social behaviour. This is readily seen in how crowd psychology overrides individual judgment – the herd mentality.
Greed, fear, and imitation are recurring themes in history. Bubbles and manias are recurring events. There are also superstitions, conspiracy theories, fads, pseudo-science, and witch-hunts, recurring themes of delusion that exist today.
In recent times, we’ve seen bubbles in housing, crypto, meme stocks, and AI stocks. These things pile on one another, FOMO (fear of missing out) takes over, and the mania rises further. We are also plagued with misinformation, conspiracy theories, calling something a hoax if it doesn’t align with one’s beliefs, and pseudo-science regarding climate change and medicine, including disease and vaccines.
Mackay set out his key examples. They were the financial bubbles of the period that included
- Tulip Mania (1630s),
- the South Sea Bubble (1720s Britain), and
- the Mississippi Scheme (1720s France).
We’ve also had periods of mass delusions. Looking back, one may remember the Salem witch trials (1692, Massachusetts), European witch trials (15th to 18th century), and the Spanish Inquisition (1478–1834, Spain and colonies).
Today, we’ve had these bubbles:
- the internet bubble (1995–2000), resulting in the dot.com crash of 2000–2002
- the housing bubble (2005–2006), resulting in the sub-prime mortgage collapse and financial crisis of 2007–2009
- the crypto bubble/Bitcoin mania (2015–2017), resulting in an 84% crash in 2017–2019, followed by another bubble (2019–2022), followed by a 78% crash in 2022, and again followed by another bubble (2022–present), up so far 1,267%
Equity bubbles are one thing, but the most dangerous bubble today is the debt bubble, which has been growing exponentially. And it’s not just the federal debt; it’s also student loan debt, a bubble in unfunded pension liabilities, and unfunded Social Security, Medicare, and Medicaid liabilities. It is estimated that unfunded pension liabilities could be as high as $4 trillion. According to the Cato Institute (www.cato.org), the U.S.’s unfunded liabilities could be as high as $73 trillion. That is over a 75-year period. Nonetheless, at its current pace, the U.S. debt/GDP, currently at 124%, could rise to 141% by 2029 and to 200% by 2047.
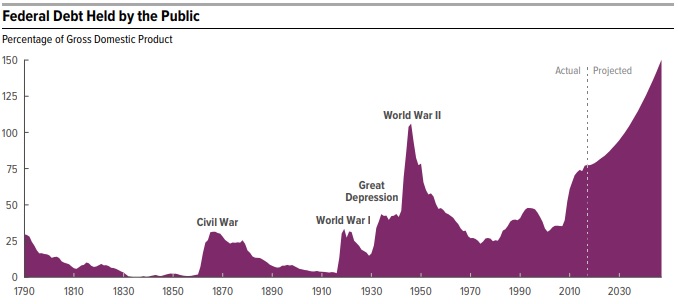
The question is, is it sustainable? We have more debt as a percentage of GDP than was accumulated in the Civil War and the two World Wars. And while wars exist today, none are on the scale of those – yet. What if the current geopolitical tensions turned into a real war?
Do we have cults today? MAGA (Make America Great Again) has been called a cult. In some ways, it could be considered a cult as it is centred on one charismatic leader – Donald Trump. It is dominated by conspiracy theories (QAnon?) and an “us vs. them” mentality. Mainstream media, institutions, and more are considered the enemy. There is loyalty to only one. In other respects, MAGA is not a cult because it is larger than what many would call a cult (think Jim Jones and Jonestown, Guyana, 1978). MAGA promotes a nationalism that centres on immigration restrictions, deregulation, and “America First.”
As the leader at the centre of MAGA, Trump has sometimes been compared to charismatic leaders like Mussolini, Hitler, Stalin, Mao Zedong, and, today, Kim Jong Un. However, despite these similarities, the MAGA movement does not have control of state apparatus the way Mussolini or others like him had. There is still an active opposition that continues to operate today. The U.S. remains a democracy, even as it is under serious threat.
But it is not just the U.S. that is experiencing the rise of extreme right-wing parties. It is happening in much of Europe as well. Russia is considered a totalitarian state. Italy has a what appears to be a pragmatic right-wing party in charge. Argentina has one as well that has brought down the rate of inflation dramatically and some of their other reforms have been positive but it also increased poverty and sparked a sharp increase in costs for necessities including health care along with cuts in pensions, and benefits.
But it is debt that is the most serious and dangerous bubble. The total debt outstanding in the U.S. is currently $37.3 trillion. The current U.S. budget deficit is $2.0 trillion. That works out to 6.6% of GDP, the highest in the G7. The U.S. has some $9 trillion to refinance by March 2026. The biggest holders of U.S. debt, Japan and China, have been dumping. Yes, the biggest holder of U.S. debt is the Federal Reserve. But does it have the ability to keep on adding to it?
In theory, they have unlimited ability. Intragovernmental holdings are next, but they are limited to what new cash they have. Between the Fed and the intragovernmental holdings, they have about $10.5–$11.0 trillion, roughly 28%–29%. Foreigners hold $9 trillion or roughly 24%.
The question is, setting aside the Fed, will the U.S. be able to find the buyers without serious crowding out in the global bond markets? Add in the needs of corporations, U.S. states and municipalities, and the consumer and we have $106.2 trillion outstanding in the U.S. That’s a lot of financing. What’s worse, the U.S. dollar has been falling steadily throughout 2025, last down 10.6% on the year for the US$ Index. It now costs more than $1 trillion annually just to pay the interest on the debt.
That’s more than the defence budget. They need lower interest rates or the Fed to buy an increasing amount of the U.S. debt. Both routes are inflationary in the long term. If investors lose confidence in U.S. treasuries, long interest rates won’t fall; they’ll rise instead. Right now, they are falling as a result of thoughts of a Fed cut next week on September 17.
To restore confidence, some have proposed that the U.S. back U.S. debt with gold. Currently, the U.S. has 8133.5 metric tonnes of gold or roughly 261 million troy ounces. To fully back the U.S. debt, gold would need to be priced at upwards of $140,000. The likelihood of that happening is zero.
The U.S. has a debt problem. It may be the biggest bubble in history. Yet every one continues in the delusion that it is somehow manageable. Or as Charles Mackay might say, “madness.”
Today, the dangers just keep piling on. In fairly short succession we had these events:
- Israel bombing Hamas headquarters in Doha, Qatar, a key U.S. ally in the Middle East and holder of the largest U.S. military base in the region. The attack was universally condemned. The U.S. was neutral about it.
- an alleged incursion of Russian drones over Poland that has triggered Article 4 of NATO. Another step towards global war?
- the assassination of Charles Kirk, a right-wing influencer and close friend of Trump, at a rally in Utah. Trump blamed it on the “radical left,” potentially setting off another round of retaliation and retribution.
The stock market appears to be immune to all of this, rising once again to new all-time highs. Delusional? Maybe. Gold and gold stocks have also been making new all-time highs. Gold is responding to the rising dangers as a safe haven, given it has no liability and cannot be destroyed.
The 1930s were known primarily for the Great Depression, and the dust bowl. On the positive side, they were also known as a period for Art Deco, jazz, and Roosevelt’s New Deal. But lurking behind was the rise of fascism in Germany and Japan in particular. Fascism had already been present in Italy since the 1920’s and then later in Spain. Russia was totalitarian but later joined the Allies in fighting the Nazis in World War II. World War II followed the rise of fascism and the Great Depression.
We live in a period with too much debt, too much division both domestically and geopolitically, and a stock market in a bubble. It’s not just in the U.S. It is growing in all the G7 countries as well. Do Mackay’s musings live on? Delusion and madness? Volatility is rising and the divisions are becoming deeper.
“A nation is a society united by a delusion about its ancestry and by common hatred of its neighbours.” —William Inge, American playwright and novelist, won the Pulitzer Prize for Picnic, which became a Broadway production and film; 1913–1973
Chart of the Week
U.S. Inflation, Core Inflation, Federal Funds Rate 2015–2025
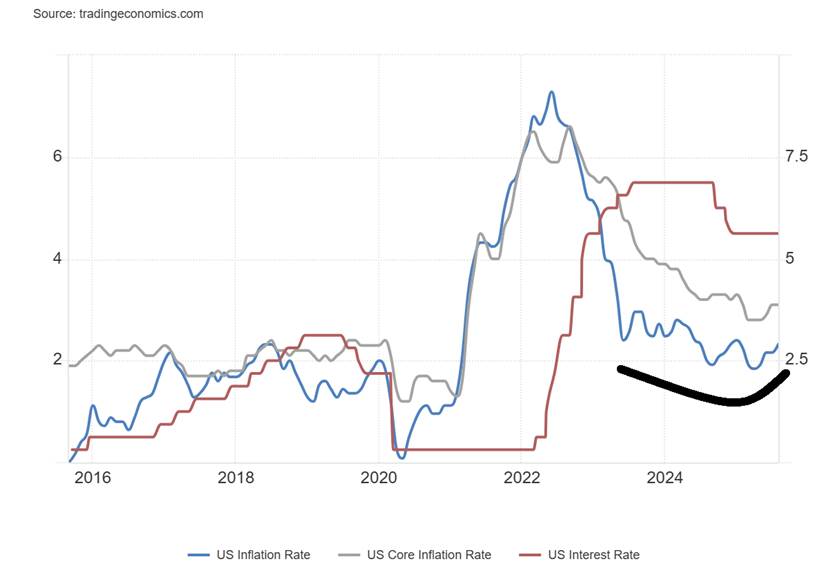
This was inflation week. It’s no surprise, really, that the inflation numbers ticked up this past week. The CPI inflation rate came in at 2.9% year over year (y-o-y), the highest since January. For the previous two months, the rate was 2.7%. The rate was largely as expected. The core inflation rate (ex. food and energy) came in at 3.1%, the same as the previous month but also higher than what was seen in March through June.
Food inflation is still a problem, but low oil prices have kept energy prices down. In some cases, food inflation is traceable to tariffs. Both at home and in restaurants, the cost of food rose. Droughts, wildfires, and floods, along with supply disruption, sanctions, and tariffs, also play a big part in rising inflation. Remaining high are rents and medical care. The goods sector also continues to see inflation, thanks to tariffs.
The expectation here is that tariffs are finally working their way through the economy. It was never a case of placing a tariff and then seeing instant inflation. Given that the legality of tariffs is questionable, it will be interesting to see how the Supreme Court views it (SCOTUS). Nonetheless, it is not a surprise that inflation is once again ticking upwards for both inflation and core inflation. Many expected it. But will it turn into a sharp rise? We have previously noted how inflation rose in the U.S. in the 1970s. The initial bout was eventually brought down, but then a second wave of inflation got underway, triggered by the Arab Oil Embargo. We note, however, that energy inflation has less of an impact on inflation today than it did in the 1970s.
Inflation expectations are rising as seen in this chart of the University of Michigan, showing one-year and five-year expectations. Note how, during 2021–2022 when inflation actually rose, expectations were actually lower than they are today. Expectations rose sharply this past year, but as inflation subsided expectations subsided as well. Is it once again picking up?
University of Michigan 5-year Inflation Expectations and One-year Inflation Expectations 2015-2025
It’s no surprise that the inflation numbers are putting the Fed in a quandary. Rising inflation says to maintain rates as they are and maybe even raise them. A stumbling labour market says to lower them. The pressure from the Trump administration is huge as they continue to try to oust Fed Governor Lisa Cook in order to try and take control of the Fed. As we have noted, this is a dangerous idea as a politicized Fed could prove bad for the global financial system.
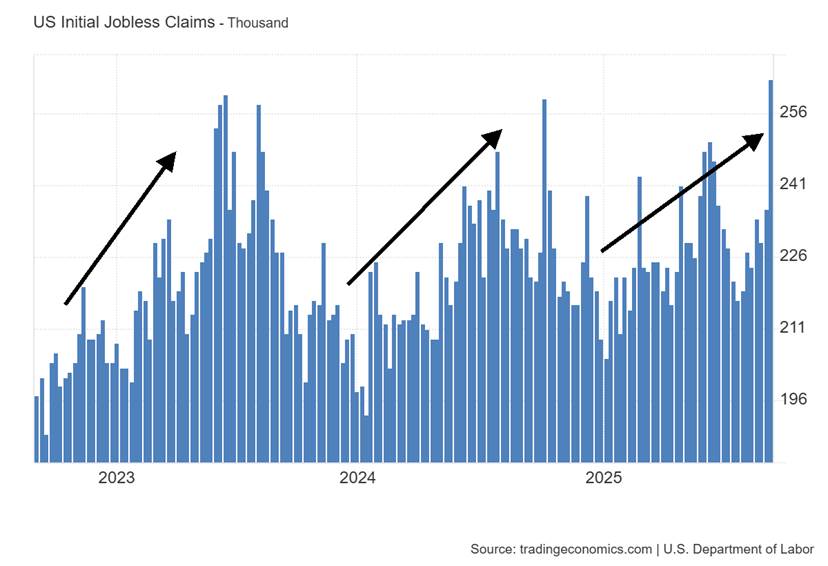
This week’s weekly jobless claims emphasize that quandary as weekly claims jumped to the highest level seen in three years. They came in at 263,000, above the expected 235,000. The inflation rate is still about 50% above the Fed’s 2% target. And now it’s rising.
The quandary – what to do? Stay put, lower the rates, or hike them? It’s widely expected that the cut will be 25 bp next week. We agree. The softening labour market is the dampener, but rising inflation is the accelerator. Many are now calling for a 50 bp cut this week.
U.S. Weekly Jobless Claims 2022–2025
Markets & Trends
| % Gains (Losses) Trends | ||||||||
| Close Dec 31/24 | Close Sep 12/25 | Week | YTD | Daily (Short Term) | Weekly (Intermediate) | Monthly (Long Term) | ||
| S&P 500 | 5,881.63 | 6,584.29 (new highs) * | 1.6% | 12.0% | up | up | up | |
| Dow Jones Industrials | 42,544.22 | 45,834.22 (new highs) * | 1.0% | 7.7% | up | up | up | |
| Dow Jones Transport | 16,030.66 | 15,628.08 | (0.6)% | (1.7)% | neutral | neutral | up | |
| NASDAQ | 19,310.79 | 22,141.10 (new highs) * | 2.0% | 14.7% | up | up | up | |
| S&P/TSX Composite | 24,796.40 | 29,283.82 (new highs) * | 0.8% | 18.4% | up | up | up | |
| S&P/TSX Venture (CDNX) | 597.87 | 879.67 (new highs) | 2.6% | 47.1% | up | up | up | |
| S&P 600 (small) | 1,408.17 | 1,441.96 | (0.5)% | 2.4% | up | up | up | |
| MSCI World | 2,304.50 | 2,807.25 (new highs) * | 0.8% | 21.8% | up | up | up | |
| Bitcoin | 93,467.13 | 116,296.75 | 4.4% | 24.4% | up (weak) | up | up | |
| Gold Mining Stock Indices | ||||||||
| Gold Bugs Index (HUI) | 275.58 | 559.32 (new highs) | 4.1% | 103.0% | up | up | up | |
| TSX Gold Index (TGD) | 336.87 | 669.63 (new highs) * | 4.0% | 98.8% | up | up | up | |
| % | ||||||||
| U.S. 10-Year Treasury Bond yield | 4.58% | 4.07% | (0.3)% | (11.1)% | ||||
| Cdn. 10-Year Bond CGB yield | 3.25% | 3.19% | (2.5)% | (1.9)% | ||||
| Recession Watch Spreads | ||||||||
| U.S. 2-year 10-year Treasury spread | 0.33% | 0.50% | (10.7)% | 51.5% | ||||
| Cdn 2-year 10-year CGB spread | 0.30% | 0.68% | (6.9)% | 126.7% | ||||
| Currencies | ||||||||
| US$ Index | 108.44 | 97.64 | (0.1)% | (10.0)% | down | down | down | |
| Canadian $ | 69.49 | 0.7222 | (0.1)% | 3.9% | up | up | neutral | |
| Euro | 103.54 | 117.32 | 0.1% | 13.3% | up | up | up | |
| Swiss Franc | 110.16 | 125.55 | 0.2% | 14.0% | up | up | up | |
| British Pound | 125.11 | 135.61 | 0.4% | 8.4% | up | up | up | |
| Japanese Yen | 63.57 | 67.72 | (0.1)% | 6.5% | neutral | neutral | down (weak) | |
| Precious Metals | ||||||||
| Gold | 2,641.00 | 3,642.50 (new highs) * | 1.7% | 37.9% | up | up | up | |
| Silver | 29.24 | 42.13 (new highs) | 2.9% | 44.1% | up | up | up | |
| Platinum | 910.50 | 1,397.80 | 1.6% | 53.5% | up | up | up | |
| Base Metals | ||||||||
| Palladium | 909.80 | 1,211.50 | 9.5% | 33.2% | up | up | neutral | |
| Copper | 4.03 | 4.58 | 2.5% | 13.7% | neutral | neutral | up | |
| Energy | ||||||||
| WTI Oil | 71.72 | 62.63 | 0.9% | (12.7)% | down | down | down | |
| Nat Gas | 3.63 | 2.94 | (3.3)% | (19.0)% | down (weak) | down | down (weak) | |
S&P 500
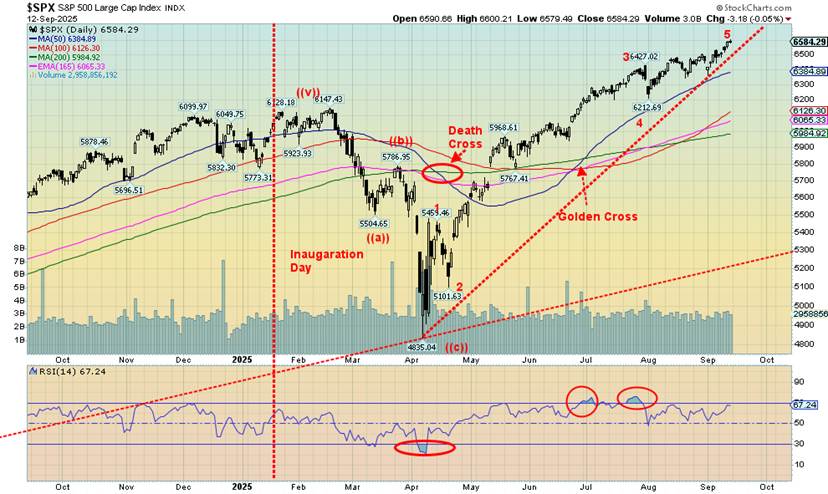
Is there anything that is going to stop this market? Not even the news of larger than expected initial weekly claims or the news that the past year’s jobs were revised down by nearly a million jobs spooked this market. Add in other signs of a slowing economy and it baffles many that this market keeps going up. We know we are in a blow-off, but we can’t tell when or where this will end. We do know that September is the weakest month of the year with the tendency for crashes to occur in October. So far, it all seems meaningless.
One explanation might be that the market continues to view high-tech/AI as the main driver and the MAG7 are the ones pushing the market higher, given they make up roughly one-third of the S&P 500. This week Tesla defied expectations and rose 12.9%. Other high-tech winners were the Chinese stocks Baidu (+12.6%) and Alibaba (+14.4%) moving to new all-time highs. Nvidia, the richest company in the world, gained 6.5%. Broadcom gained 7.5%, also to new all-time highs. Also making all-time highs was Google, up 2.6%. And it’s no surprise that the MAG7 ETF MAGS also made all-time highs. All this despite losses in Apple, Amazon, and Netflix.
One question we’re asking is, is the stock market being viewed as a safe haven? It’s possible. Funds flee problems (for example, the threat of a NATO/Russia war), but instead of going into U.S. treasuries they buy stocks instead. There are also worries about the state of the U.S. dollar and the ongoing U.S. political divisions, that will no doubt be more amplified now with the assassination of right-wing influencer Charles Kirk.
Dow Jones Climbs Amid Debt Fears and Global Delusions
Still, the all-time highs fell with the S&P 500 (SPX) up 1.6% this past week, the Dow Jones Industrials (DJI) up 1.0%, and the NASDAQ up 2.0%. All made all-time highs. Also making new all-time highs were the S&P 500 Equal Weight Index, the NY FANG Index, the S&P 100 (OEX), the AMEX, the NASDAQ 100, the Russell 1000 and 3000, and the Wilshire 5000. The Dow Jones Transportations (DJT) continues to be a drag as it is nowhere near an all-time high and fell 0.6% this past week. Bitcoin continues to baffle as it rebounds up 4.4% this past week to over $116,000.
In Canada, the TSX Composite set all-time highs by gaining 0.8%, thanks once again to Golds (TGD), Metals (TGM), and Materials (TMT) and with a little help from Financials (TFS), all making all-time highs. The TSX Venture Exchange (CDNX) continues to rise to fresh 52-week highs, up 2.6%. In the EU, the London FTSE rose 0.8%, the Paris CAC 40 was up 2.0%, the German DAX was up 0.4%, and the EuroNext was up 2.1%. In Asia, China’s Shanghai Index (SSEC) rose 1.5% and the Tokyo Nikkei Dow (TKN) made all-time highs, up 4.1%, as did Hong Kong’s Hang Seng (HIS), up 3.8%. The records keep on falling.
Could we keep running into October? Yes, we recall that the market topped on October 9, 2007 before the financial crisis collapse and Great Recession into 2008–2009. Are we running out of time? We are seeing an increase in insider selling. That’s a sign that the smart money is getting out. Should we follow? Remember, you can’t go broke taking a profit.
There is complacency in the air. The VIX Volatility Index is now below 15, indicating that we have a complacent market. There are numerous divergences between stock market indicators and the index, with the indicators making lower highs as the indices make all-time highs. We need a catalyst to end this rise. So far, nothing is emerging but potential abounds. The S&P 500 falling below 6,350 is the first sign of trouble. Below 6,200 is the next key point. The 200-day MA is down around 5,900/6,000.
A black swan event? It’s happened before.
The Scorecard
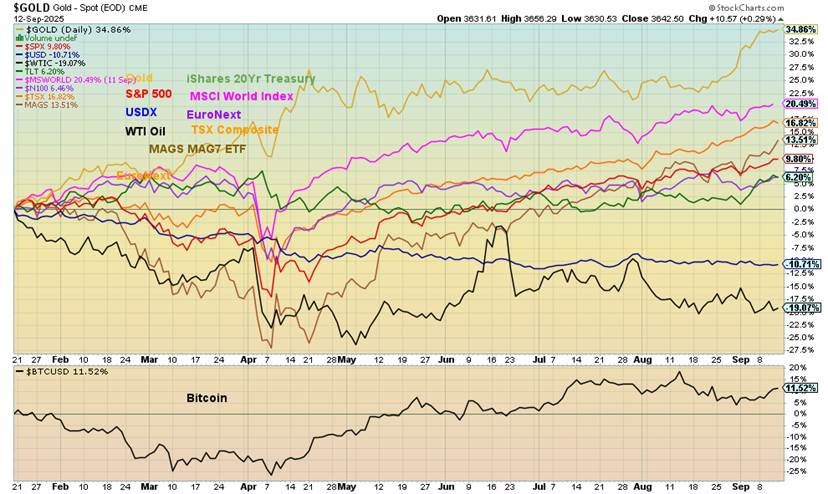
As expected, gold not only maintains its lead but the spread is widening. Gold is now up 34.9% in 2025. Next is the MSCI World Index (ex U.S.), up 20.5%. Oil remains last, down 19.9%, while the US$ Index is down 10.7%.
Oracle
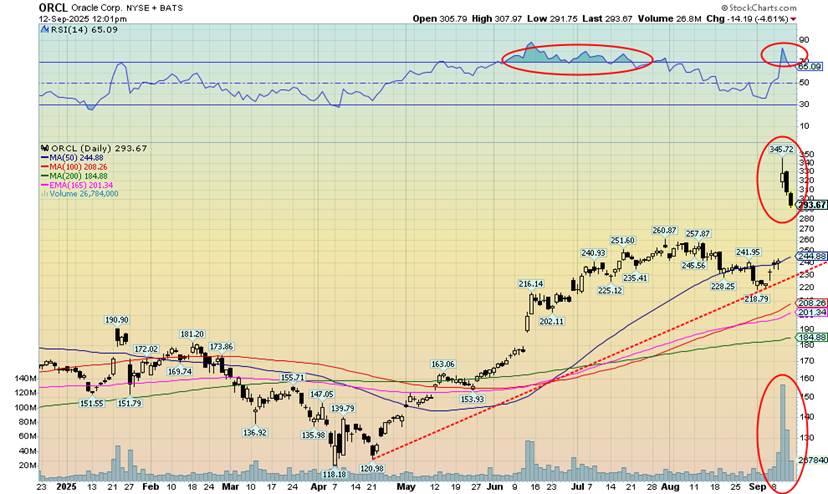
Oracle – the star or danger. Oracle gapped way up this past week after the CEO, Larry Ellison, said that Oracle’s AI cloud revenue was poised to soar to $144 billion by 2030. Volume surged on the news and made all-time highs. The huge rise in price briefly made Ellison the richest man in the world, surpassing Elon Musk. It didn’t last long and Musk is back in his exalted space. According to Forbes’ Real-Time Billionaires list, Musk has a net worth of $460 billion and Ellison $353 billion as of September 12. If they were countries, they would be respectively the 34th and 42nd largest countries in the world by nominal GDP. Nvidia is the largest corporation, placing them fourth if they were a country.
Interestingly, Oracle spiked and gapped open on September 10 but quickly descended, now down roughly 15% from its spike high. It still has a way to go to break that uptrend line from April. Below $230 Oracle could be in a bit of trouble.
Is this just another delusion?
U.S. Bonds
This is the big week with all eyes on the Fed on September 17 at 2:00 pm. The wide expectation is for a 25 bp cut with a smattering of at least 10% predicting a 50 bp cut. We are with the 25 bp cut. The Fed is in a real quandary with signs of a rapidly slowing economy and higher than desired inflation continuing – stagflation, the Fed’s worst nightmare. Then there are the constant attacks on the Fed from Trump to lower rates – not by 25 bp but by 300 bp. That, of course, would not be advisable with inflation still a problem. Nor is it any guarantee that sharply lower rates would spur the kind of economic increase desired by Trump. Given everything else that is going on, many may just sit on their hands.
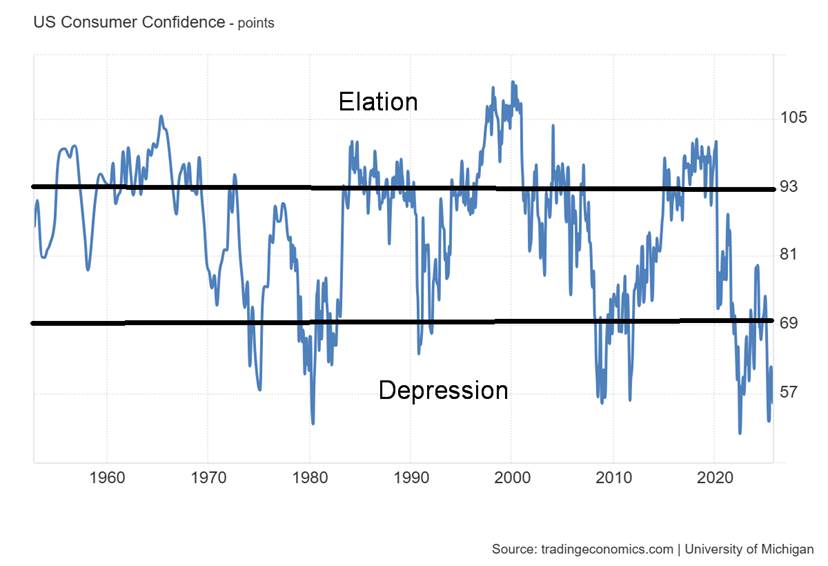
It was no surprise to see consumer sentiment fall again with the latest release of the Michigan Consumer Sentiment Index, falling to 55.4, below the previous reading of 58.2 and the consensus of 57. The Michigan Consumer Sentiment Index continues down to the area of the 1980–1982 steep recession and the 2007–2009 Great Recession and financial crisis. And we are not even in a crisis, yet.
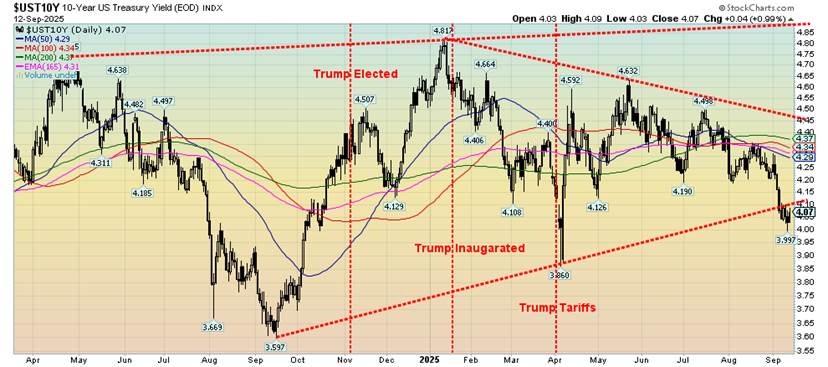
The yield on the U.S. 10-year Treasury note fell as low as 4.00% this past week, but the higher than expected inflation numbers pushed the yield back up to 4.07%. Food inflation has ticked up as well, given Trump’s tariffs plus droughts, floods, fires, and more. The 10-year fell below our support line but, so far, follow-through is muted. A move back above 4.15% could signal this was a false breakdown. We’d need to break that April low of 3.86% to tell us we are going lower.
In Canada, the 10-year Government of Canada bond (CGB) fell to 3.19% from 3.27% a week earlier. So far, inflation has been better in Canada than in the U.S. However, the Bank of Canada (BofC) is still expected to cut rates 25 bp on September 17. The 2–10 spreads still signal recession with the U.S. 2–10 at +50 bp and Canada at +68 bp. Positive spreads followed a long period of negative spreads as short rates were higher than long rates.
We do have a way to go to suggest much higher yields. The 10-year would have to break over 4.35%. It is unknown at this time what the reaction would be if the Trump administration’s attempt to take over the Fed is successful. But we don’t expect it to be positive with the potential for a sharp sell-off in U.S. treasuries that would raise bond yields.
U.S. Michigan Consumer Sentiment Index 1953–2025
Gold and Silver
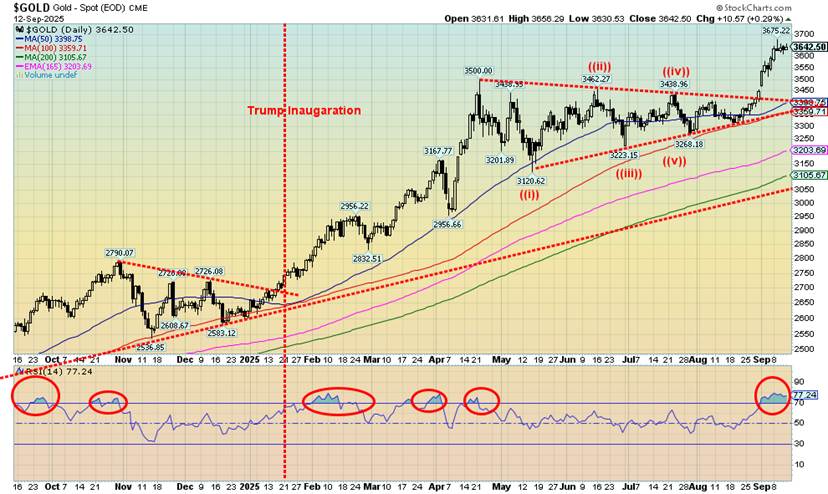
After consolidating from April to August, gold has broken out and is now on the next wave to an upside. The records continue to fall as gold has now set a record high 30 times so far in 2025. Interestingly, on an inflation- adjusted basis we are now at, near, or have surpassed the all-time high set in 1980, depending on how it is calculated. The S&P 500 long ago passed its inflation-adjusted high.
The breakout from that months-long consolidation suggests a target of at least $3,800. We closed at $3,642 on Friday. Silver is also breaking out, closing at its highest level since 2011. Still above is the 1980 and 2011 high near $50. Further away is the inflation-adjusted high of at least $146, but some believe it’s up to $192. Nonetheless, gold and silver have been the place to be in a year that has been punctuated with economic uncertainty and geopolitical and domestic political tensions. We should add that platinum, the overlooked precious metal, has been the best performer so far in 2025, up 53.5% vs. silver up 44.1% and gold up 37.9%.
Many have asked whether it is still worthwhile to buy gold and silver. The answer is yes, citing the decline in the U.S. dollar, the confiscation of Russian reserves after the 2022 invasion of Ukraine, the huge U.S. debt and dangerous debt/GDP ratio of 124%, projected huge spending by the Trump administration as a result of its Big,
Beautiful Bill, and its ongoing attempt to seize control of the Fed. Upwards of thirty percent of U.S. debt or $10.5 trillion has been added since the 2020 pandemic year.
Add in signs that the U.S. economy is slowing, possibly rapidly, as the Fed prepares to cut rates despite signs that inflation is not going away, the geopolitical tensions continuing with the Russia/Ukraine war that now threatens to bring in NATO, the domestic political tensions which moved another notch higher with the assassination of Charlie Kirk – and we have ongoing perfect conditions for gold. Oh, and need we mention again the ongoing attempt of the Trump administration to take control of the Fed, an event that could shake the global financial system to its core.
As good as the rise of gold, silver, and platinum has been, the rise of the gold stocks has been nothing short of spectacular. The Gold Bugs Index (HUI) is up 103.0% in 2025 while the TSX Gold Index (TGD) has been making record highs, up 98.8% so far in 2025. The HUI has been setting 52-week highs but remains about 12.5% below its record 2011 nominal high. Many believe gold stocks are still under valued despite the huge rise in 2025.
So, the answer is yes, it is not too late to buy gold, silver, and platinum. That said, corrections could occur, especially now when we are getting consistent RSI readings above 70, a level that signals overbought. Corrections should be bought. North Americans under-own gold and silver compared to Asia and even Europe, given they are more enamoured with tech/AI. However, central banks have been buyers, purchasing an estimated 67 metric tonnes so far in 2025.
The largest buyers have been China, Azerbaijan, Kazakhstan, and Poland, the latter being the largest buyer thus far in 2025. Only Serbia in Europe appears in the top 15 purchasers. No other European or North American/South American country appears on the list as it is dominated by Asian and some Middle Eastern countries. Countries like Canada hold no gold, having sold theirs back in 2016. Could that prove to be a big mistake?
On the week, gold rose 1.7%, silver was up 2.9%, platinum was up 1.6%, the near precious metal palladium was up 9.5%, and copper gained 2.5%. The gold stock indices were up with the HUI gaining 4.1% and the TGD up 4.0%. It’s no surprise to find that Golds (TGD), Metals (TGM), and Materials (TMT) have helped take the TSX Composite to record highs this year, up 18.4%. TGD is up 98.8%, TGM up 49.8%, and TMT up 62.6%. No other TSX sub-indices are close to challenging these three.
We should also mention the energy market where WTI oil rose 0.9% this past week and Brent crude was up 2.0%. Natural gas (NG) fell 3.3% but the EU NG rose 1.9% on renewed NATO/Russia tensions. Those same tensions helped oil rise this past week. The energy stocks saw the ARCA Oil & Gas Index (XOI) up 0.4% and the TSX Energy Index (TEN) up 3.2%.
Commodities have done well this year, although we note that the CRB Index is up only 1.7% in 2025 because energy is the largest component and, as we know, it has done poorly so far. Energy represents some 33% of the index with oil alone representing 23%.
Currencies were pretty quiet this past week with the US$ Index down 0.1%, the euro up 0.1%, the Swiss franc up 0.2%, the pound sterling up 0.4%, and the Japanese yen down 0.1%. The Cdn$ fell less than 0.1%.
Gold would be in trouble if it fell back below $3,350. That could signal a steeper correction. We’d prefer it hold above $3,400 going forward, a level that would rise as the market moves higher. Silver’s point is at $39; however, we’d prefer it remain above $40. For the HUI the point is 480, although again we’d prefer it remain above 520.0. For the TGD the key point is 550 with again a preference that it remains above 620 on any pullback.
We are reading that some are predicting a huge blow-off in gold, bigger than what happened in 1979. Back then, gold rose over 400% from late 1978 to the peak in January 1980. A move like that today from the 2022 low would see gold rise to over $6,900. For silver it rose over 1,000% from a key low in 1978 to the high in 1980. Again, a comparable move today would see silver rise to around $175. Could it happen? Yes. Will it happen?
We tend to take one step at a time. We’ll reassess gold once it achieves $3,800 while silver’s next target could be $44/$45. For the stock indices, the HUI targets next up to just over 600 while the TGD targets next up to over 700. The message is straightforward – stay long, add on dips. The reasons we are going up are not going away anytime soon.
__
(Featured image by Alice Pasqual via Unsplash)
DISCLAIMER: This article was written by a third party contributor and does not reflect the opinion of Born2Invest, its management, staff or its associates. Please review our disclaimer for more information.
This article may include forward-looking statements. These forward-looking statements generally are identified by the words “believe,” “project,” “estimate,” “become,” “plan,” “will,” and similar expressions, including with regards to potential earnings in the Empire Flippers affiliate program. These forward-looking statements involve known and unknown risks as well as uncertainties, including those discussed in the following cautionary statements and elsewhere in this article and on this site. Although the Company may believe that its expectations are based on reasonable assumptions, the actual results that the Company may achieve may differ materially from any forward-looking statements, which reflect the opinions of the management of the Company only as of the date hereof. Additionally, please make sure to read these important disclosures.
David Chapman is not a registered advisory service and is not an exempt market dealer (EMD) nor a licensed financial advisor. He does not and cannot give individualised market advice. David Chapman has worked in the financial industry for over 40 years including large financial corporations, banks, and investment dealers. The information in this newsletter is intended only for informational and educational purposes. It should not be construed as an offer, a solicitation of an offer or sale of any security. Every effort is made to provide accurate and complete information.
However, we cannot guarantee that there will be no errors. We make no claims, promises or guarantees about the accuracy, completeness, or adequacy of the contents of this commentary and expressly disclaim liability for errors and omissions in the contents of this commentary. David Chapman will always use his best efforts to ensure the accuracy and timeliness of all information. The reader assumes all risk when trading in securities and David Chapman advises consulting a licensed professional financial advisor or portfolio manager such as Enriched Investing Incorporated before proceeding with any trade or idea presented in this newsletter.
David Chapman may own shares in companies mentioned in this newsletter. Before making an investment, prospective investors should review each security’s offering documents which summarize the objectives, fees, expenses and associated risks. David Chapman shares his ideas and opinions for informational and educational purposes only and expects the reader to perform due diligence before considering a position in any security. That includes consulting with your own licensed professional financial advisor such as Enriched Investing Incorporated. Performance is not guaranteed, values change frequently, and past performance may not be repeated.


The TopRanked.io Weekly Digest: What’s Hot in Affiliate Marketing [++ KuCoin Affiliate Program Review]
X now allows people to block certain topics from their feed. This week, we're going to tell you how to...


Hotel Stay Project Supports Wildlife Conservation in Japan
Iwate Prefecture launched a project linking hotel stays to conservation through Morioka Zoological Park Zoomo. A themed room at Yunomori...


Bitcoin Leads Modest Crypto Rebound Amid Mixed Signals
Bitcoin rose 2 percent to above 77000 as ETFs saw 15 million inflows and April gains of 12.2 percent. Ethereum...


Major Pharma Advances: EU Approvals, Vaccine Progress, and Breakthrough Clinical Results
Johnson & Johnson has EU approval for nipocalimab for generalized myasthenia gravis, showing superior control and sustained benefits. Sanofi reported...


Agential Cannabis 2026 to Drive APAC Market Growth and Global Industry Collaboration
Agential Cannabis 2026 will take place September 23–24 in Bangkok, bringing global experts together to advance the APAC medical cannabis...
 |
|
 |  |
 |
|
-

 Fintech1 week ago
Fintech Investment Rebounds in 2025 Amid Cautious Optimism for 2026
-
 Business4 days ago
The Dow Jones & Gold to See New All-Time Highs
-

 Cannabis2 weeks ago
Misiones to Close State Cannabis Firm to Cut Costs and Boost Efficiency
-

 Biotech2 days ago
Johnson & Johnson Expands U.S. Biomanufacturing Amid Policy Shifts and Rising Demand