Markets
Dow Jones faced a downfall after a new all-time high last week
In August 2017, any talk of a 95% market decline in the Dow Jones is completely theoretical; a wild speculation that people smarter than me would never indulge in.

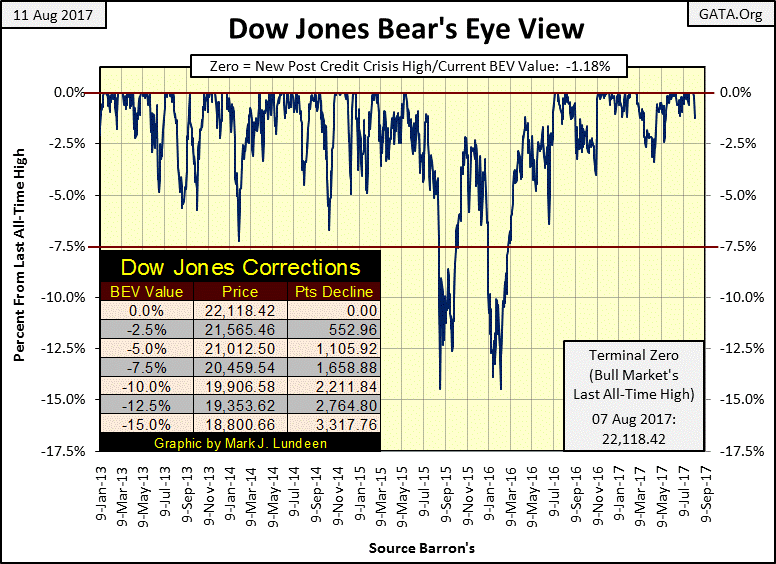
This week wasn’t all wine and roses. Monday closed with the Dow Jones at a new all-time high, but it was downhill for the rest of the week.
© Mark Lundeen
And this week the NYSE began producing more 52Wk Lows than Highs, though it’s too early to say if this is a new trend in the market.
With all the talk of nuclear exchanges between North Korea and the United States, I would have thought the market would have been down more than it was. Yields on US Treasury debt actually were down for the week as people sought the safety of owning the IOUs of the largest debtor in the history of money. So at present, the stock market isn’t ready to go down; or are the old monetary metals ready to make their moves upwards into history.
But that doesn’t mean this isn’t a financial market that’s ripe for a fall – because it is. Current market valuations that are grotesque, based on dubious earnings, and all this is founded on a credit system that’s had rates set far too low for far too long. Not for years but decades; back when Alan Greenspan first saved the big Wall Street banks by providing “ample liquidity” in the October of 1987, during a flash crash.
So in this article, I’m going to focus on bear markets; how they differ from bull markets. I expect such information will prove handy sometime in the not too distant future.
Two things bear markets experience that bull markets typically lack: market extremes in:
- Daily Volatility (Dow Jones 2% Days)
- NYSE Market Breadth (NYSE Advance – Decline 70% Days)
Especially since the post-November 2016 market surge in the stock market, this has held true.
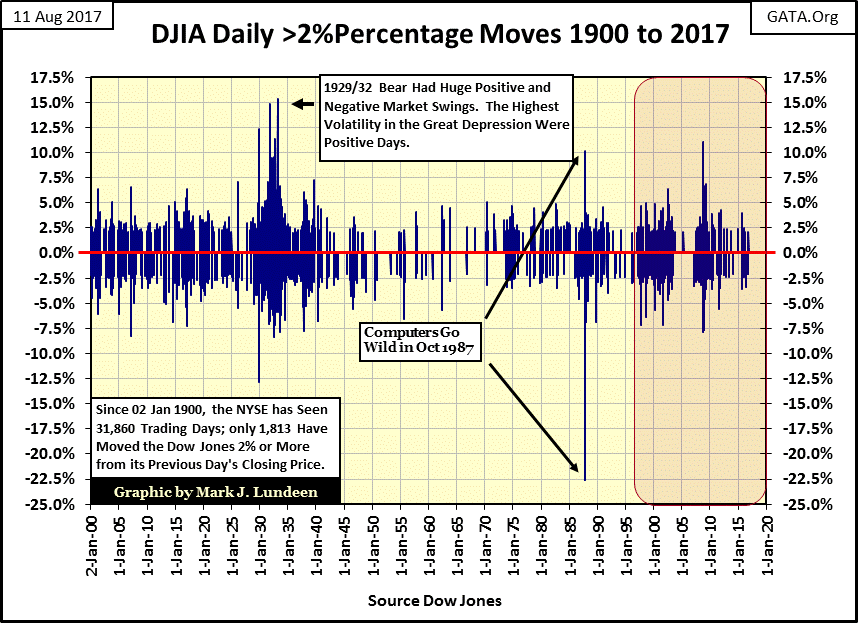
My next chart is one I haven’t published for a while, the 2% or more daily moves from a previous day’s close in the Dow Jones since January 1900. The NYSE has seen 31,858 trading sessions since 02 January 1900, but daily moves of 2% or more in the Dow Jones has occurred in only 1,813 of them. Note: the largest daily advances seen in the past 117 years took place during the Great Depression Crash and the Sub-Prime Mortgage bear market. The Dow Jones saw daily advances of more than 15% in the Great Depression and over 10% during the Credit Crisis. Large daily advances in the Dow Jones (2% or more) are not the stuff of bull markets!
© Mark Lundeen
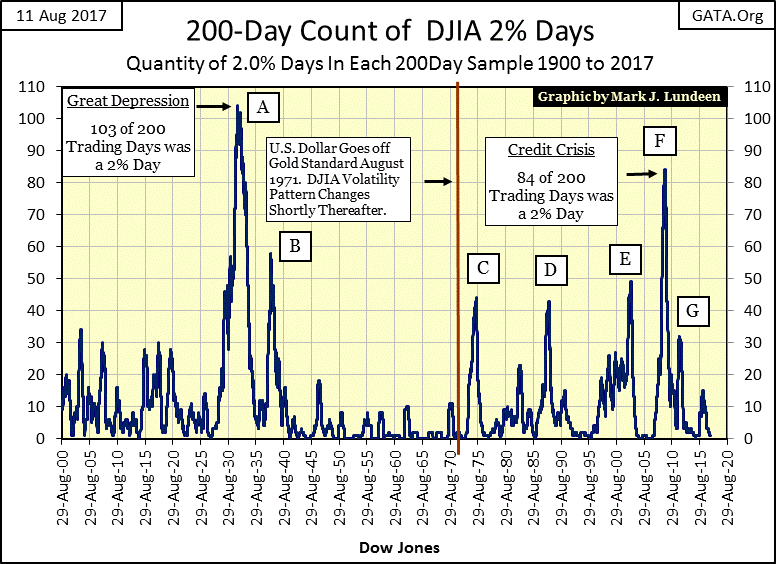
The above chart is interesting, but not the best way to display this data. To illustrate the connection between increases in daily volatility and bear markets, I use what I call the 200 count, or the number of days the Dow Jones sees daily moves of 2% or more within a running 200-day sample (chart below). These 2% daily moves can be up or down (see chart above); it makes no difference to Mr. Bear. One day he’s mauling the bulls with a big down day, the next he’s savaging the shorts with a huge market advance. That’s just how things are at the NYSE when Mr. Bear is calling the shots.
Since the bottom of the subprime bear market in March 2009 (F on Chart Below), daily volatility in the Dow Jones has greatly diminished, exactly as one would expect during a huge eight-year advance. As of today, the 200-day sample includes every NYSE trading session from 26 Oct 2016. The last day of extreme volatility for the Dow Jones was on 07 Nov 2016, giving the 200 count a value of only 1 as of the close of this week. But in only nine trading days, the 200 count will once again become zero.
Going back to 1900 (below); seeing the Dow Jones’ 200 count at zero typically occurs at market tops, and so isn’t a long lasting situation in the stock market. I anticipate sometime in the coming year, which could be next week, six months or more from now, the Dow Jones will once again begin experiencing frequent daily moves of 2% or more in a broad market decline, which will result in a sharp increase in the 200 count below. When that happens, unless you are in gold and silver mining shares, you’ll want to exit the market as Mr. Bear is once again on the prowl.
© Mark Lundeen
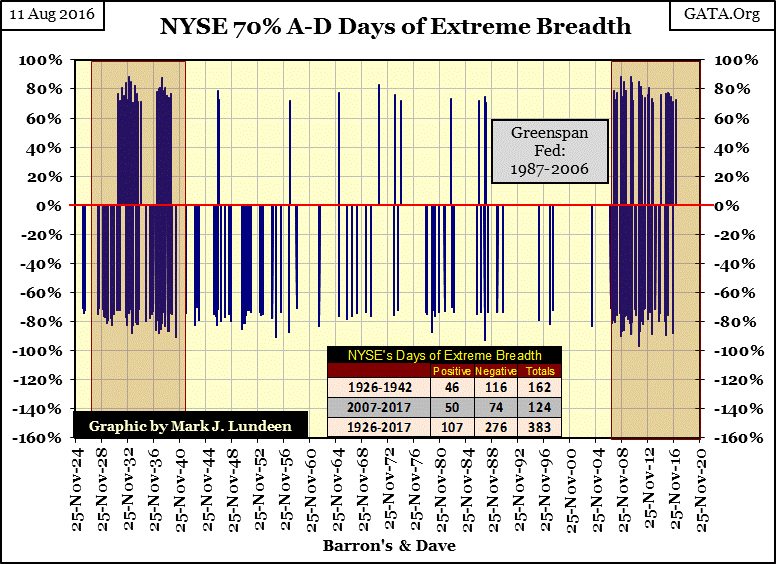
During bear markets, it’s not just extreme days of market volatility in the Dow Jones we should anticipate. The NYSE also experiences days of extreme market breadth. What are those? Using the NYSE’s advancing and declining market breadth data, here is how they are calculated:
Advancing Days – Declining Days / Total Issues Traded = (+/-) 70% or more.
I call these NYSE 70% market events days of extreme market breadth, or 70% days. I’ve plotted them in the chart below, and actually, they’re rare market events. Since 1926 (24,192 trading sessions), the NYSE has seen only 383 days of extreme market breadth, aka NYSE 70% days.
Though they do occur during bull markets, they are typically bear market events. The depressing 1930s saw more than their fair share of them, as seen below. And since February 2007, the second massive cluster of the past century has formed, though since March 2009, unlike the 1930s, the stock market has seen a big advance.
It’s interesting noting how few NYSE 70% days occurred during Greenspan’s era of market bubbles (August 1987 – March 2006).
© Mark Lundeen
In the past year, we’ve seen five of these 70% days, three of those occurred last September, another last October and our last in March. During the Great Depression Crash, and the Sub-Prime bear market crash of 2007-09, when Mr. Bear was actively feeding, we’d see several days of extreme volatility and market breadth each week, and it wasn’t any fun. Especially those days where the market saw big advances in the Dow Jones, and those days where advancing issues overwhelmed decliners at the NYSE. These pseudo-bullish events in a deflationary market decline only inspired forlorn hope in the minds of those Mr. Bear has targeted for destruction.
Yea – I’m a BIG BEAR! I see no reasons to believe what happened in the early 1930s and again from 2007-09 isn’t going to be repeated. Quite possibly the coming bear market will be worse than the 1929-32 market crash that took the Dow Jones down 89%. After all, since Alan Greenspan became Fed Chairman in August 1987, the FOMC has inflated today’s market valuations to a degree of grotesqueness that would have been impossible during the Roaring 1920s bull market.
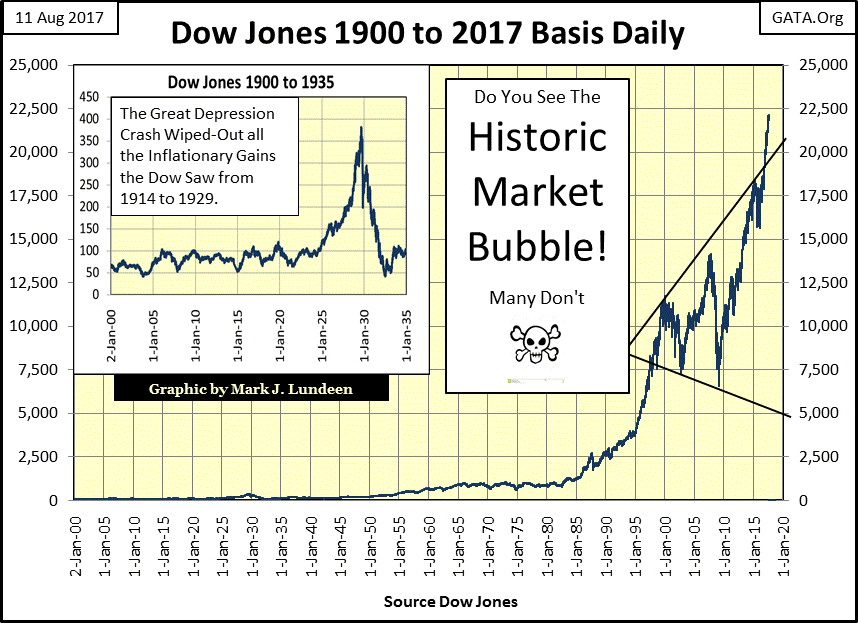
Do you disagree? Here’s a chart for the Dow Jones from 1900 to today. Take a moment and study what happened during the 1920s & 30s, and then the market advance since August 1982.
By my calculations, the Great Depressing Crash, in fact, deflated the Dow Jones back to where it was in 1903. But the configuration of the Dow Jones underwent variously, and significant alterations from 1903 to 1929, so one could disagree with that. But undeniably, the Great Depression crash wiped out all the gains of the 1920s’ bull market.
© Mark Lundeen
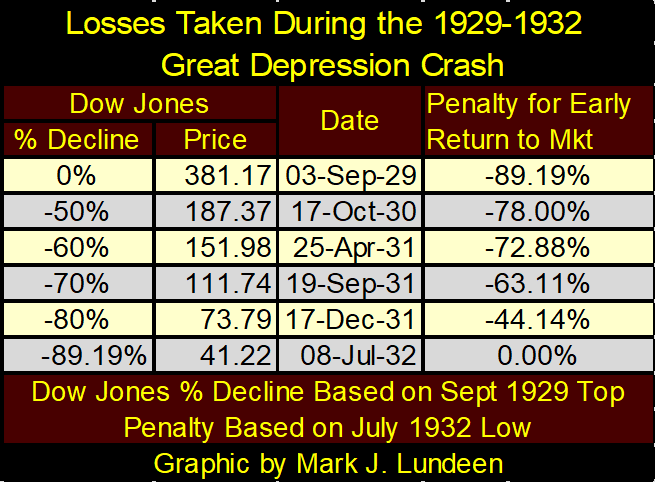
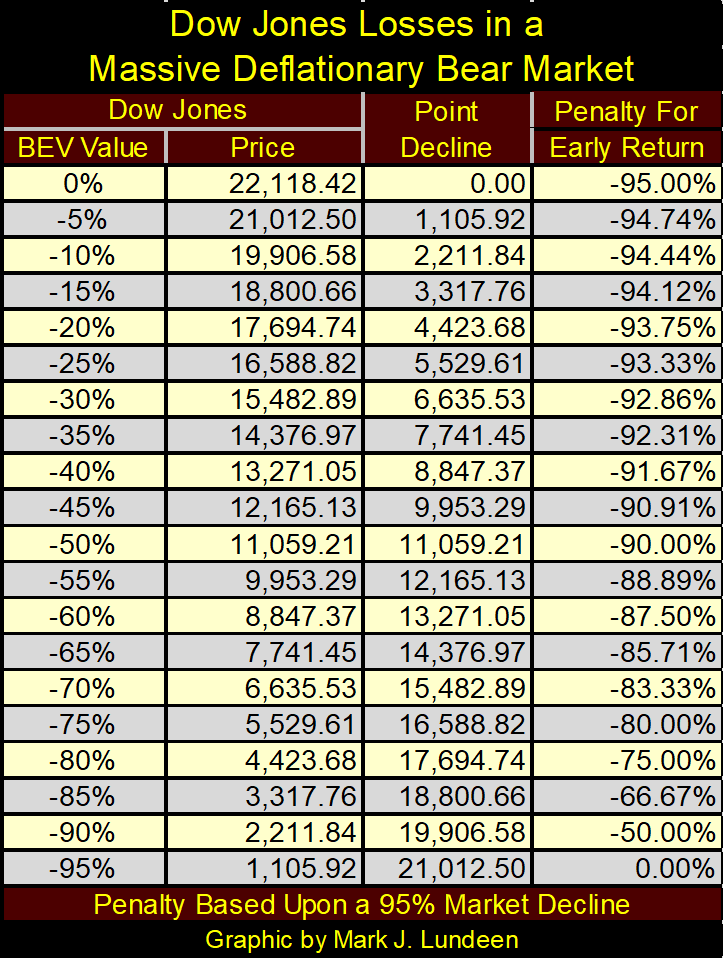
During the Great-Depressing Crash, bulls didn’t realize what they were up against. Seeing the Dow Jones down 50%, 60%, 70%, they wrongly believe it was time to return as the market was cheap. But in the table below, stocks continued deflating to ever cheaper prices, with a huge penalty for early re-entry into the market. Even by December 1931 (two years into the crash) with the Dow Jones down 80% from its 1929 highs, investors entering the stock market took a 44% loss by the time the market bottomed in July 1932.
© Mark Lundeen
But that was a long time ago. So why am I expecting another deflationary bear market on the scale of the 1929 to 32 market crash? One reason is I took more than just a few moments studying the chart above. The advance seen in the Dow Jones since August 1982 (as they were in the 1920s) is exponential, and that’s always dangerous in a market.
And I also consider the two methods of valuing the stock market; one is very popular with the bulls. Bulls instinctively realize that the market has been going up, so it must continue going up – and that is that. This is an excellent market model to maximize profits during bull markets, though its short comings on multi-year market declines are self-evident.
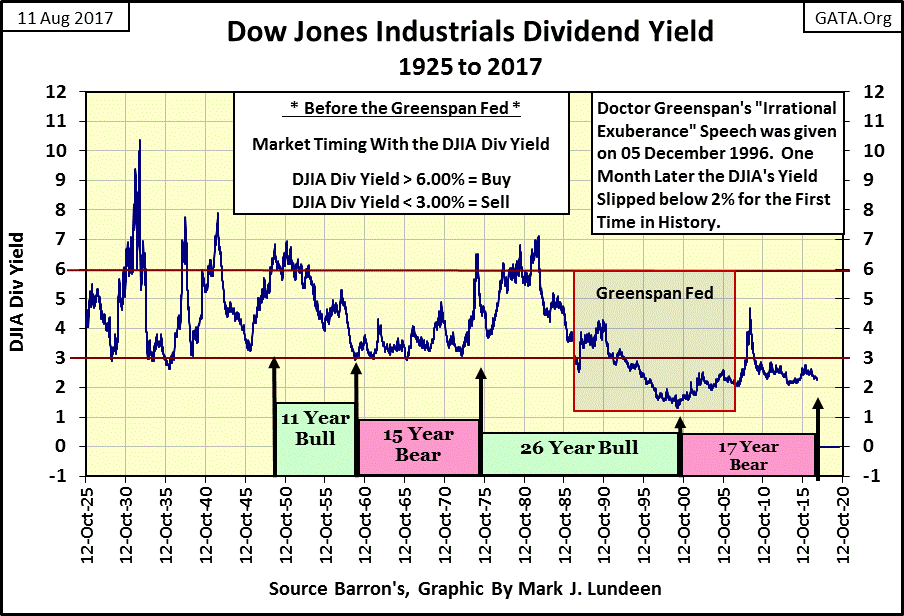
During bear markets, Mr. Bear uses dividends to value the stock market, or used to until Alan Greenspan became Chairman at the Federal Reserve in 1987. The old rule was buy when the Dow Jones’ dividend yielded something over 6%, and sell when the Dow’s yield declined down to 3% (see chart below).
This rule worked with remarkable effectiveness from 1925 to 1982, because for five decades bear markets began every time the Dow’s dividend yield declined to its 3% line in the chart below. With the exception of the Great Depression bear market, these bear markets terminated when the dividends for the Dow Jones yielded 6% or 7% (1925 to 1982).
This rule was sacked by Greenspan during his tenure at the Fed. At the top of Greenspan’s bubble in the high-tech shares, the Dow Jones on 14 January 2000 actually saw its dividend yield decline to 1.30%, at which point the High-Tech bear market began.
Since January 2000, we’ve seen two massive bear markets. But the dividend yield for the Dow Jones has never come close to yielding 6% as it always did at the conclusion of bear markets before 1987.
© Mark Lundeen
I’m a traditionalist. I’m reasoning that the only reason the Dow Jones hasn’t seen a dividend yield of something over 6% since 1982 is because the “policy makers” have interfered in the stock market with their quantitative easings and the manipulation of interest rates and bond yields over the past three decades. And that there is going to be hell to pay as the market returns to its historical parameters, such as selling when the Dow Jones is yielding only 3%, and buying when the Dow Jones is yielding over 6% rule of thumb.
By valuing the Dow Jones by its dividends, we can approximate how large of a bill Mr. Bear (and Hell) intends to present to the stock market, and it’s rather shocking!
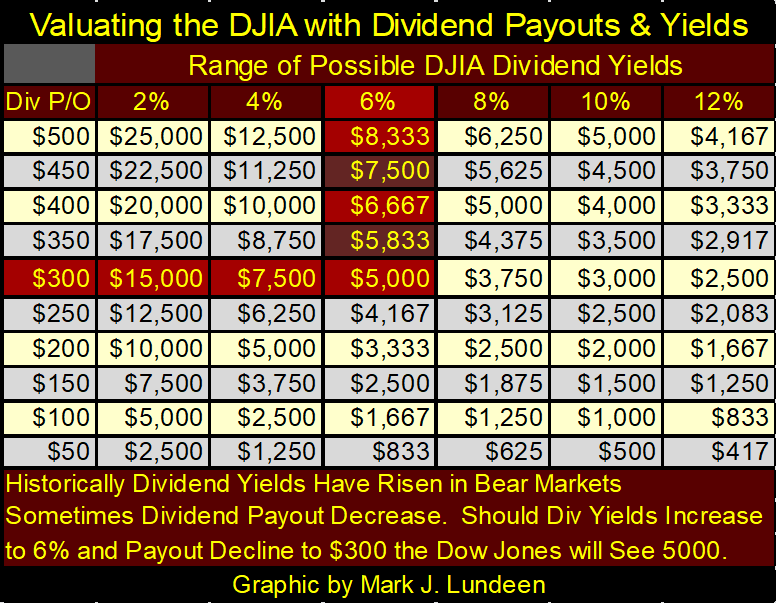
How does one value the Dow Jones with its dividends? It’s pretty simple. For instance, the Dow Jones closed the week at 21,858.32 with a dividend payout of $501.88. That produced a dividend yield of 2.296% (0.02296). If you now divided the $501.88 payout by the 2.296% (0.02296), you’ll return to the value of the Dow Jones.
The table below can be used to assess the potential declines in the Dow Jones in the coming bear market. Assuming the Dow Jones can defend its current payout of $501.88 (let’s call it $500), the Dow would have to decline to 8,333 for it to yield 6%, as was typical of pre-Greenspan bear-market bottoms. That would be a bear market decline of 62.32% from the Dow Jones’ last all-time high (22,118.42) of just this week.
But in the big bear markets, the Dow Jones has always seen its dividend payout reduced. It’s just a fact that big market declines go hand in hand with deep recessions or actual depressions in the general economy. Corporations find it impossible defending their dividend payouts when business is bad, and they are forced to cut back on their production and lay off employees.
This is especially true for Corporate America today, as they have taken on many trillions-of-dollars in debt for the frivolous purpose of funding their share buyback programs to support their share prices during a bull market. Come the bad times, this debt must still be serviced or they’ll be forced to declare bankruptcy. In the coming market decline, management will cut their dividend payouts in a New-York minute to service their debts.
During the Great Depression crash, Dow Jones’ dividend payouts contracted by 78% as its yield increased to over 10% in July 1932. A similar reduction in the payout would take the Dow’s payout down to the $100 line, and a 10% yield would fix the valuation of the Dow Jones at 1,000 in the table below. This is a total wipeout of all the gains the Dow Jones has made since 1982 in a historic 95.47% market decline – OUCH!
© Mark Lundeen
Am I predicting a 95% market decline in the Dow Jones? Nope. But after decades of corrupting influences acting on the financial markets from Wall Street, and Washington’s market “regulators” who stand by and do nothing to restore integrity to the financial markets, you best prepare yourselves for something horrible to happen when Mr. Bear comes back. And this 95% decline in the Dow Jones was constructed using increases in dividend yields and declines in its payout within historical ranges, so one can’t rule it out as a possibility.
Such a decline, if it happens, would take years to complete, with some bullish dead cat bounces within the bear market. And Mr. Bear, as he did during the 1929-32 market crash would use these bounces to lure in the unwary back into the market to their doom.
Here’s a table of the losses for the Dow Jones in a 95% bear market decline. The point to be made in this table is seen in the Penalty for Early Return column. Note how entering into the market after the Dow Jones has declined by 90%, would still result in a 50% loss in funds invested when the market makes its 95% market bottom.
© Mark Lundeen
In August 2017, any talk of a 95% market decline in the Dow Jones is completely theoretical; a wild speculation that people smarter than me would never indulge in. But ahead of us is something big, bad and historic as the economy, banking, corporate affairs and government at all levels has been managed so poorly for decades.
People in positions of public trust should be in prison for what they’ve done in the past, and for what they’re doing now. It’s not just that we should “lock her up,” we should lock them all up. Instead, the system allows them, and their successors to continue looting the economy, financial markets and Federal Treasury. Looking at the situation like that, how improbable is a 95% decline in the Dow Jones? Speaking for myself – I’m thinking of it.
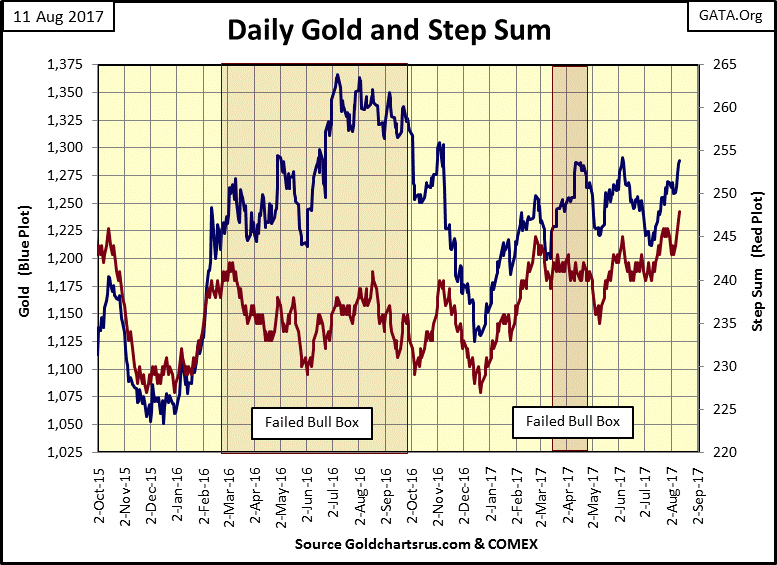
Here’s gold’s step sum chart. I note how gold’s price and step sum plots are now tracking each other, which is how things should normally be. The current advance is gold’s third attempt since April to break above its $1300 line in the chart. Will gold do it? With thermonuclear warheads rattling on both sides of the Pacific Ocean, it should.
But in America’s “regulated market place” I’m not counting on it. However, I’ve been wrong before. With gold only $12 from breaking above $1300, this would be an excellent time for me to be wrong again, and then we can start looking at gold’s highs of last summer.
© Mark Lundeen
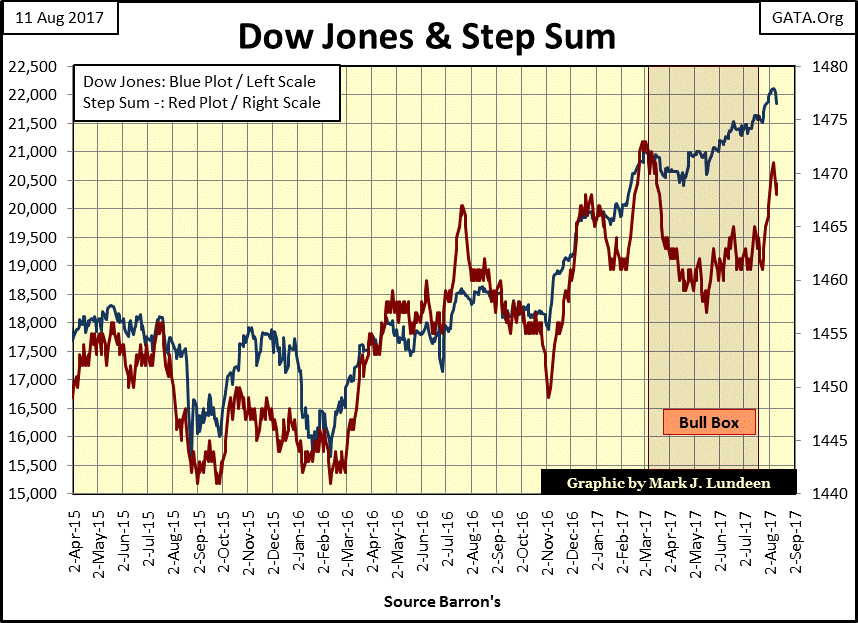
Looking at the step sum chart for the Dow Jones below, we sure didn’t see much of a bump in the price plot after seeing a bull box close. The step sum (Red Plot) had a nice surge since July 24th, is this all the bulls get (Blue Plot)?
That’s one way of looking at it. Another is with all the tension the market is under because North Korea is promising to reduce the United States into a pile of ashes under a thermonuclear flash, is this all the bears get?
Considering everything, I believe the venerable Dow is still capable of going on to new all-time highs, even if it sees a 5% correction in its BEV chart above (First Chart in Article).
© Mark Lundeen
This will be my short-term view of the market until we begin seeing days of extreme market breadth and volatility, and a general increase in bond yields and interest rates. So until then, if you’re making money in the market continue doing what you’re doing and get a good night’s sleep. If what you’re doing in the market is costing you money, this is a perfect time to get out and just watch the show from the sidelines. That’s how I see it, as in the back of my mind, I keep hearing a clock ticking because no market advances forever.
—
DISCLAIMER: This article expresses my own ideas and opinions. Any information I have shared are from sources that I believe to be reliable and accurate. I did not receive any financial compensation in writing this post. I encourage any reader to do their own diligent research first before making any investment decisions.

-

 Impact Investing2 weeks ago
Enfinity Launches First Solar Plant in Italy with Microsoft
-
 Crypto19 hours ago
Bitcoin Wavers Below $70K as Crypto Market Struggles for Momentum
-

 Markets1 week ago
Silver Dips Sharply, While Gold Gains Amid Mixed Stock Market
-

 Crowdfunding2 weeks ago
EvenFi Launches Run-Off Service to Protect Investors as Crowdfunding Platforms Exit







You must be logged in to post a comment Login