Markets
Dow Jones Hits Record Highs in 2024: Is the Bull Run Nearing Its Last Charge?
The Dow Jones hit 51 all-time highs in 2024, gaining 19.42% over the year. However, concerns loom about market sustainability as a potential peak nears in 2025. Rising consumer debt, inflation, and economic strain could impact corporate earnings and holiday sales. Investors are advised to lock in profits as risks at market tops intensify.

The Dow Jones this week closed at its 51st BEV Zero (New All-Time High = 0.0% in a BEV Chart), since it entered scoring position a year ago, in early November 2023. The first of these BEV Zeros was at 37,090 on 13 December 2023. This week’s BEV Zero was at 44,296. So, these fifty-one new all-time highs has pushed the Dow Jones up into market history, by 7,206 points, an advance of 19.42% in the past year. Not bad for thirty old fashioned, dividends paying, blue-chip stocks.

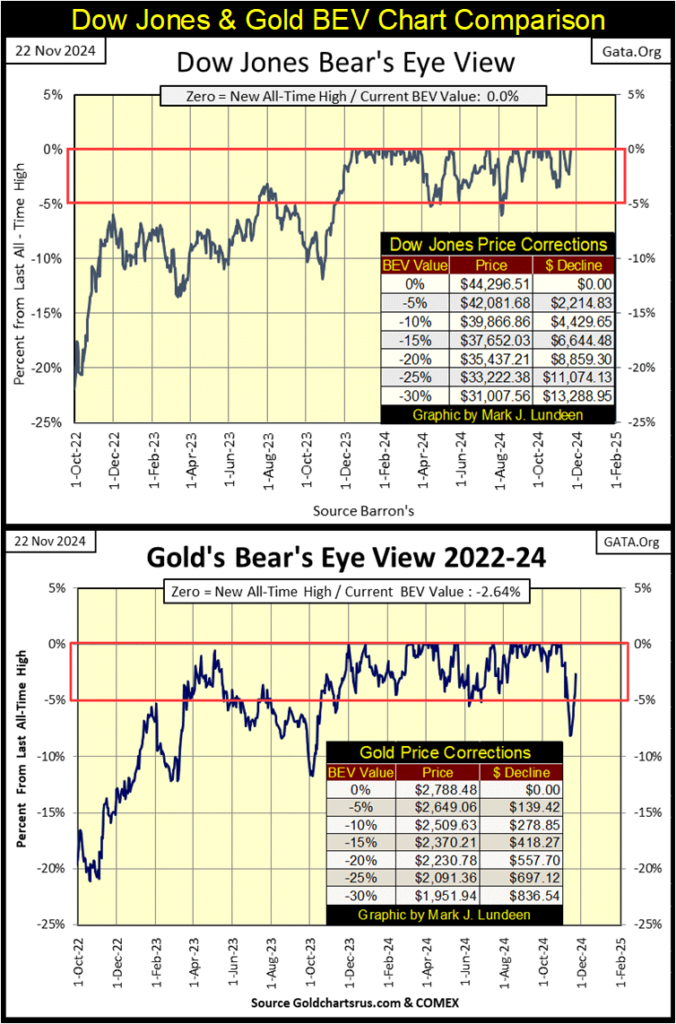
That is what happened in 2024. But what will 2025 look like? As seen in the above Bear’s Eye View chart for the Dow Jones, when the Dow Jones is in scoring position, daily trending between its BEV 0.0% and BEV -5.00% lines for a prolonged period, it’s advancing in a bull market, but no bull-market advance lasts forever.
When will this bull market advance see its Terminal Zero (TZ = Last BEV Zero of a Bull Market Advance)? It’s reasonable expecting it sometime in 2025, maybe earlier than you and I are thinking at this moment.
So, as long as the Dow Jones remains in scoring position, be like a cowboy, or cowgirl as it may be, and enjoy riding this wild bull. Should the Dow Jones’ BEV value fall to a BEV -6% to -8%, reduce your exposure to the market by beginning to sell a good portion of your holdings to lock in profits. When the Dow Jones closes below its BEV -10% line in the BEV chart above, get out, and stay out. You’ve had your fun, but now, that is all done.
I see McDonalds, one of the thirty companies in the Dow Jones, is having to continue its $5 meal until next summer, for fear its customers will go on a buyer’s strike.
I understand McDonald’s customers situation. After many decades of taking full advantage of the ample credit available at their bank, thanks to a gaggle of idiots at the FOMC, all of it at attractive rates, for;
- Mortgages,
- Auto Loans,
- School Loans,
- Credit Cards,
Most of American’s income is now used to service debt used for past consumption, and so, isn’t available for buying burgers and fries from Mickey – D’s, at today’s inflated prices. In 1970, McDonalds advertised that for a $1.00, one could get a burger, order of fries, a drink, and change back on the dollar. This was true.
For this reason; America’s “consumers” now being mired in debt, I’m anticipating the Christmas season for 2024 will be bleak.

How this will impact the stock market, and earnings for the Dow Jones seen below, is something we’ll just have to wait to see.

Here is the Dow Jones in daily bars below. These past few weeks, the Dow Jones saw some selling pressure. Then came Thursday and Friday of this week, where most of the recent losses were taken back, in fact this week closed at a new all-time high.
I wouldn’t be surprised seeing more all-time highs for the Dow Jones before New Year’s Eve for 2025. And that will be the way it is, until the Idiots at the FOCM decide to pull the plug on this market, sometime after Trump is in office again.

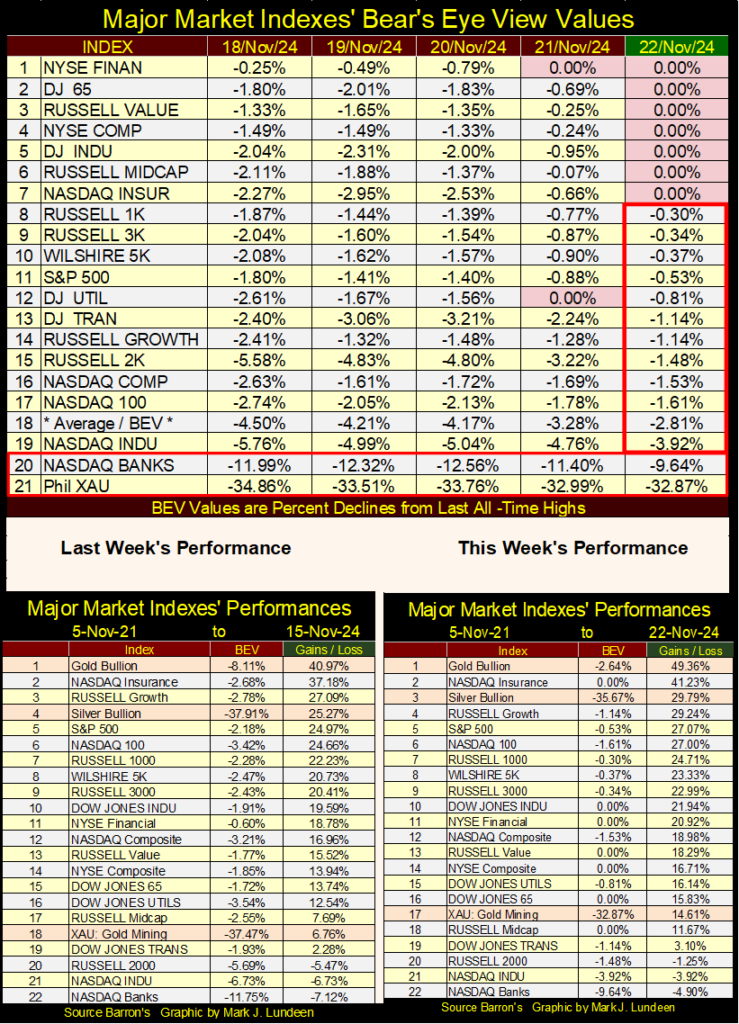
Looking at the major market indexes’ BEV values in the table below, this week ended on a very strong note, with seven of these indexes closing at new all-time highs, and everything else in scoring position, except for the banks and XAU, way down on the list.
Here is a chart for the average BEV value for these twenty major market indexes (#18 in table below) going back to 2006. Seeing this average of twenty major market indexes’ BEV value as deep into scoring position as its current BEV -2.81%, is not only a solid indication of how strong this market advance has been, but also how close this advance is to its ultimate market top.
And what is it about market tops that bulls never seem to understand? That is when risks to invested funds is maximum, and the potential for gains from invested funds become minimum.
When this average of twenty major market indexes’ BEV values is closing inside scoring position, as it is now, forget about buying. Now is the time to begin thinking of reasons to sell what you now have, to lock in profits. The time to think of reasons to buy, are when we see the big pull backs in the BEV chart below. But at such bear market bottoms, most people refuse to buy for ten cents, what they were very willing to pay a dollar for two years before.
Bull and Bear Market Psychology is perverse. So, to avoid any market perversion in your personal finances as 2024 comes to its conclusion, there is no better reason to begin selling, should the Dow Jones’ BEV values falls somewhere below -5%. That plus get entirely out of the market when the Dow Jones’ BEV value falls below -10%. Until then, enjoy the ride into market history.

As mentioned, and discussed above, here is the table listing Bear Eye View (BEV) values for the twenty major market indexes I follow daily.

Above are my market performance tables. This week everything was up, with gold holding on to its #1 position. Silver was up to #3, from #4 last week, with the XAU up to #17, from #18 last week. We’ll know when the bull market for precious metal assets is entering into its next phase, when the XAU takes the #1 position in the table above, and then stays there. Maybe sometime in 2025.
Here is gold’s BEV chart. Gold’s last BEV Zero was on October 30th. Following that, it began a ten-day plunge down to a BEV of -8.11% on November 15th. At last week’s close, it looked like the party was over for us gold bugs, then came this week, which saw gold close with a BEV of -2.64%.

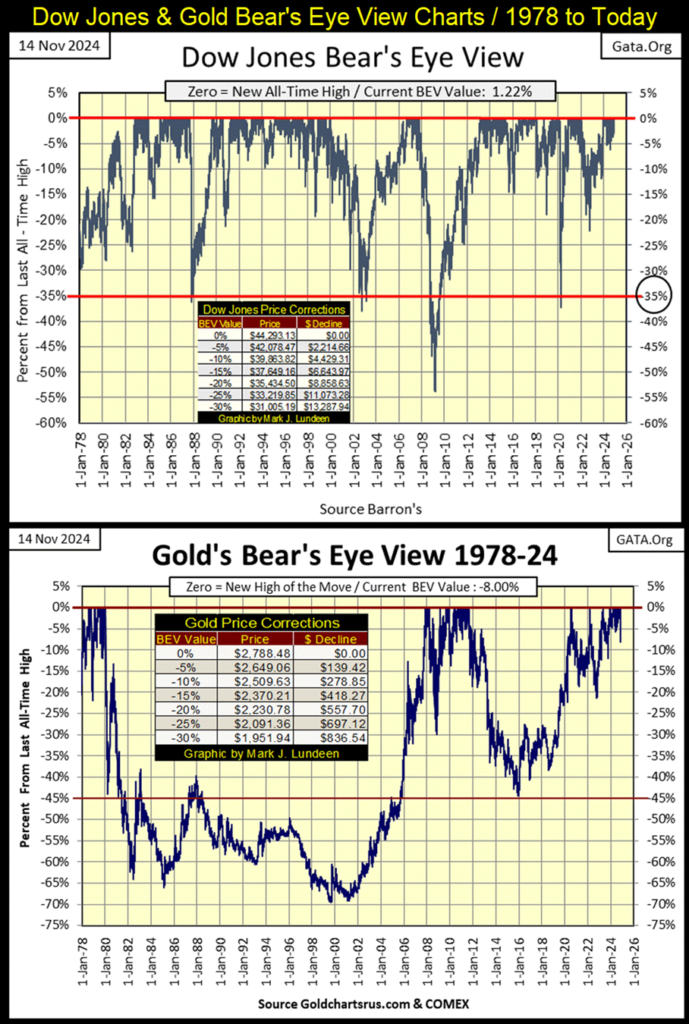
Last week, when gold closed with a BEV of -8.11%, I didn’t advise my readers to sell their gold or silver, because of what we see in the BEV charts below, a graphic I used last week, for the Dow Jones and gold.
Since August 1982, when it last closed below 800, the Dow Jones (my proxy for the broad stock market) has enjoyed a prolonged (unnatural?) series of bull market advances. It also saw a few major bear market declines. But having friends in high places, such as the idiots at the FOMC, who were always ready to “stabilize market valuations” with as large of an “injection” of monetary inflation, as necessary to get the party started again.
But these manipulative market gains of the past forty-two years can’t continue forever. So, in 2024, I’m very wary of any significant market declines, after seeing the Dow Jones rise from below 800 in August 1982, to over 44,000 in 2024. I’m thinking of a repeat of the Depressing 1930s. This is a constant, market concern of mine.

What would a repeat of the Depressing 1930s look like for the Dow Jones? Look at what happened to gold from 1980 to 2001 above, when gold fell 70% from its last all-time high of January 1980, after a prolonged two-decade market decline.
Gold was recovering from this 70% bear market decline, as it advanced to new all-time highs from 2008 to 2011, then it saw a 45% bear market from 2011 to 2015, a bear market bottom gold has yet to recover from.
How does a market recover from a bear market? Simple; the investing public finds the confidence the market in question, is once again an acceptable risk for their investment funds. Since 1980, this is something gold, and silver bullion, as well as the precious metal miners, have yet to achieve.
That after forty-five years, this is still true for gold and silver, as a mighty river of monetary inflation has flooded the worlds markets and economies, strongly suggests the “policy makers” have done everything they could to keep the public from discovering the virtues of holding the old monetary metals as an investment.
Look at the XAU below. At this week’s close, it’s up only 44% from its first day of trading in December 1983. That’s not possible, but there it is. Come the next big bear market, gold and silver mining will be the place to be, as exactly was the case during the Depressing 1930s.

So, for the most part, the public is out of precious metal assets. Which makes gold and silver bullion, as well as their miners, much, much less subjectable to a big bear market decline. Unlike the stock market, which today has the full participation of the investing public.
For that reason, seeing the Dow Jones decline below its BEV -10% level in its BEV chart below, is not the same as seeing gold fall below its BEV -10% line.

As I see these markets, gold is a long-term hold, with any significant market decline, a buying opportunity. As for the Dow Jones, it would be best to be completely out of the stock market when it finally closes below its BEV -10% line, and not be in a hurry to come back, until there is a good reason to return.
Looking at bear market bottoms since 1960, in terms of daily volatility for the Dow Jones in the chart below, seeing the Dow Jones’ BEV fall below its BEV -10% line, could trigger another bear market, or so I believe it will. If so, I wouldn’t be interested in the stock market, until the Dow Jones’ daily volatility’s 200Day M/A, spikes up to something above 1.75% in the chart below.
If you don’t keep daily data for the Dow Jones, to be able to see when its daily volatility’s 200Day M/A rises to 1.75%, an indicator one can do on a note pad with pencil, keep track of how many Dow Jones’ 2% days have occurred. During a bear market decline, the Dow Jones sees many days it moves up, and down by 2%, and more from a previous day’s closing price.

When daily volatility for the Dow Jones increases like this, the likelihood of the Dow Jones’s valuation deflating to something more than 40% from its last all-time high, becomes a real possibility.
With our world now bloated with so much debt, with an economic downturn, much of this debt will be defaulted on. Much of this debt is corporate debt, and debt default by a corporation means the corporation becomes bankrupt. The share price for a bankrupt corporation is greatly reduced. So, the Dow Jones’ ultimate bear market bottom in the coming bear market, may be a market decline of 70%, or more from its last all-time high.
Yes, I’m a BIG BEAR, but for as long as the Dow Jones remains in scoring position, I’m a short-term bull.
Gold in its step sum table below, has seen a remarkable recovery this week. A week that saw gold advance each day, and closing only 2.64% from its last all-time high. Something much better than last week’s BEV closing at -8.11%.
By the time I return in February, I expect gold will see additional BEV Zeros in its step sum table below.

But what about the Dow Jones in its step sum table above? Since October 21st, the Dow Jones has seen plenty of down days. Still, it has managed to generate BEV Zeros in spite of them. In fact, it closed this week with a new all-time high – impressive!
The thing I’m focusing on for the Dow Jones in the table above, is its daily volatility’s 200D M/A, which closed the week at 0.55%. This is the same data series I included a chart for, to illustrate bear market bottoms above. Bull market advances for the Dow Jones, are low market volatility markets.
For as long as the Dow Jones daily volatility’s 200D M/A remains this low, the Dow Jones is going to advance. But when daily volatility for the Dow Jones once again begins to spike upwards, towards its 1.00% line, and then higher, you can then be sure Mr Bear is coming for his pound of flesh from Wall Street. However, now in November 2024, I see no bear tracks on Wall Street.
__
(Featured image by geralt via Pixabay)
DISCLAIMER: This article was written by a third party contributor and does not reflect the opinion of Born2Invest, its management, staff or its associates. Please review our disclaimer for more information.
This article may include forward-looking statements. These forward-looking statements generally are identified by the words “believe,” “project,” “estimate,” “become,” “plan,” “will,” and similar expressions, including with regards to potential earnings in the Empire Flippers affiliate program. These forward-looking statements involve known and unknown risks as well as uncertainties, including those discussed in the following cautionary statements and elsewhere in this article and on this site. Although the Company may believe that its expectations are based on reasonable assumptions, the actual results that the Company may achieve may differ materially from any forward-looking statements, which reflect the opinions of the management of the Company only as of the date hereof. Additionally, please make sure to read these important disclosures.

-

 Markets1 week ago
Shockwaves of War: U.S. Strikes Iran, Markets Teeter, Global Risks Rise
-

 Crypto5 days ago
Coinbase Surges: Bernstein Targets $510 as COIN Hits Highest Price Since IPO
-

 Africa2 weeks ago
Bank of Africa Launches MAD 1 Billion Perpetual Bond to Boost Capital and Drive Growth
-

 Markets13 hours ago
Coffee Prices Decline Amid Rising Supply and Mixed Harvest Outlooks


