Markets
How Overvalued Is the Dow Jones?
The market analysis suggests the current Dow Jones rally may be losing steam, as indicated by its recent dip below the BEV -6% line for the first time in nine months. While further gains and potential new all-time highs are possible, failure to surpass recent highs and a return below critical levels could signal a bearish trend.
The Dow Jones saw some excitement this past week. A week that saw it close below scoring position for its first three days, with a recovery back into scoring position (BEV -4.13%) at week’s close. But on Monday’s close, the Dow Jones fell to a BEV of -6.06%. Not since last November, has the Dow Jones declined this far from an all-time high, out of scoring position (BEVs of -0.01% to -4.99%). Is there something to be learned here?
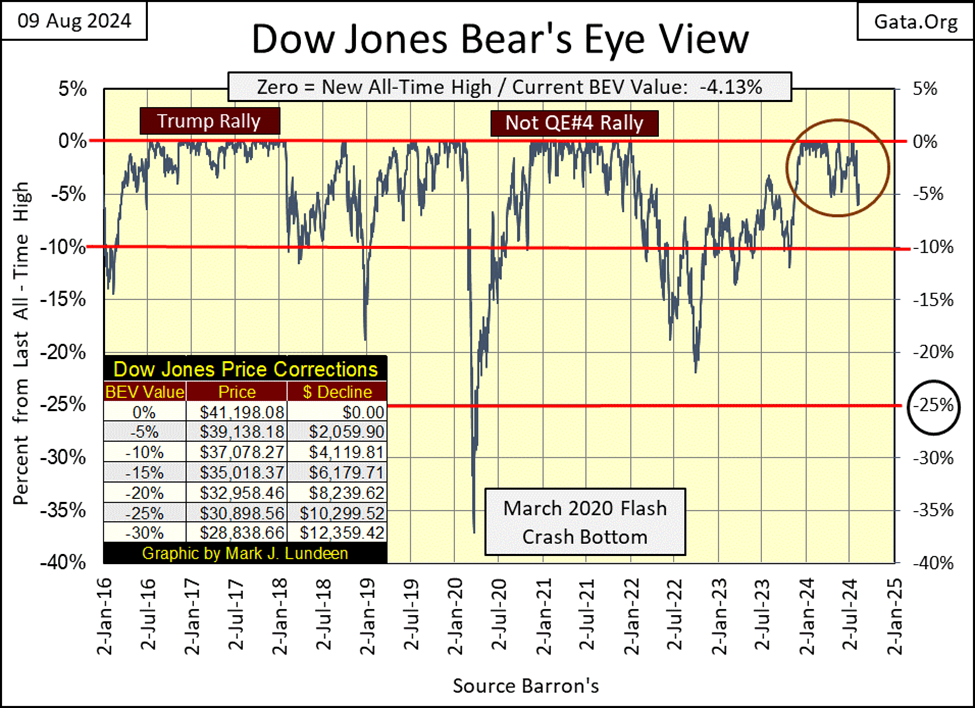
I’m not a Wall-Street Wizard. I’m just a market enthusiast; a serious student of the market whose study of the market is an ongoing process. So, let’s look at the Bear’s Eye View chart above, and note how the Trump and Not QE#4 rallies evolved, and eventually terminated, as each is different.
Though each rally is different, all rallies when viewed with a BEV plot, still have similarities. The one thing all market advances on a BEV chart have in common; is that for a prolonged period, the BEV plot remains in scoring position. For any market advance that takes an index to a new all-time high (produces BEV Zeros / 0.00%), it doesn’t make a new all-time high every day. Actually, most daily closings in an advance to new all-time highs, are not new all-time highs, but BEV daily closes between -0.01% and -4.99%; aka, in scoring position.
This week, for the first time since last November (nine months ago), the Dow Jones closed on Monday with a BEV value below its BEV -6% line. One must consider this to be a significant, and bearish event in the current advance. Still, the Dow Jones may see additional BEV Zeros, new all-time highs in the weeks to come. With its closing of the week in scoring position (BEV -4.13%), the BEV Plot demands we consider that a possibility.
But no major-market trend, be it up or down, last forever. Seeing the Dow Jones close on Monday with a BEV of -6.06%, strongly suggest the current advance is getting stale. If left to its own resources, I believe the Dow Jones current rally’s days are numbered. But since Alan Greenspan began dictating “monetary policy” at the FOMC, market advances have rarely been left to their own resources, if the idiots don’t approve of the new bearish trend.
I’m not hedging my market comments noting this. I’m just noting the reality of having a central bank regulating a market’s valuations, which is something they’ve done for decades.
Here is the Dow Jones in daily bars below. I looked a bit closer at it this week, and noted a bearish double top in the chart. Twice since early July, the Dow Jones has attempted, but failed to break above 41,500. On each failure, it saw a sharp reversal. This was especially true with its latest attempt, where last week, to the beginning of this week, the bottom fell out of the Dow Jones, before it bottomed near to 38,500.
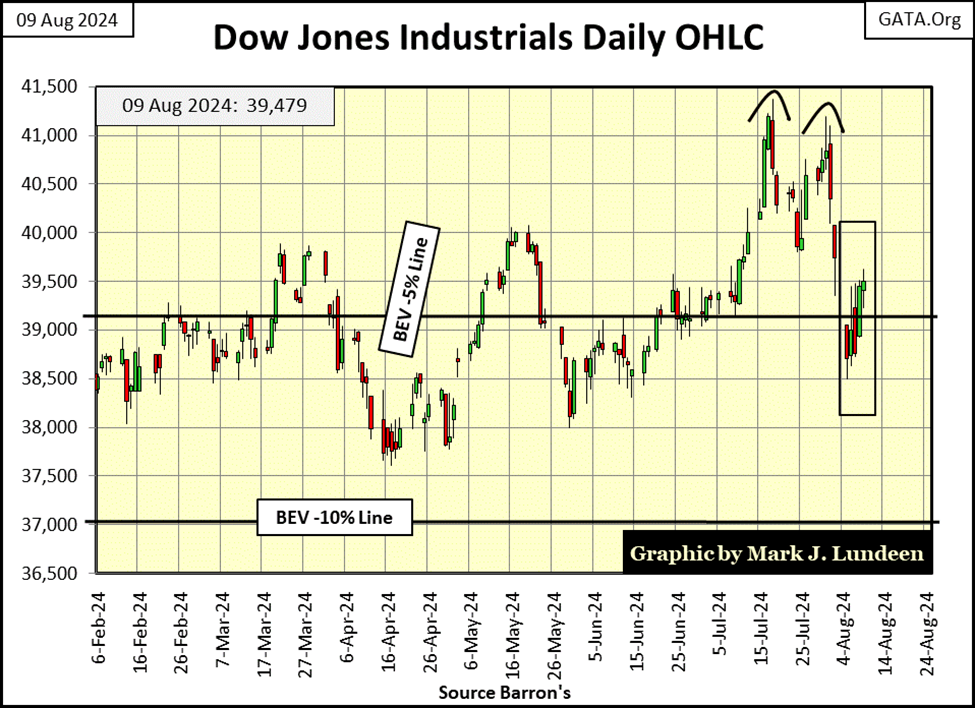
Note how the Dow Jones closed below its BEV -5% line for the first three days this week. That doesn’t look good, but it’s not necessarily a fatal flaw either. Actually, the Dow Jones could pullback below its BEV -10% line in the chart above, and still rise from there to new all-time highs.
Let’s see what the Dow Jones does from here. At week’s close, it was advancing, which suggests a big question; just how high can it rise from here? Will it advance over its highs of two weeks ago, and then on to new all-time highs? That done, it would make a mockery of any bearish innuendo I’ve implied so far in this week’s article.
But, and it’s a BIG BUT, but if the Dow Jones stalls below its highs of two weeks ago, and then again breaks below its BEV -5% line, below Monday’s BEV of -6.06% (38,703), that would be very, very bad.
Which will it be? Like me, my readers will just have to wait to see. But up here, where I sit in the market’s peanut gallery, I want my readers to know there is beer and hot dogs being bet that the top of the current Dow Jones advance is in: the 41,198 made on July 17th.
Next is the BEV values for the major market indexes I follow. No new all-time highs (0.00% / BEV Zeros) this week. On Monday’s close, August 5th, only two of these indexes closed in scoring position; NASDAQ Insurance Index (#2) and the Dow Jones 65 index (#4). On Friday’s close, only seven of these indexes closed in scoring position.
This is a big change from where the market was on July 16th, where it closed with eleven of these indexes closing at a new all-time high, with an additional four of them closing in scoring position. The Dow Jones itself closed at its last all-time high a day later; July 17th. But for the broad market, as things stand now, I expect it will be July 16th that will prove to be its actual market peak of this advance.
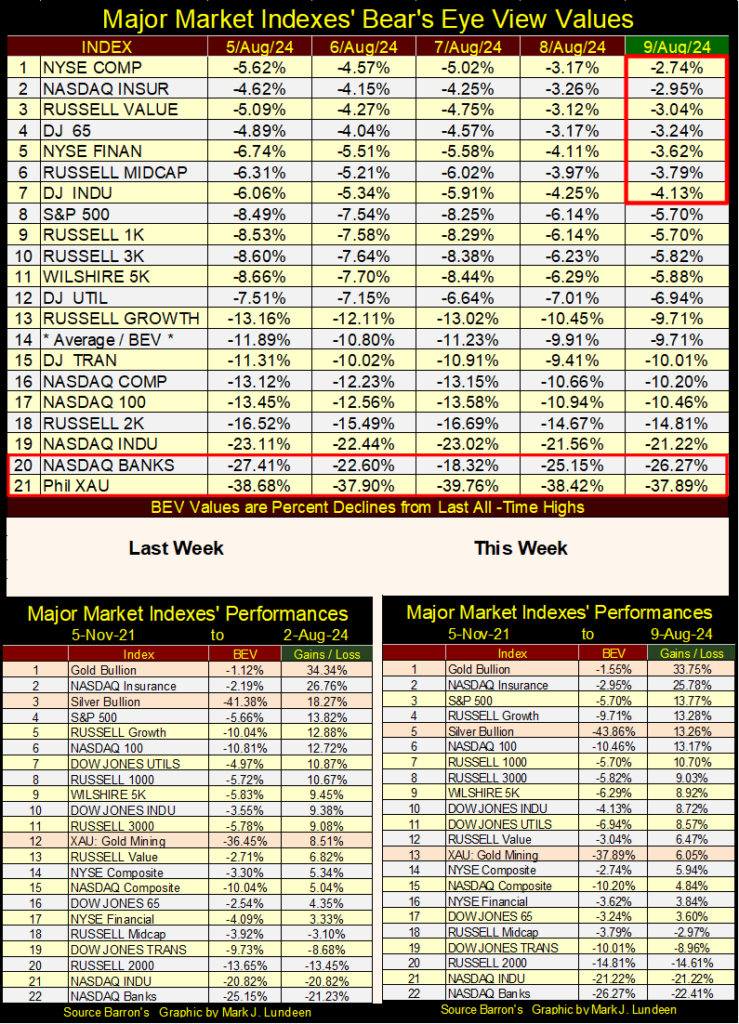
In the performance tables above, most, if not all these indexes were down for the week. But gold is keeping an iron hand on its #1 spot, and has for a long time.
This week, silver (#5) and the XAU (#13) went the wrong way for gold bulls like me. Well, shiver-me-timbers, what can I do about that? Nothing. As long as I can still get a good night’s sleep, I can live with that, if not like it. Patience is a virtue at times like this.
For a long time, since I began writing for the internet, before the credit crisis of 2007-2009, I’ve claimed stock market valuations are grotesquely overvalued. That is a big statement of fact I’m asking my readers to swallow. Really; grotesquely overvalued compared to what? Compared to where they were before August 1987, since Alan Greenspan became Chairman of the Federal Reserve System (aka: FOMC Idiot Primate), as seen by examining the dividend yield for the Dow Jones below.
Mark, why are you so disrespectful towards members of the Federal Reserve System; calling then idiots and such?
I’m being generous, for what they do with their “injected liquidity;”
• erode the purchasing power from charitable foundations’ reserves, and retired people’s fixed-income resources via CPI inflation,
• inflate bubbles in markets that ultimately lead many into ruin,
• supply politicians with trillions-of-dollars of inflation, for wars and social programs that do absolutely no good, and haven’t for many decades.
I could, and maybe should call them something worse, for an idiot doesn’t know any better, while the “idiots” at the FOMC do.
For decades, these idiots have sunk their meat-hooks deep into the internal workings of the financial markets, and they know it.
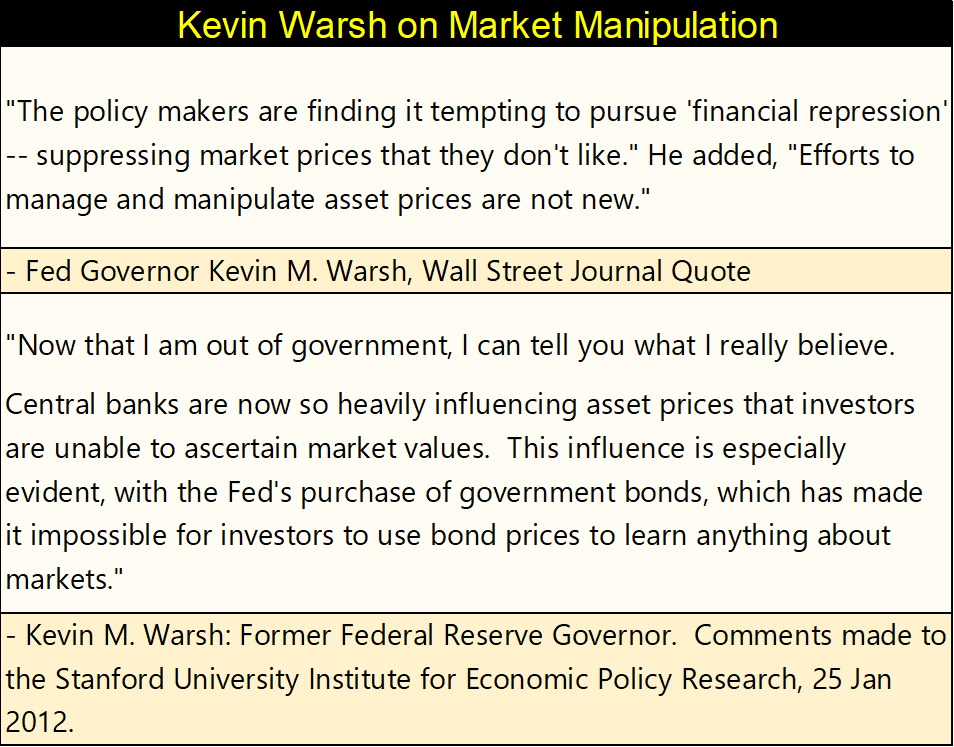
For decades, market prices are no longer the result from the give and take of producers and consumers / sellers and buyers in a free market, but what the idiots at the FOMC, people who neither produce or consume anything, would have them be, with both the winners and losers in the markets, decided by them.
How do they accomplish this? To support market prices, they create as many dollars-of-inflation, as necessary to overwhelm any “undesirable” selling pressure in a market. To suppress market prices, their goons; contracted naked-short sellers from Wall Street, flood the futures market with insincere promises to deliver supply sometime in a future that never comes, overwhelming phantom supply be that gold, silver, or crude oil, to overwhelm any “undesirable” buying pressure in a market.
These people have no accountability to the public, or to the US Government. It was designed that way when the Federal Reserve System was created in 1913. This kept political influence out of “monetary policy,” choosing instead to have “men-of-science” manage “monetary policy.” These people, these “social scientists” have always held impressive credentials from America’s leading Universities. But they are still human, and some are so vain. Like Alan Blinder below.
I remember when Professor Blinder was appointed Vice Chairman of the Federal Reserve, for days he made the circuit of financial programs on TV, telling everyone who cared to listen, what the last duty of a central banker was;
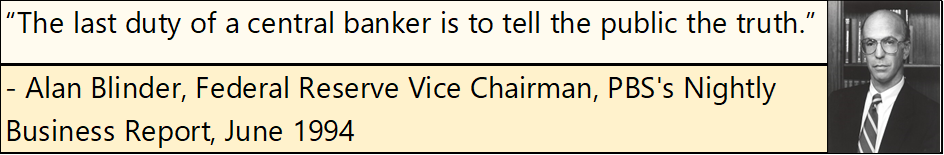
And who is Alan Blinder? Well, he is someone who has never had a real job in his life. His Wikipedia page would have you believe the following.
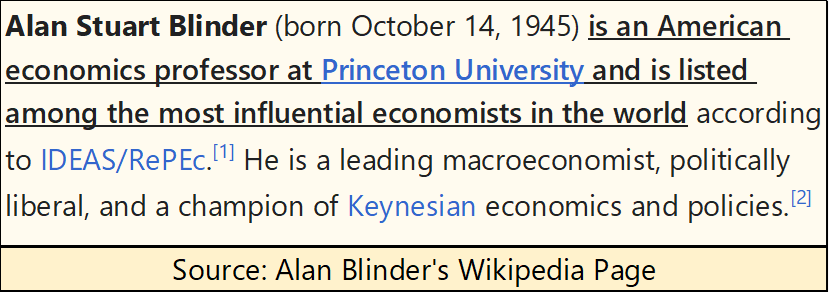
Alan Blinder is a “man-of-science,” of the sort that has always dominated the Federal Reserve System. I’ll give you a little science these people understand, and apply to their “monetary policy,” something from Charles Darwin’s 1859 edition of The Origin of Species: the strong eat the weak.
Okay, so what about the stock market being grotesquely overvalued? Making that judgement, I’m using the Dow Jones as my proxy for the broad market. The Dow Jones contains the shares of only thirty large blue-chip, dividend paying corporations, while the NYSE daily currently sees about 2,400 issues trading daily, twenty years ago, the NYSE saw over 3,400 issues trading daily.
The Dow Jones is but a small part of the stock market, but its companies are important components of the American economy. If the stock market is in a bull or bear market, the Dow Jones is sure to catch broad-market’s primary trend.
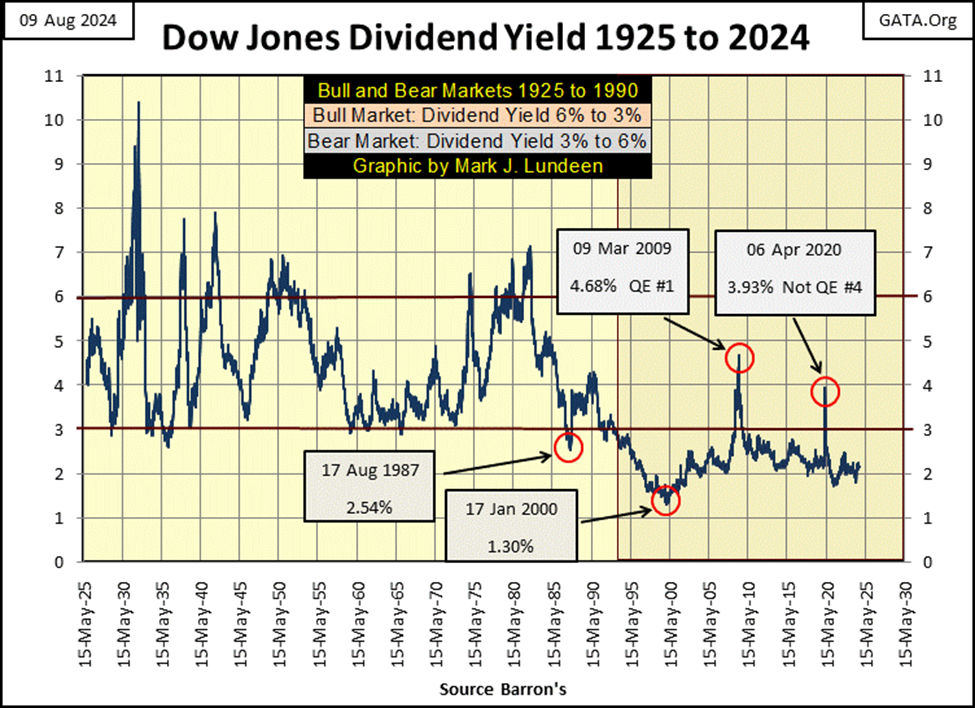
With all the above noted, let’s now look at the Dow Jones dividend yield going back to 1925 (chart below, far below – sorry), courtesy of the dusty old pages of Barron’s, published for many decades.
From 1925 to 1990 (six and a half decades), investors could time profitable entry and exits points, into and out of the stock market by simply following the divided yield of the Dow Jones;
• buy when the Dow Jones was yielding something over 6%,
• sell when the Dow Jones dividend yield declined near to 3%.
Doing so didn’t guarantee an investor would get out at the absolute top of a bull market, or buy at the absolute bottom of a bear market. Still, following this simple rule-of-thumb kept people out of the stock market during the Great Depression’s market crash, and in the market during the major bull markets of the 20th century, until 1990, when this model fell apart.
What went wrong with it? Alan Greenspan became FOMC Idiot Primate in August 1987. As seen below, in August 1987, the Dow Jones’ dividend yield fell to a then historic 2.54%, the lowest yet to be recorded. It was time for a big-bear market on Wall Street.
Then on 19 October 1987, every computer on Wall Street began mindlessly shorting the market * at the same time * because of what was then called “portfolio insurance,” intended to protect the major Wall Street Houses from a bear market decline they knew was pending. Seeking to protect themselves from a bear market, Wall Street’s “portfolio insurance” triggered the largest daily market decline since 1885, when Dow Jones first published its stock average.
At the close of trading on 19 October 1987, the Dow Jones saw its largest one day decline in its history, down 22.61% from the day before. People everywhere freaked out! That night, ABC News used the Muppets to explain what happened on Wall Street that day. Kermit and Cookie Monster, never before, or since have spoken so wisely of the ways of Wall Street to the general public.
It was with the world in this state of shock that Alan Greenspan entered the arena of “monetary policy.” Though preempted by Cookie Monster, ABC News still gave the then new Federal Reserve Chairman, Alan Greenspan a few moments on prime-time TV, where he simply stated; the FOMC would “provide ample liquidity to the market.” Which for the first, but not the last time, he did.
Following October 1987, things were never the same, as seen below with the Dow Jones dividend yield. For the past thirty-four years, the Dow Jones’ dividend has never seen a yield greater than 4.68%, at the bottom of a significant market decline. Historically speaking, in terms of the Dow Jones Dividend Yield, not since 1982 has the stock market seen a proper bear-market bottom, one that saw the Dow Jones dividend yield rise to something above 6%.
The Sub-Prime Mortgage Bear Market’s 54% market bottom (#2 in table below) was the second deepest percentage decline the Dow Jones has seen since 1885, exceeded only by the Great Depression’s 89% bear market bottom of July 1932.
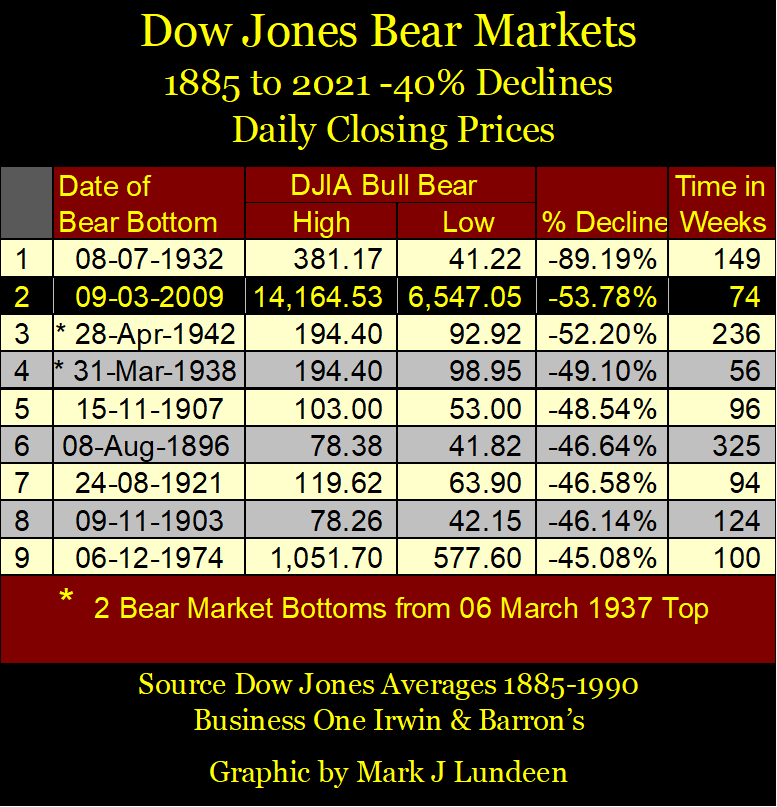
But note how in July 1932, the Dow Jones yielded over 10% in the chart below. At the March 2009, 54% bottom for the Sub-Prime Mortgage bear market (6,547.05), the Dow Jones yielded only 4.68%. Far below the old pre-Alan Greenspan (pre-August 1987) standard for where bear markets should bottom.
In 2009, the Dow Jones would have deflated much deeper, decline in valuation until its dividend did yield something over 6%, but some idiots stopped that from happening. In March 2009, the Dow Jones’ dividend payout was $310.43. For the Dow Jones to yield 6% with a payout of $310.43 in March 2009, it would have had to deflate to 5,173.83. That would have at a minimum, resulted in a 63.5% bear-market decline.
Such a bear-market bottom was a market event the idiots at the FOMC, US Congress, financial media, and investing public would not allow. So, in 2008 Congress gave the idiots some “new tools” to “stabilize market valuation.”
Below is a photo of then FOMC Idiot Primate; Doctor Benjamin Bernanke discussing with his fellow idiots, on how best to implement his upcoming Quantitative Easing #1 in early 2009, the “policy initiative” that placed a bottom to the sub-prime mortgage market crash in March 2009.
Since 2008, the idiots with their four Quantitative Easings, have manhandled the Dow Jones dividend yield back below 3%, as they’ve inflated the valuation for the Dow Jones to over 41,000 in 2024.
Those times the Dow Jones’ dividend did attempt to break above 6%, via a major market decline;
• sub-prime mortgage crisis, 2009,
• March 2020 flash crash,
the FOMC implemented a Quantitative Easing (QE – to flood the market with monetary inflation), to “stabilize market valuations,” to the point where dividend yields for the Dow Jones were once again driven below 3%.
So Mark, what is your problem with people, people much smarter than you, managing the market to protect the investing public from the horrors of a massive bear market on Wall Street? Thinking bad of this, maybe proves that you’re the idiot.
Maybe, and then maybe not. I object to them doing this, because bear markets have a justified place in the market cycle and economy; they provide the vital function of clearing away unprofitable credit creation from corporate and individual balance sheets.
A painful process for sure, but without bear markets, past dead-weight debt creation only accumulates, growing ever larger, and will ultimately consume the profitable output of the economy, resulting in total economic collapse. Every former college student stuck with more school, and credit-card debt, than their income can service, will eventually become painfully aware of what I’m talking about.
That the stock market is as high as it now is, is just a denial of reality by these idiots. Over-educated idiots who believe they can forever thwart Mr Bear, and his clean up crew’s best efforts to write off decades of malinvestments, now carried on the balance sheets of corporate American, and individual Americans’, both groups who have been living far above their means for decades, via credit supplied to them by the idiots at the FOMC.
Okay Mark, maybe you’re not an idiot. But how overvalued is the Dow Jones, my proxy for the stock market? Using the Dow Jones dividend as my model, in the table below, we’ll discover the grizzly details of the pending bear market, now lurking just over the horizon.
The math is simple. We treat the Dow Jones as a bond to compute its dividend yield, in the left table below.
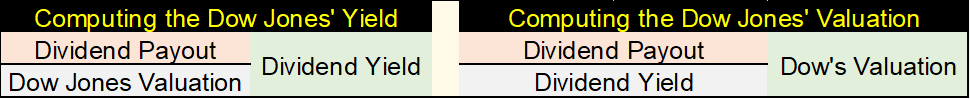
So, we can also use its dividend payout and yield to compute its valuation, by taking the Dow Jones dividend payout, and dividing that by its yield, as in the right table above, which is exactly what I did in the table below.
Unlike a bond, the Dow Jones is not fixed income, so its dividend payout can, and will change. This week the Dow Jones was paying out $853 in dividends. We’ll call that $850 for the table below.
For the Dow Jones to once again yield 6% with a payout of $850, the Dow Jones would have to deflate in valuation down to 14,167, that would be a 65.61% market decline, from the Dow Jones last all-time high of a month ago.
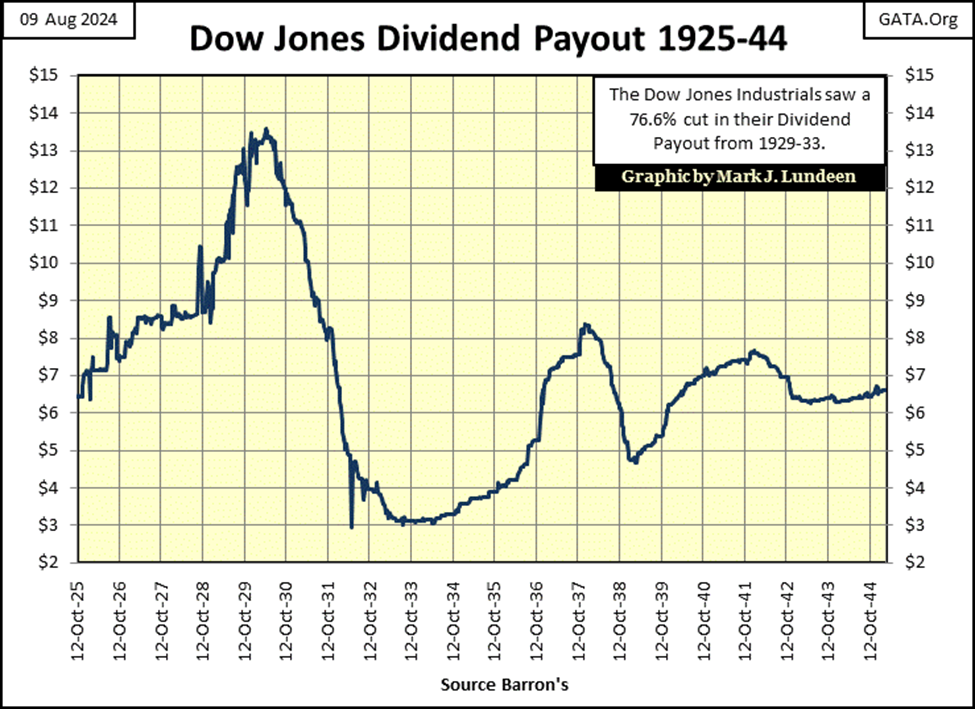
It would be unrealistic expecting the Dow Jones to maintain its current payout of $853, during a deep recession or actual economic depression, something I fear is coming our way. During the Great Depression, Mr Bear cut the Dow Jones dividend payout by 77%, as its dividend yield soared above 10%.
That’s seem extreme to me, so let’s cut the dividend payout below to $450, and have the Dow Jones yield 8%. A 50% cut in dividend payout, and an 8% yield is something the Dow Jones has seen before. What that would do to us now can be seen below: Dow Jones at 5,625, an 86.34% reduction in the Dow Jones from its last all-time high of a month ago.
What happens when we take the dividend extremes from the Great Depression, cut 75% from the Dow Jones dividend payout, and have it yield 10%? In the table below, that would take the Dow’s payout down its $200 row. With a 10% yield, that would fix the Dow Jones valuation at 2,000 in the table, a 95.14% market decline for the Dow Jones, a market decline that exceeds the July 1932, 89% bottom in the Dow Jones.
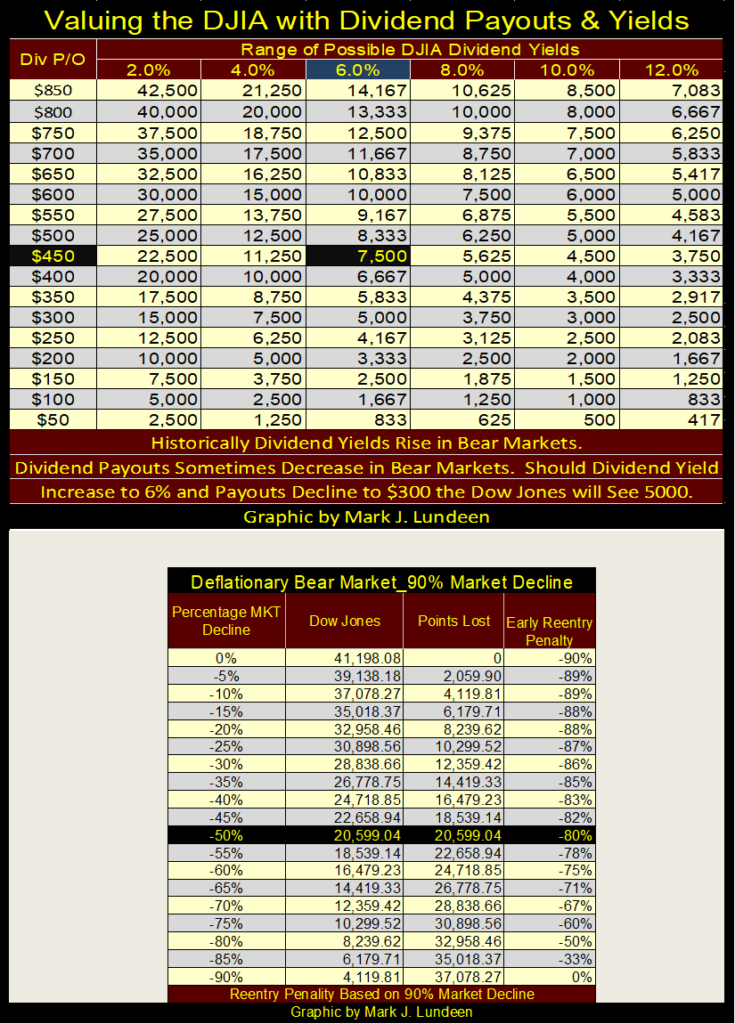
So, exactly how grotesquely overvalued is the Dow Jones now in August 2024? I don’t really know. But anticipating a 70% decline in the Dow Jones (12,359), at a minimum, isn’t outside the possibilities of this market, when once again the idiots at the FOMC, no longer are able to maintain the Dow Jones dividend yields below 3%.
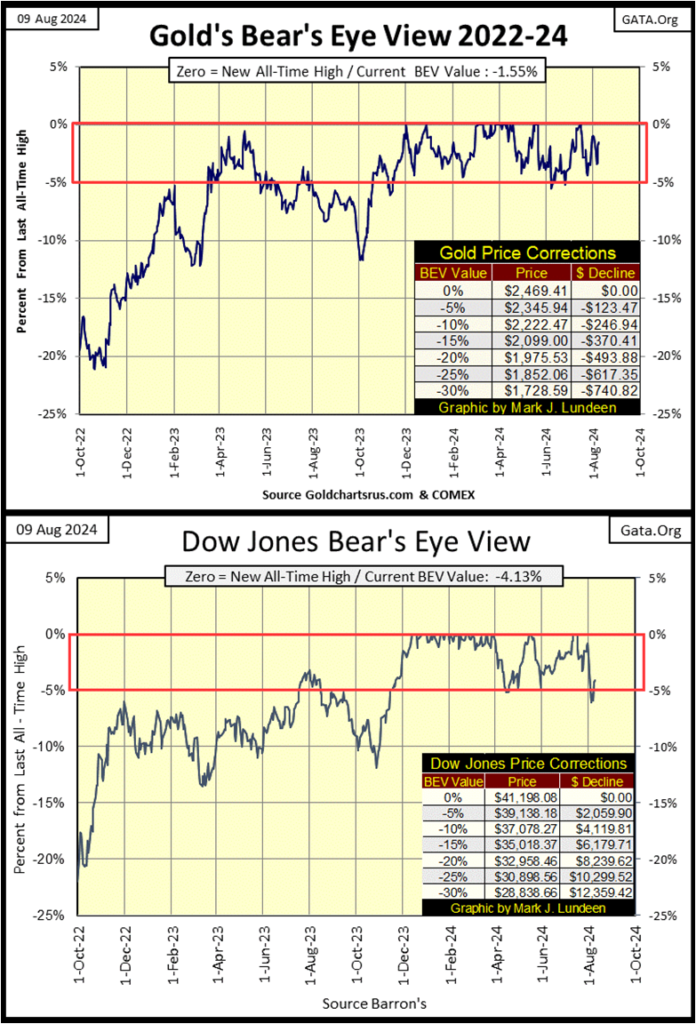
Now on to gold’s BEV chart below. Last month, gold’s BEV declined to -4.36%, but unlike the Dow Jones, hasn’t since last November broken below scoring position. Well maybe a tad below in June, but I’m ready to forgive gold for that moment of weakness, as it soon thereafter made a new all-time high, and closed this week with a BEV of -1.55%.
I did something different this week in the graphic below, combined the BEV charts of both gold and the Dow Jones, from 01 October 2022 to this week’s close. Take a moment to study, and compare them.
Not always, but gold is typically countercyclical to the Dow Jones. When one is in scoring position, and making new all-time highs, the other isn’t. This isn’t a law of the market cut in stone, but generally is how things go in the market.
But since October 2022, this hasn’t been so. From October 2022, to November 2023, their BEV plots are remarkably similar to each other, if not exactly so. Things really get odd when we look at these BEV charts from last November, to the close of this week.
Both entered scoring position (BEVs of -0.01% to -4.99%) in early November last year, and have remained there since. While in scoring position, gold has made twenty-four new all-time highs, the Dow Jones has made twenty-nine new all-time highs. That’s interesting.
What will also be interesting, is seeing how much longer this very unusual alignment for gold and the Dow Jones will continue, because this isn’t normal market action.
One of these days, either gold or the Dow Jones is going to test the deeper levels in their BEV chart, while the other continues adding new all-time highs (BEV Zeros) to its score card.
Yep, there is beer and hotdogs being wagered as we speak, up here in the market’s peanut gallery, about who will be the winner and loser in this contest of will in the market.
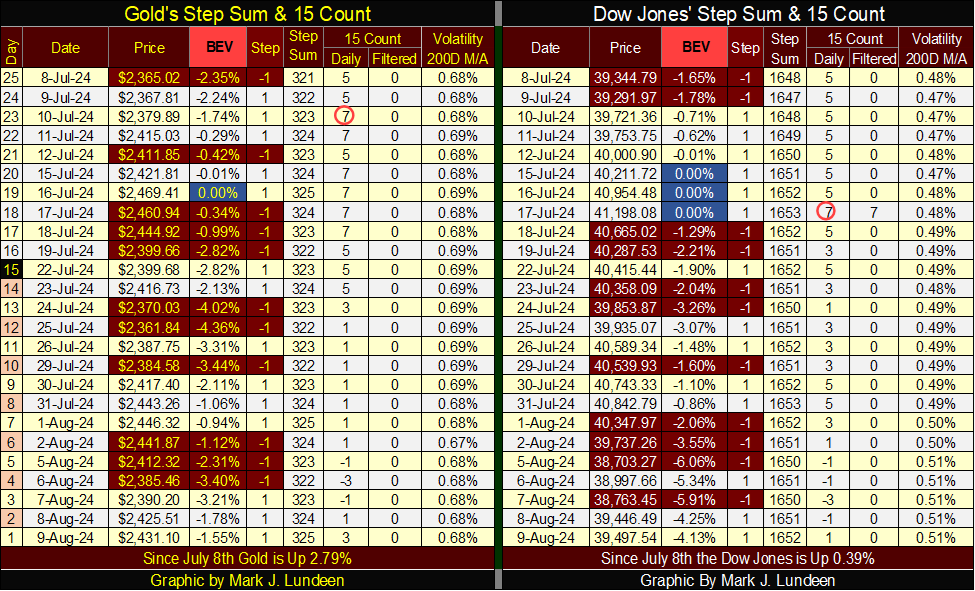
Who am I betting on? I’m not going to tell you, but I will give you a little clue. In the past seven NYSE Trading Sessions, the Dow Jones daily volatility’s 200D M/A increased from 0.49% to 0.51% in the table below. That’s a big jump in daily volatility for the Dow Jones, and rising volatility is * NEVER * good for the Dow Jones.
__
(Featured image by Dimitri Karastelev via Unsplash)
DISCLAIMER: This article was written by a third party contributor and does not reflect the opinion of Born2Invest, its management, staff or its associates. Please review our disclaimer for more information.
This article may include forward-looking statements. These forward-looking statements generally are identified by the words “believe,” “project,” “estimate,” “become,” “plan,” “will,” and similar expressions, including with regards to potential earnings in the Empire Flippers affiliate program. These forward-looking statements involve known and unknown risks as well as uncertainties, including those discussed in the following cautionary statements and elsewhere in this article and on this site. Although the Company may believe that its expectations are based on reasonable assumptions, the actual results that the Company may achieve may differ materially from any forward-looking statements, which reflect the opinions of the management of the Company only as of the date hereof. Additionally, please make sure to read these important disclosures.


TopRanked.io Weekly Affiliate Digest: What’s Hot in Affiliate Marketing [Bovada Affiliate Program]
This week, we're mashing up 80s tech with 2020s private messaging apps. Why? Because Big Tech just dropped a big...


Euro Stablecoins Struggle to Compete with Dollar Dominance in Crypto Markets
Euro stablecoins remain marginal despite the euro’s global importance, with minimal trading volume compared to dollar rivals like USDT and...


Gilead Sciences Advances Growth Strategy with Focus on HIV, Oncology, and Innovation
Gilead Sciences focuses on developing treatments for HIV, cancer, and inflammatory diseases, driven by blockbuster drugs like Biktarvy. Growth relies...

Casablanca Stock Exchange Profits Surge in 2025 as Growth Momentum Strengthens
In 2025, Casablanca Stock Exchange profits rose 40% to MAD 50.9 billion. Net income grew 22.3%, driven by strong industrial...


Credibur Scales Rapidly: €2 Billion in Structured Debt Facilities in Six Months
Infrastructure fintech Credibur has added over two billion euros in structured debt facilities within six months. Its platform connects lenders,...
 |
|
 |  |
 |
|
-
 Cannabis2 weeks ago
Aurora Shifts Strategy Toward Global Medical Cannabis Markets
-

 Markets6 days ago
Dow Jones Tests Correction Zone Amid Bullish Momentum and Bubble Concerns
-

 Crowdfunding3 days ago
Democratizing Farmland Investment: The Rise of Farm Fractions in Agritech
-

 Crowdfunding2 weeks ago
Cyberpunk Trading Card Game Surges Past Goals on Kickstarter