Business
A Million Dollars Invested: 1938 to 2002 Bonds or Stocks?
In 1938 dollar terms, the investment in the Dow Jones still lost money, but not enough to crimp the lifestyle of a 1938 millionaire who somehow survived to 2002. This is not so for the investment in bonds, which in 1938 dollar terms, saw their million dollars from 1938 reduced to only $10,077 in 2002. I believe history will show that all fixed-income investment only benefits the creditor, if the currency the loan is based on, is backed by gold or silver.

The Dow Jones didn’t break down this week. Instead, it closed above its BEV -10% line on Friday’s close. So, what BEV line becomes critical now?
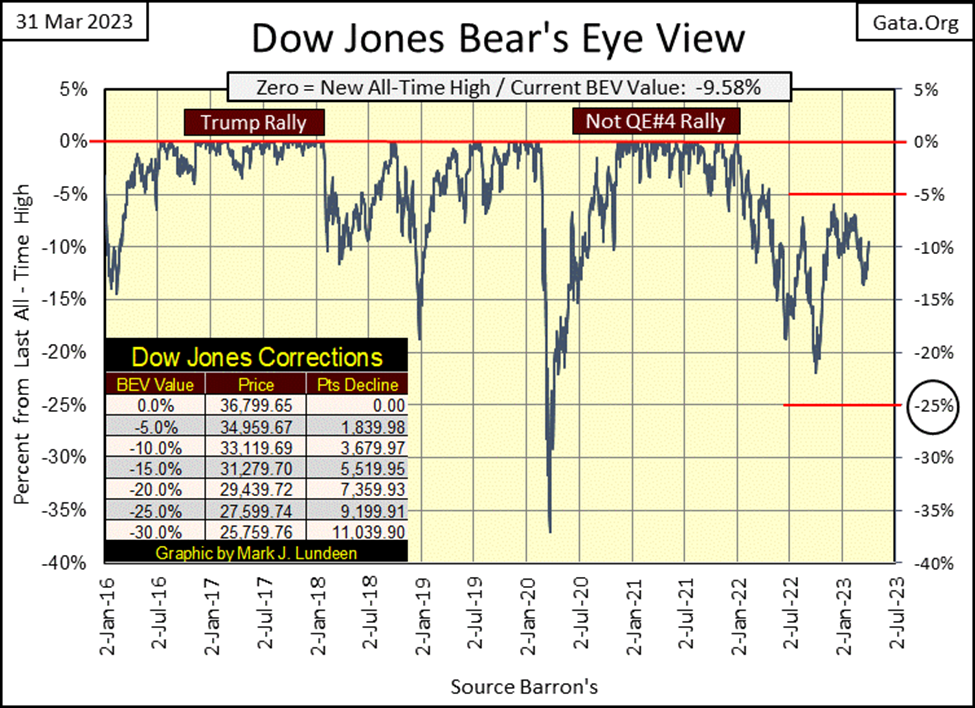
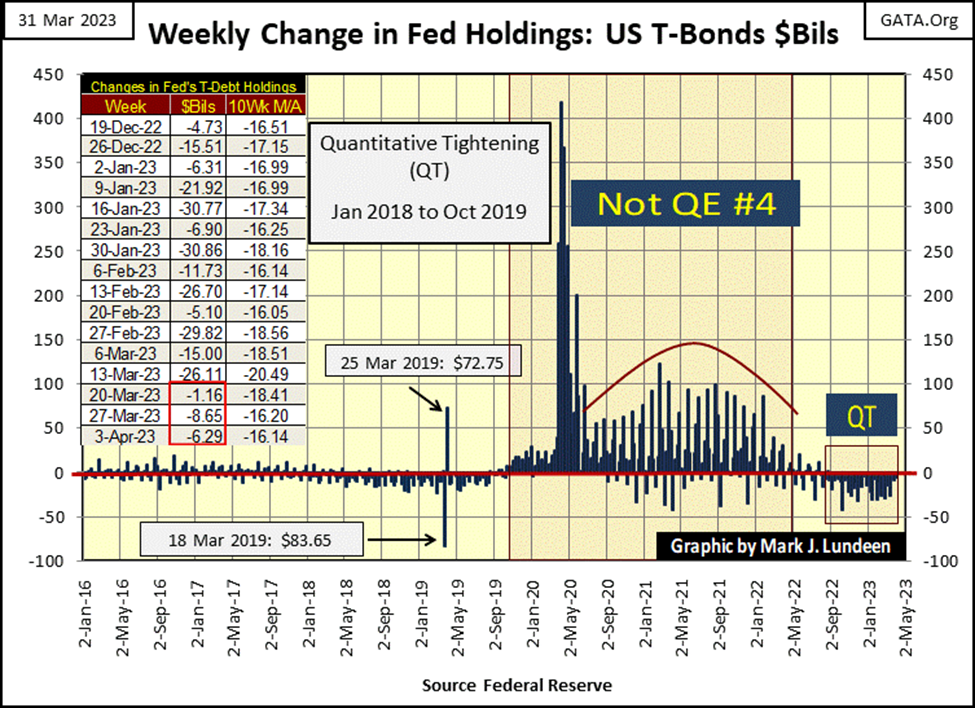
That may depend on what the idiot savants at the FOMC are doing with their QT in the chart below. In the past three weeks (Red square in the table below), they’ve drained significantly less “liquidity” from the financial system than they have since last May when they began. Are they wrapping up this QT? If so, what then?
This is something to watch, but something I’m not ready to come to any conclusions on just yet.
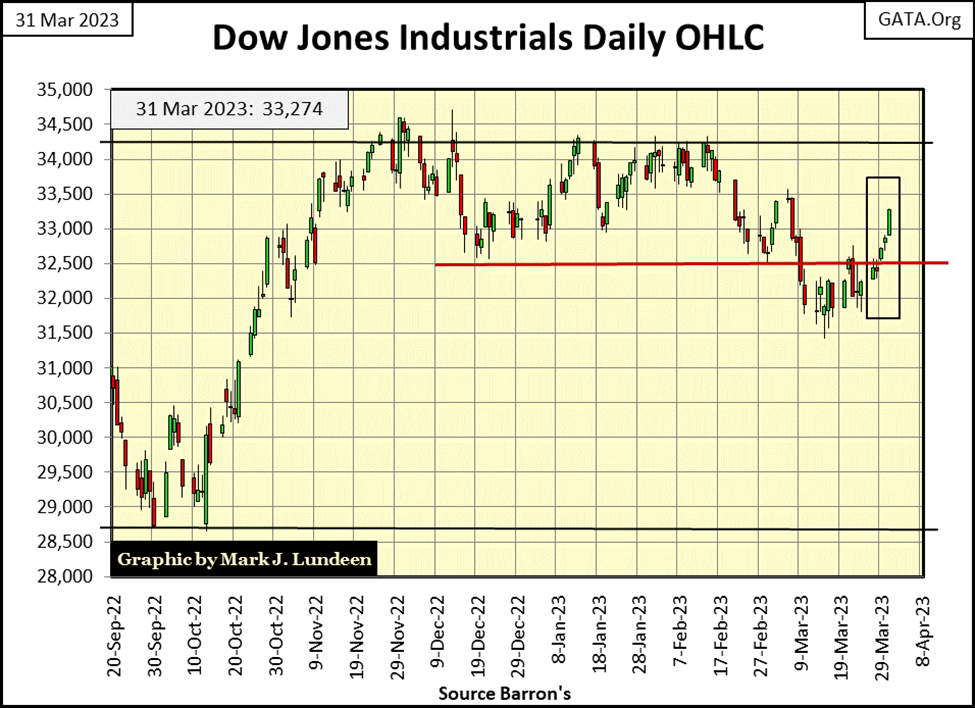
So, on the week Trump got indicted, the Dow Jones was up? I think I’ll remain short-term bearish on the Dow Jones above, and expect it’s the -15% BEV line that is next to be taken out. Of course, should the Dow Jones next cross its BEV -5% line, I’d change my opinion on that. After all, the most bullish thing the market can do is go up, and for the past two weeks, that is what the Dow Jones has been doing.
For the other major market indexes I track below, all are up by 2% or more from Monday to Friday’s trading. The exception to that was the NASDAQ Banking Index, which (in BEV terms) was down for the week by -0.39%. The NASDAQ Banking index remains in position to take out the XAU as #20 in the table below, and that reveals the lie that the stock market overall did well this week.
As long as this situation continues; weak banks / strong everything else, I’m not going to get too bullish on the Dow Jones, or anything else trading at the NYSE or NASDAQ exchanges.
For decades, the banking system was used as a toxic waste site by the financial system. Derivatives, non-performing mortgages, and much more was swallowed and then monetized by the system, rather than writing off the bad debt. The reserves for the Federal Reserve itself, and its banking system must be a total mess.
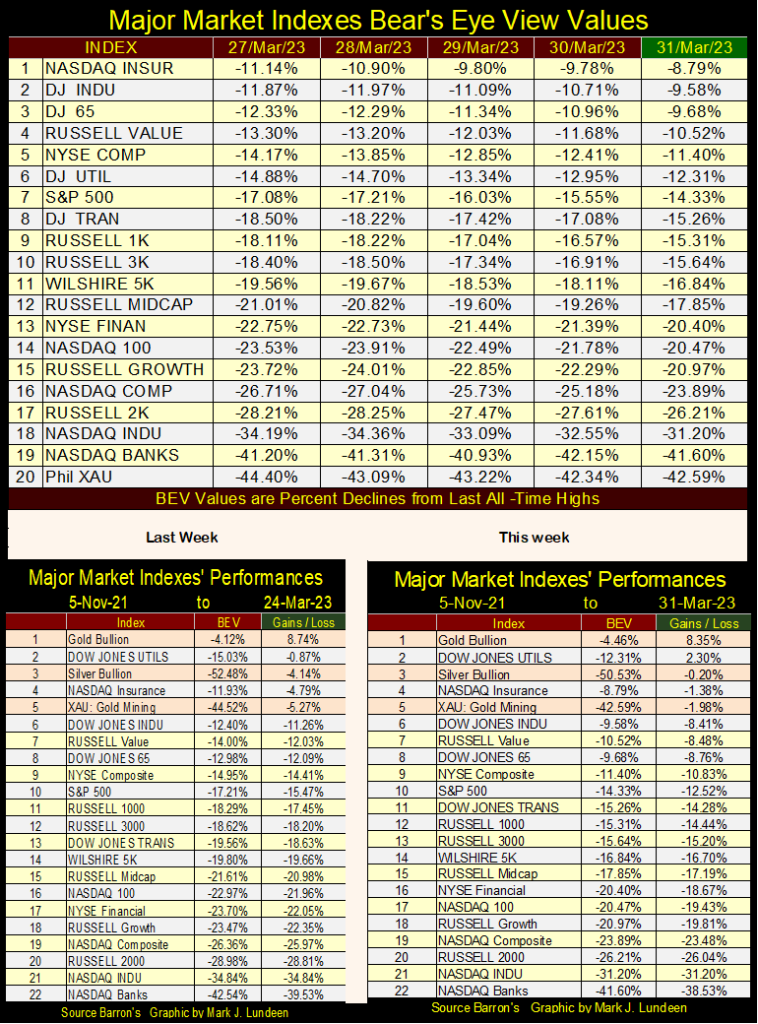
Gold, silver, and the XAU remain in the top 5 in the performance table above. That’s good! As was the Dow Jones this week, as seen in its daily bar chart below. But I still don’t like the stock market.
Here is a distressing idea, one that has driven some into madness, and extremes in cruelty as a fruitless reaction to it. Ready for it? Here it is;

It’s the most brilliant among us that feel the cruel sting from this fact the most grievously. That in the entire cosmos, nothing of them, or any of the great and wonderful things they have accomplished will remain in memory. Ultimately, the universe is an infinite record of everything, but one with no mention of the great and powerful ever being here, or having mattered to anyone or anything. In Einstein’s space-time continuum, there is no one who cares.
Or so proponents of Darwinism and biological evolution believe, and teach to any and all 18 to 22-year-olds who foolishly took a $100,000 school loan for a four year college degree in the 21st century.
Now I’m fine with science. Quantum Mechanics and Relativity are fascinating subjects to study, even to mathematical dullards such as myself. But advanced physics, absent a law giving God to laydown moral absolutes of good and bad, is a toxic gruel to base a society’s belief system on. Suicides are up for younger people.

https://www.uclahealth.org/news/suicide-rate-highest-among-teens-and-young-adults
One doesn’t have to look far to know what is up with that;
Humanity’s addiction to hydrocarbons is killing Mother Earth, so nature is better off without us, and the sooner we go, the better.
If there is one idea whose time to die has come, it’s that one! Sorry to say it, but will be around for a long time to come.
This fact about everything being forgotten makes for a very long list of things to forget about. It’s hard keeping it all in mind. If it wasn’t that I’m also on the list, I would just as soon forget the whole thing.
Remarkably, some people aren’t on this list of everything to forget about. Alexander the Great has so far has managed to avoid it. History, as recorded by Plutarch, states that King Phillip II of Macedonia, was cuckolded by no less a figure than the god Zeus, who impregnated his wife Olympia, who then gave birth to Alexander.
Alexander was not only a son of royal birth (one everyone knew the king of Macedonia, * Philip *, had nothing to do with), but Alexander was destined to become greater than anything Philip (who was * NOT * Alexander’s father) could ever hope to be. Alexander was a demigod, half man / half god, whose being, and actions and opinions on this, and that, and everything else were on par with the gods. In other words; Alexander was glorious!
Really? Well, this is what Alexander continuously told anyone who would listen, and even those who didn’t care to hear it anymore, including his parents. Plutarch records that Olympia wished Alexander would stop telling everyone that story about Zeus being his father, but she wasn’t going to call her son a liar either! To become like a god, Alexander the Great would conquer the world. Like a god, Alexander’s name is still remembered by most people to this day.
The same is true for Julius Caesar, who when visiting Alexander the Great’s tomb cried, as Alexander had conquered the world before he was twenty-eight years old. Caesar was over forty, and had yet to conquer Rome. He cried, because who would remember that Caesar had come, and gone?
These people were malignant narcissists, a group we have no shortage of today. Do you want a list of those now living? I’d start with the regular attendees at the World Economic Forum (WEF) annual Davos gatherings.
All that said, I do admit how annoying it is to have everything forgotten with the passage of time, specifically the market wisdom of Richard Russell, who had little faith in earnings for the stock market, but great trust in the power of dividends. Earnings can be cash, or cash equivalent, and then earnings can be something else too. Former holders of Enron and WorldCom, know all about that. But with time, those scams too shall be forgotten.
But dividend payouts are totally different, as they ultimately are sent out to shareholders in a check, that must be cleared by a bank when cashed, or irregularities in the company’s accounting will soon be recognized. So, to prevent decades of Dow Jones history to be forgotten, as they will if no one ever recalls it, let’s take a look at earnings and dividend payouts for the Dow Jones going back many decades.
Since 1929, earnings for the Dow Jones have often been volatile, and twice have gone negative;
- in 1932 during the Great Depression Crash,
- and again in 2008 during the sub-prime mortgage crash.
Following the 1932 crash in earnings, it took twenty-years before earnings for the Dow Jones recovered to their 1929 highs. This was * NOT SO * for the earning crash of 2008, where Dow Jones earnings recovered in less than four years.
You may ask; why the difference and I would answer; I don’t know. But in the panic years of 2007 through 2009, many once rigid standards in banking and accounting were relaxed to aid the reflation of valuations in the financial system, and ward off wholesale bankruptcy in corporate America. Do you remember that?
I believe most of these changes in standards have remained in place to this time. Not that anyone important today remembers, or cares if they had or hadn’t. What’s important is that everyone sees the Dow Jones has earnings, and they have grown wonderfully since the mortgage crisis. To point out that earnings after 2007 may somehow be different due to changes in accounting standards, is something not done in polite society.
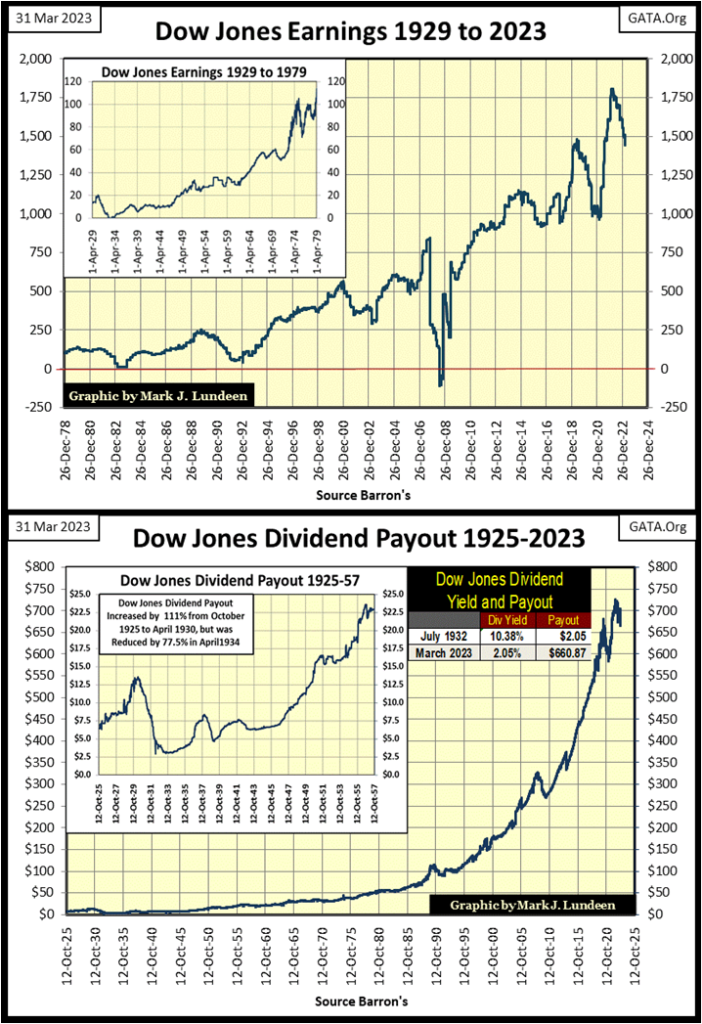
Above are the dividend payouts for the Dow Jones since 1925. This is solid data, as this is a record of the cash sent out to shareholders via checks. And I thank
Richard Russell for pointing out, and emphasizing the fact that dividends don’t lie in his letter.
In the ninety-eight years of dividend payouts seen above, we see the reason why the stock market was a much superior source of income for investors than was the bond market. Bonds are contracts for debt, thus they are fixed income, as specified in the bond’s contract.
For a twenty-year bond, the payout for all its coupons are identical, and never changing. During times of high inflation, the owners of bonds always receive the agreed coupon payments, or the issuer of the bond is in default. But over time, what those dollars will purchase can change tremendously.
Dividend payouts are a corporation’s profit-sharing program with its owners; the shareholders. A corporation is not required to pay a dividend and can reduce or eliminate it totally, at its discretion, with no legal recourse for its owners. But corporations typically like paying a dividend, as they provide a reason for the public to invest in the company.
As seen above, unlike bonds, dividend payouts for mature blue-chip large-cap corporation increased greatly during the 20th century, as did their earnings and share prices. In the table below, I listed the earnings, dividend payouts, and valuations for the Dow Jones, along with the sources of inflation for the American economy;
- the national debt (deficit spending by the Federal Government),
- increases in paper dollar circulation (CinC), by the Federal Reserve.
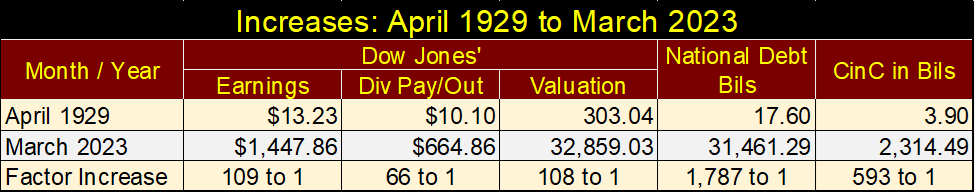
The sources of inflation overwhelm the increases in earnings and dividend payouts. Still, as a source of income, and a reservoir for storing one’s wealth, the stock market during the past 100 years was vastly superior to the bond market.
Barron’s once-published bond averages. One such average was the Dow Jones 10Utility Bond Average, which was published from 1938 to 2002, when it was discontinued, and is now mostly forgotten by all. In the chart below, I’ve plotted this bond average’s weekly data as published in Barron’s. Bond yields are in the Red Plot, and bond prices are in the Blue Plot. The Green plot was not published in Barron’s, but the bond prices after I deflated them using CinC. Investing in fixed income, in an inflationary monetary system is not a wise decision.
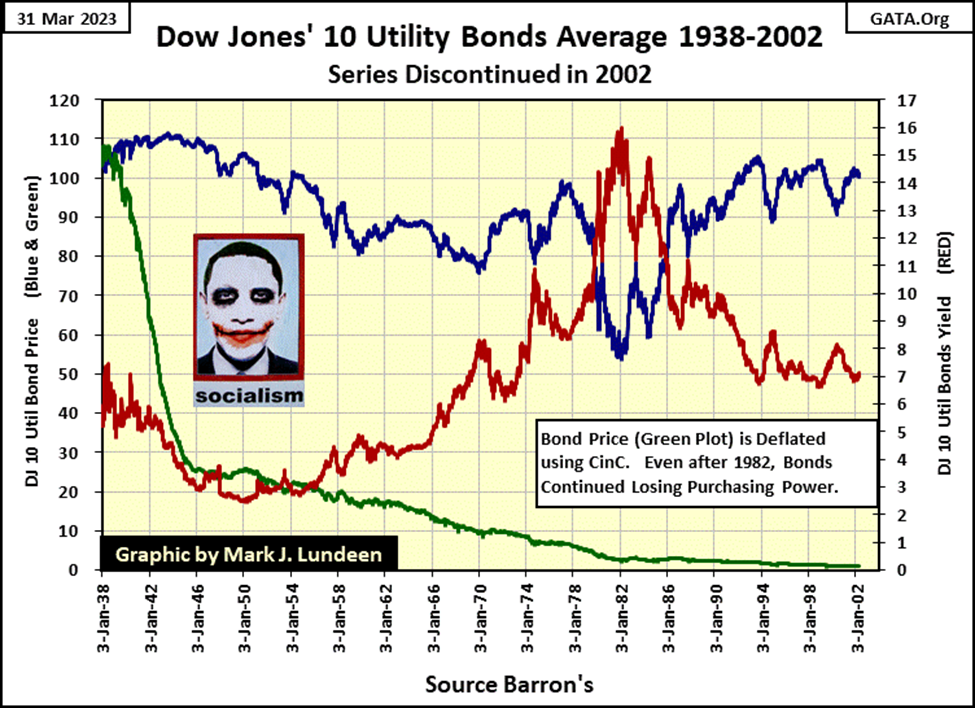
Note; after sixty-four years of inflation in in the American money supply, the final price of the DJ 10Util Bd Ave published by Barron’s ($101.08) was $2.22 less than its first published price ($103.30). But that is the nature of fixed-income investments; to see one’s investment returned after years of interest payments for loaning it out. It could have been much worse, had Barron’s discontinued this bond series in 1982, when its valuation deflated to only 53.82 in February of that year.
In the table below, I made a side-by-side comparison of what happened to a million dollars invested in the Dow Jones Industrial Average (blue-chip stocks), or the Dow Jones 10 Utility Bond Average from January 1938, when the 10Util Bd Ave was first published in Barron’s, to April 2002 when it was discontinued.
The comparison is strictly a comparison of these two market averages’ prices, as computing the effects of dividend and bond coupon income are beyond me, and I believe anyone else. Because of the complex income tax system of the United States, total performance for anyone invested in either of them, is unique to them, and cannot be directly compared to the millions of others that may also be investing in these averages. So, I’m not even going to attempt to do so, choosing to look at price performance alone.
A million dollars in 1938 was an immense fortune. In the depression era, $20,000 could purchase a penthouse with a prime view of New York’s Central Park, leaving $980,000 left to invest in stocks or bonds trading at the NYSE.
The first published yield for the DJ 10Util Bd Average was 5.22%. With $980,000 invested in utility bonds in 1938, that 5.22% yield provided an annual income of $51,156. But note that bonds are FIXED INCOME. The issuers of these bonds could not lower their bonds’ payout, but you can be sure that they would not increase them either.
Even after taxes, a million dollars invested in bonds allowed a millionaire in 1938 to eat what they wanted, where they wanted in New York, London or Paris, while dressed in tailored attire.
Much was the same for a millionaire who invested their million dollars in the Dow Jones, or dividend-paying blue-chip stocks. In January 1938, the Dow Jones was yielding 6.90%. After this millionaire also purchased their $20,000 penthouse with a prime view of Central Park, the Dow Jones’ yield of 6.90% provided an annual income of $67,620. But dividend income is not fixed income. In the decades to come, dividend income from Dow Jones increased greatly from this initial million-dollar investment, as would the initial investment with the expanding valuation of the Dow Jones.
In the table below, there are three sub-tables. The uppermost uses data taken from Barron’s issues where the Dow Jones 10 Util Bond Average was first, and last published sixty-four years later. We see the growth in monetary inflation as CinC increases by two orders of magnitude. So did the Dow Jones. Still, the Dow Jones advanced less than the growth in CinC. The Dow Jones 10Util Bond Average actually loss 1.45% during these sixty-four years, but we’ll say the bonds broke even, as expected with a fixed-income investment.
The middle sub-table looks at the return of a million dollars in nominal dollar terms, or the growth as seen in the pages of Barron’s. In other words, we’re going to assume a dollar in 1938 is the same dollar as seen in 2002. That is not true. In 1938, $20,000 could purchase a penthouse overlooking New York’s central park. $20,000 in 2002 could only get something on New York’s street level in a bad part of town, if that.
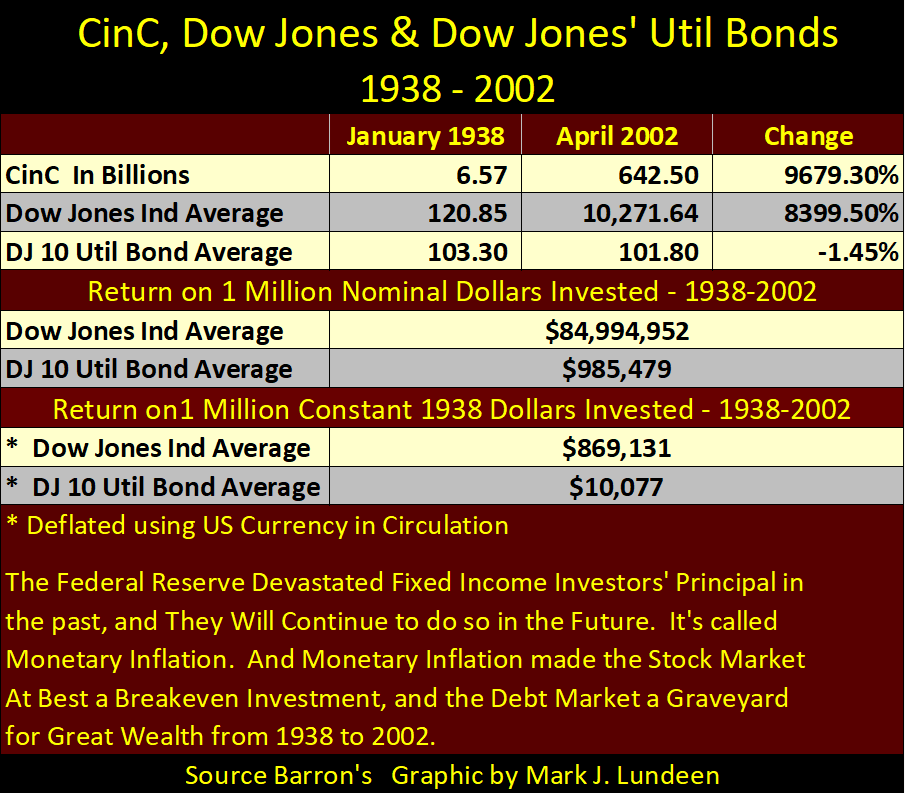
The bottom sub-table looks at these million-dollar investments in terms of 1938 dollars, or in constant 1938 dollars. These constant 1938 dollars are computed by using the factor that CinC was increased by, from 1938 to 2002; a factor of 97.79. I have these values listed above.
As a picture is worth a thousand words, how I deflated sixty-four years of inflated valuation from the Dow Jones and the Dow Jones 10 Util Bond Averages, is seen in the table below.
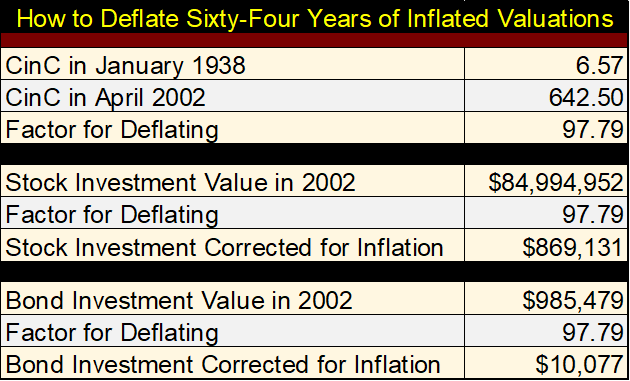
So, in 1938 dollar terms, the investment in the Dow Jones still lost money, but not enough to crimp the lifestyle of a 1938 millionaire who somehow survived to 2002. This is not so for the investment in bonds, which in 1938 dollar terms, saw their million dollars from 1938 reduced to only $10,077 in 2002.
I believe history will show that all fixed-income investment only benefits the creditor, if the currency the loan is based on, is backed by gold or silver. Absent a gold standard, central bankers and politicians begin circling the bond market like vultures, looking for easy prey; creditors in fixed income.
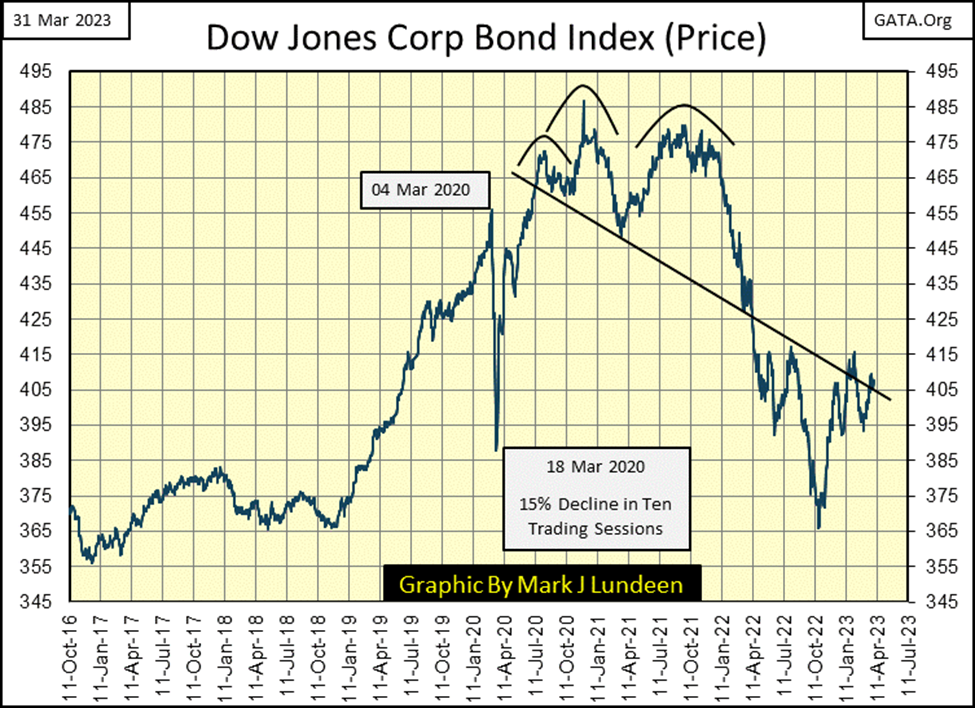
Let’s hold on to that thought as we look at the price for the Dow Jones Corporate Bond Index below. I suppose I should say something on this chart, but all I can think of is how sad it is to own bonds in 2023.
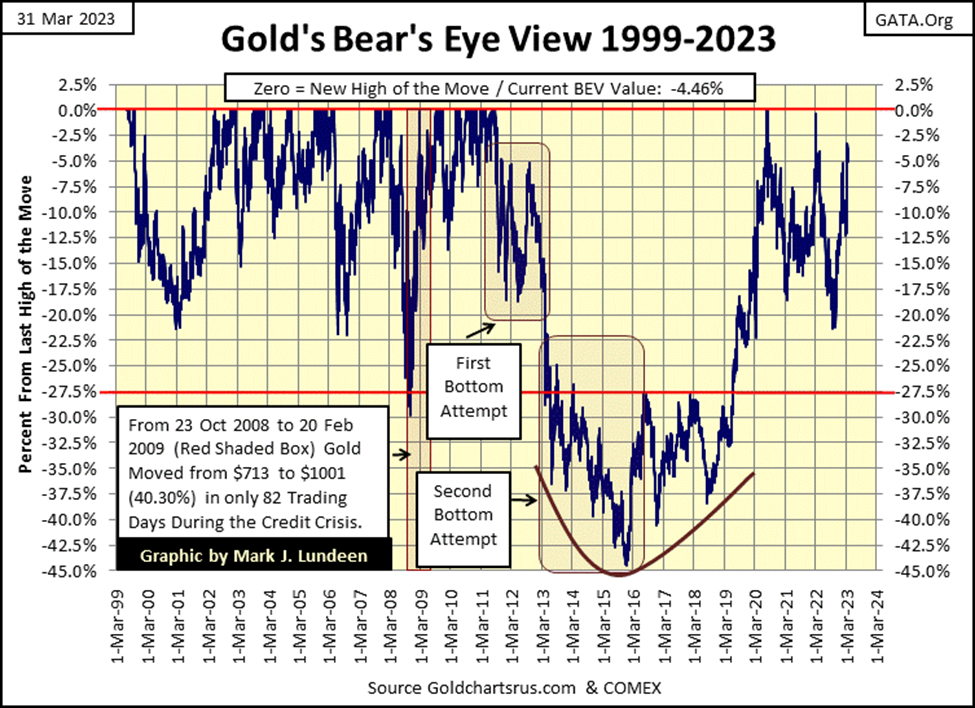
Mark, you don’t like the stock market, and you don’t like the bond market. So, what do you like? I like gold and silver – a lot. So, let’s move on to gold’s BEV chart below.
This chart covers the entire gold bull market that began in early 2001, with gold bottoming at $253 an ounce. That is why BEV Zeros from February 2001, to November 2007, are only “highs for the move”, as gold didn’t see a new all-time high until November 2007.
Anyway, since February 2001, what a weird bull market gold has had its bulls ride for the past twenty-two years. In the first ten years of this bull market, gold was making plenty of new BEV Zeros, and new all-time highs after November 2007.
And then after August 2011, all that got shut down with the start of a nine-year Bull Market Correction from Hell. By December 2015, I believe investors would have preferred owning lumps of plutonium than ounces of gold. But, that is what good bottoms look like, and as you can see below, gold began to once again rise.
What is really odd about the last eleven years of this bull market, is gold has made only nine new all-time highs (9 BEV Zeros) in the chart below. What, just nine BEV Zeros in the past eleven years, and all of them in July and August 2020? That is really odd. It came close to making one in March 2022, but just couldn’t pull it off. Maybe this time gold will get it done, and take out its highs of August 2020.
Whether or not gold does or doesn’t, one thing is a certainty; gold’s BEV chart below is one of the oddest, and unnatural charts I’ve ever seen. This chart plots a crime scene, including the finger prints of unknown idiots who have suppressed the gold market for decades. What gold is going to do when it finally breaks free of its tormentors’ grasping hands at the COMEX should be breathtaking.
Moving to gold’s step sum table below, it saw a very overbought +9 on March 9th for its 15-count, and has been working that off for the past two weeks. I like that the price of gold remained above $1900 as the gold market began seeing more daily declines.
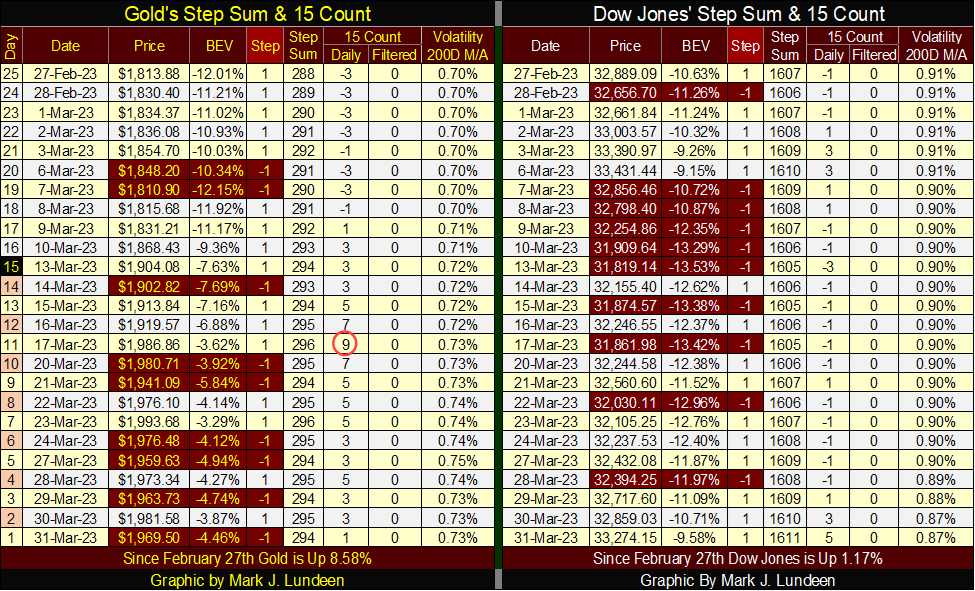
Not much to say about the Dow Jones’ step sum table, except the Dow is once again seeing more daily advances than declines, and its valuation is rising as a result. Its daily volatility continues to decline, which is good.
Nothing really bad to say about the Dow Jones, but I see tripwires all over the landscape; the banks have big problems is one, NATO keeps poking the Russian bear is another. Many people are dying in Ukraine for no particularly good reason, and now we hear talk about nuclear war once again.
Maybe one of these days, something may happen that will be perceived as bad news for the stock market. So far, rising concerns of New York being taken out in a thermo-nuclear flash have only inspired the bulls to buy more. What a crazy world we live in.
__
(Featured image by pasja1000 via Pixabay)
DISCLAIMER: This article was written by a third party contributor and does not reflect the opinion of Born2Invest, its management, staff or its associates. Please review our disclaimer for more information.
This article may include forward-looking statements. These forward-looking statements generally are identified by the words “believe,” “project,” “estimate,” “become,” “plan,” “will,” and similar expressions. These forward-looking statements involve known and unknown risks as well as uncertainties, including those discussed in the following cautionary statements and elsewhere in this article and on this site. Although the Company may believe that its expectations are based on reasonable assumptions, the actual results that the Company may achieve may differ materially from any forward-looking statements, which reflect the opinions of the management of the Company only as of the date hereof. Additionally, please make sure to read these important disclosures.


Blockchain Evolves Toward AI, Finance and Quantum Security
Blockchain is evolving beyond crypto into finance, AI applications, and digital markets, while security and regulation remain challenges. Quantum threats...


The Italian Crowdinvesting Market Faces Sharp Decline in 2026
Italian crowdinvesting market continued to decline in 2026, with fundraising falling 36.8% year-on-year to €164.19 million. Platforms and active campaigns...


Sartorius Stedim Biotech Maintains Growth Momentum in H1 2026
Sartorius Stedim Biotech reported solid H1 2026 results, with revenue reaching €1.527 billion and EBITDA rising to €479 million. Growth...


Bank of Africa Launches BOA MDM Network to Boost Diaspora Investment in Morocco
Bank of Africa launched the BOA MDM Network to channel diaspora remittances into productive investment, aiming to raise their share...


Switzerland’s Medical Cannabis Reform Advances Access, But Barriers Remain
Switzerland’s 2022 medical cannabis reform improved patient access by removing federal approval requirements, but challenges remain. MEDCAN highlights barriers including...
 |
|
 |  |
 |
|
-

 Cannabis2 weeks ago
Germany Tightens Cannabis Reimbursement Rules: Approved Medicines Must Come First
-
 Africa12 hours ago
Bank of Africa Launches BOA MDM Network to Boost Diaspora Investment in Morocco
-

 Crypto1 week ago
Bitcoin’s Price Drops as Investors Turn to Layer 2 Solutions
-

 Markets3 days ago
Sugar Markets Balance Biofuel Demand and Global Supply