Markets
Fed Cuts Rates as Gold Surges and Political Risks Mount
The Fed and Bank of Canada cut rates 25 bps, citing inflation concerns. U.S. indexes hit record highs, but momentum is fading amid political risks. Gold surged on geopolitical tensions, with silver nearing historic highs. Bond yields rose despite cuts, boosting insurers. Key focus this week: Q2 GDP final, with combined Q1–Q2 growth just 1.4%.

As was widely expected, the Fed cut the key rate 25 bp to 4.00–4.25%. It was the first cut in 2025. We gleaned the following from the rate cut:
- The decision to cut rates by 25 bp was broadly agreed upon with one dissenter, Stephen Miran, the recent Trump appointee.
- The FOMC cited that “recent indicators suggest that the growth of economic activity moderated in the first half of the year. Job gains have slowed, and the unemployment rate has edged up but remains low. Inflation has moved up and remains somewhat elevated.” Stagflation?
- It was clear from Powell’s statement that “there wasn’t widespread support at all” for a larger half-point cut.
- It was hinted that there could be two more cuts this year at the October 28–29 meeting and the December 9–10 meeting. Using the 25 bp cut, that would lower the Fed rate to 3.50–3.75% by year end.
- Reactions pleased the stock market, which rose. The US$ Index also rose but gold and gold stocks sold off as did bonds with longer-term bond yields rising.
- Current leaders of the central bank view the U.S. economy as in basically sound shape right now, experiencing some labour market softness. But that is nothing a few modest interest rate cuts can’t solve.
We note that:
- Inflation remains elevated with the last year over year (y-o-y) at 2.9%, up from 2.7% the previous month. The core inflation rate was 3.1%, unchanged from the previous month.
- The number of unemployed (U3) is 7,384 thousand with an unemployment rate of 4.3%, up from 4.2% the previous month.
- The U6 unemployment rate is 8.1% up from 7.9% the previous month. The number of those unemployed including U3 unemployed is 14,620 thousand. The labour force participation rate rose to 62.3% from 62.2%.
- The Shadow Stats unemployment rate is 28.0%, up from 27.8% the previous month. The Bureau of Labour Statistics (BLS) notes 6,345 thousand unemployed who are not in the labour force but are still looking for work. Shadow Stats unemployment numbers imply that there are 45,742 thousand unemployed in a labour force of 163,367 thousand. The BLS lists 1,791 thousand unemployed who are not in the labour force but who want a job now.
- According to the BLS, job openings are 7,780 thousand while JOLTS lists job openings at 8,180 thousand. There are more unemployed than there are job openings. Job skills and requirements do not necessarily match the skills of the unemployed.
Fed Rate, Inflation Rate, 10-year Note Rate 2015–2025

Some conclusions:
- Rising unemployment continues at a slow, steady pace. In the last periods of rising unemployment, unemployment rose quickly. The question is, when will the rise steepen?
- The Fed continues to be concerned about inflation. It has been noted that the percentage of items rising 3% or more continues to rise.
- We can’t help but note that building permits are falling, suggesting a much slower housing market ahead. That in turn has a direct impact on employment.
- We note Trump ranted that the Fed “should listen to smart people like me.” He has argued that the Fed should slash rates by 3%. Trump’s efforts to have Fed governor Lisa Cooke removed continue his attempt to take over the Fed, a move that has been condemned everywhere.
- This 25 bp cut and Powell’s framing suggests the Fed is pivoting, but carefully. They’re acknowledging economic softening and using this cut as a “risk management” tool. But they are also trying not to over-promise: inflation remains a concern, and they aren’t signaling a fast, large, easing path.
- Workforce softness often leads to lower rates as the Fed mistakenly believes that cheaper borrowing costs will ignite business investment, consumer spending, and strengthen businesses to the point that they need additional employees. Borrowing costs are not the reason why companies are not hiring. CONFIDENCE is the problem, as businesses do not foresee expansion in the near-term, as consumers are grappling with massive debt and an increased cost of living. – Martin Armstrong, Armstrong Economics www.armstrongeconomics.com September 18, 2025
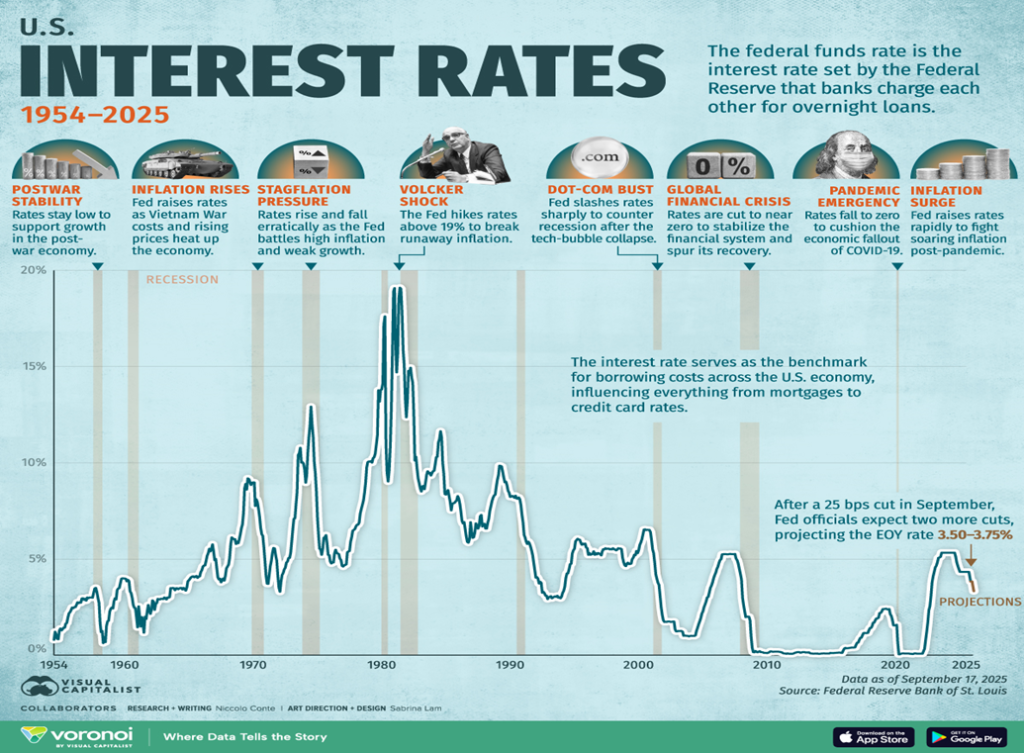
A great chart showing U.S. interest rates (Fed rate) over time 1954-2025.
Key Takeaways
- The U.S. interest rate has fluctuated considerably over the decades, reaching above 19% during the early 1980s and later falling to near zero in the 2008 financial crisis and COVID-19 pandemic.
- The Federal Reserve made their first interest rate cut of this year of 25 basis points on September 17th, and projects rates to decline to 3.50–3.75% by the end of 2025.
- We have the apparent paradox of solid topline economic growth and booming financial markets, paired with a weak job market
Canada
Also, as was widely expected, the Bank of Canada cut its key bank rate by 25 bp to 2.50%. The cut came after three consecutive pauses:
- Bank of Canada Governor Tiff Macklem cited that were was a clear consensus to cut the interest rate. The sense was that the “balance of risk” had shifted, citing a softening labour market and continuing inflation as factors. The cut was a unanimous decision.
- There were no real hints of further cuts.
- The TSX Composite rose while the Canadian dollar weakened slightly. Bond yields rose slightly.
- The inflation rate rose to 1.9% from 1.7%. The core inflation rate was steady at 2.6%.
- The unemployment rate rose to 7.1% from 6.9%. The R8 unemployment rate, the highest reported by Statistics Canada, rose to 10.2% from 9.9%.
- The number unemployed rose to 1,560.2 thousand from 1,552.5 thousand. The number of employed persons fell to 21,020.4 thousand from 21,061.2 thousand.
- The number of job vacancies in the second quarter fell to 505.9 thousand from 524.8 thousand. Job openings remain well below the number unemployed.
- Canada’s labour force was last reported at 22,876.6 thousand.
- The labour force participation rate fell to 65.1% from 65.2%.
- Canada’s economy is expected to grow 1% in 2025 vs. 1.3% in the U.S. Canada’s budget deficit as a percentage of GDP is 2.2% vs. 6.3% in the U.S.
Canada BofC Rate, Inflation Rate, 10-year Bond (CGB) Rate 2015–2025
Markets & Trends
| % Gains (Losses) Trends | ||||||||
| Close Dec 31/24 | Close Sep 19/25 | Week | YTD | Daily (Short Term) | Weekly (Intermediate) | Monthly (Long Term) | ||
| S&P 500 | 5,881.63 | 6,664.36 (new highs) * | 1.2% | 13.3% | up | up | up | |
| Dow Jones Industrials | 42,544.22 | 46,315.27 (new highs) * | 1.1% | 8.9% | up | up | up | |
| Dow Jones Transport | 16,030.66 | 15,610.61 | (0.1)% | (1.8)% | down (weak) | neutral | up | |
| NASDAQ | 19,310.79 | 22,631.48 (new highs) * | 2.2% | 17.2% | up | up | up | |
| S&P/TSX Composite | 24,796.40 | 29,738.36 (new highs) * | 1.7% | 20.4% | up | up | up | |
| S&P/TSX Venture (CDNX) | 597.87 | 904.80 (new highs) | 2.9% | 51.3% | up | up | up | |
| S&P 600 (small) | 1,408.17 | 1,456.07 | 1.0% | 3.4% | up | up | up | |
| MSCI World | 2,304.50 | 2,815.01 (new highs) * | 0.3% | 22.2% | up | up | up | |
| Bitcoin | 93,467.13 | 115,461.16 | (0.7)% | 23.5% | up (weak) | up | up | |
| Gold Mining Stock Indices | ||||||||
| Gold Bugs Index (HUI) | 275.58 | 577.67 (new highs) | 3.3% | 109.6% | up | up | up | |
| TSX Gold Index (TGD) | 336.87 | 695.65 (new highs) * | 3.9% | 106.5% | up | up | up | |
| % | ||||||||
| U.S. 10-Year Treasury Bond yield | 4.58% | 4.13% | 1.5% | (9.8)% | ||||
| Cdn. 10-Year Bond CGB yield | 3.25% | 3.20% | 0.3% | (1.5)% | ||||
| Recession Watch Spreads | ||||||||
| U.S. 2-year 10-year Treasury spread | 0.33% | 0.55% | 10.0% | 66.7% | ||||
| Cdn 2-year 10-year CGB spread | 0.30% | 0.73% | 7.4% | 143.3% | ||||
| Currencies | ||||||||
| US$ Index | 108.44 | 97.68 | flat | (9.9)% | down | down | down | |
| Canadian $ | 69.49 | 0.7252 | 0.4% | 4.4% | up | up | neutral | |
| Euro | 103.54 | 117.43 | 0.1% | 13.4% | up | up | up | |
| Swiss Franc | 110.16 | 125.68 | 0.1% | 14.1% | up | up | up | |
| British Pound | 125.11 | 134.71 | (0.7)% | 7.7% | neutral | up | up | |
| Japanese Yen | 63.57 | 67.57 | (0.2)% | 6.3% | down (weak) | neutral | down (weak) | |
| Precious Metals | ||||||||
| Gold | 2,641.00 | 3,684.31 (new highs) * | 1.2% | 39.5% | up | up | up | |
| Silver | 29.24 | 43.02 (new highs) | 2.1% | 47.1% | up | up | up | |
| Platinum | 910.50 | 1,417.10 | 1.4% | 55.6% | up | up | up | |
| Base Metals | ||||||||
| Palladium | 909.80 | 1,154.00 | (4.8)% | 26.8% | neutral | up | neutral | |
| Copper | 4.03 | 4.57 | (0.2)% | 13.4% | neutral | neutral | up | |
| Energy | ||||||||
| WTI Oil | 71.72 | 62.72 | 0.1% | (12.6)% | down | down | down | |
| Nat Gas | 3.63 | 2.91 | (1.0)% | (19.8)% | down (weak) | down | down (weak) | |
Source: www.stockcharts.com
S&P 500
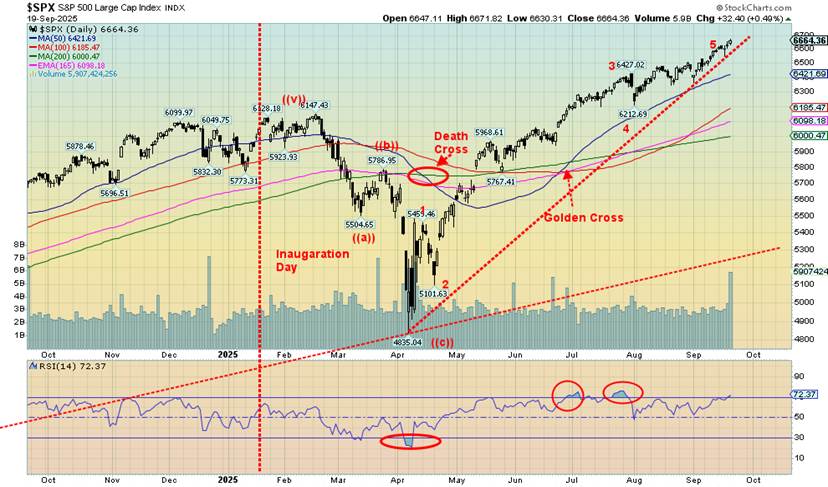
Runaway Train was a 1985 film about a couple of convicts and a woman who find themselves on a train with no brakes and no one driving. Years later in 2010 they made another one called Unstoppable,again about a runaway, unmanned train that a veteran engineer and a young conductor find themselves on. Both were exhilarating in their attempts to avoid the inevitable crash. Sometimes we feel that the stock market is today’s version of the runaway train. How does it stop? We know that inevitably it will end badly, but you can’t do much about it. Greed, it seems, is good.
We are seeing negative divergences galore across all time frames for the S&P 500 (SPX). We know that P/E (price-to-earnings) values are in the stratosphere. The VIX Volatility Index is signaling complacency as is the put/call ratio. Numerous other momentum indicators are in warning zones with many negatively diverging. Even fundamental indicators such as price to book and price to sales are signalling danger. But we just keep on rising.
Yes, momentum is slowing but that hasn’t cracked the market. A black swan event could crack it. Too bad we don’t know what that black swan might be. Outbreak of violence in the U.S. as Trump’s attempts to set up an autocratic state continue? Outbreak of war in Europe between NATO and Russia? Outbreak of a broader war in the Middle East with Israel? A sovereign debt default? Or something else altogether?
Given the current conditions, buying up here is dangerous. Insiders are selling; i.e., the smart money is getting out. We can pinpoint danger zones that many may use as stops. The first point for the SPX is 6,550, but far more important is a breakdown under 6,350 and especially under 6,200. Major support is 6,000 and the 200-day MA. A correction is overdue. September is the worst month of the year, but it’s not showing it. October is crash month. Instead, it’s an upward crash. We have a runaway.
Everybody was making new all-time highs – again. The SPX was up 1.2%, the Dow Jones Industrials (DJI) up 1.1%, the Dow Jones Transportations (DJT) was the loser down 0.1%, while the NASDAQ gained 2.2%. The S&P Equal Weight Index was up 0.1% while the NY FANG Index gained 3.0%. Bitcoin fell 0.7%.
Helping the NY FANG index rise 3.0% to new all-time highs was Google up 5.8%, Tesla up 7.6%, Apple up 4.9%, and, CrowdStrike, a big winner, up 15.2%. Significantly the Chinese tech stocks had a good week with Baidu up 17.9% and Alibaba up 5.0%. Both made all-time highs. Significantly Nvidia fell 0.6%.
In Canada, the TSX hit all time highs again, up 1.7%, while the TSX Venture Exchange (CDNX) continues to hit new highs, up 2.9%. The CDNX is being driven by junior mining stocks that are just now beginning to show life. If this trend holds, the CDNX could be in for a much larger rise. Still the CDNX remains down 13% from its February 2021 high. In the EU, the London FTSE fell 0.7%, the EuroNext was up 1.0%, the Paris CAC 40 was up 0.4%, while the German DAX fell 0.3%. In Asia, China’s Shanghai Index (SSEC) was down 1.3%, the Tokyo Nikkei Dow (TKN) rose 0.6%, but significantly made all-time highs then reversed sharply but still managed the up close. Hong Kong’s Hang Seng (HSI) gained 0.6% also hitting all-time highs. The train keeps on going.
The market just keeps on going. We know it will inevitably end, but we just don’t know when. The market liked the rate cut this past week and was also excited about more cuts. But momentum is fading and a drop overdue.
This past week was triple witching where futures, options, and options on futures expire. It’s also nearing the end of the quarter where rebalancing takes place. Volatility is expected to rise. This week we get the final Q2 GDP numbers. Last was 3.3% and that is expected to hold. The GDP for Q1 and Q2 annualised was 1.4%.
The Scorecard
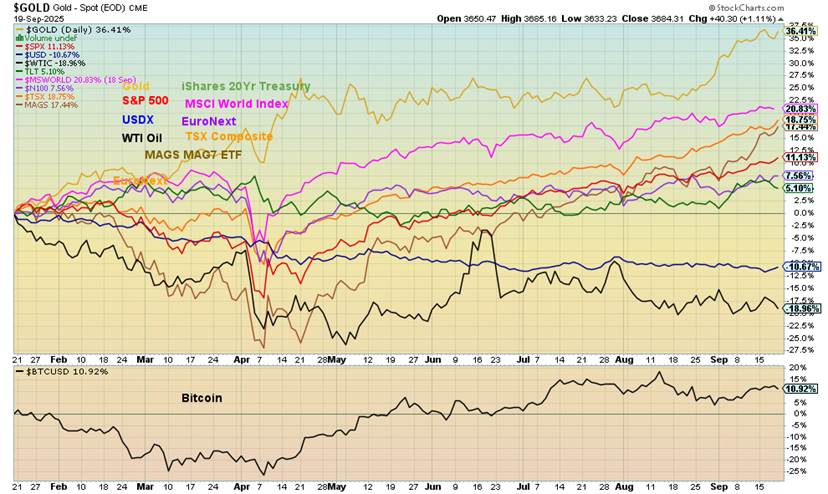
Despite the setback for gold this past week it easily maintains its lead, up 36.4%. WTI oil remains the big loser, off 19.0%, while the US$ Index is down 10.7%. Remember, all this is just from Jan 20.
U.S. Bonds
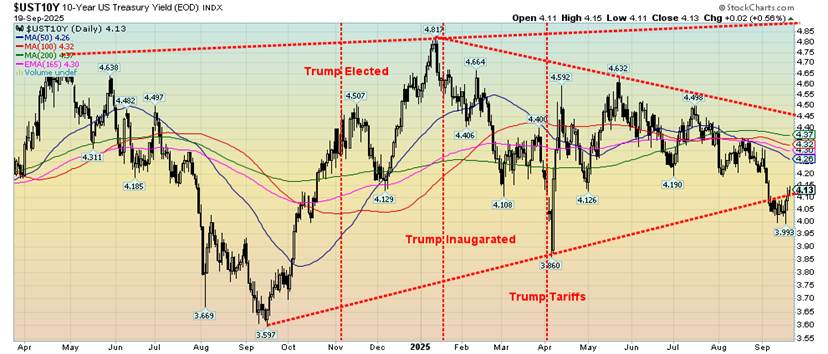
We have warned that the Fed can control the short end of the market but the long end is controlled by the bond market. And the long end may not cooperate with the Fed (or Trump). The market for U.S. treasuries is huge. Over $9 trillion is held by foreigners, none of whom answer to the Fed. The U.S. total debt is $37.4 trillion and rising.
The Fed cut rates but the bond market ignored it and the 10-year U.S. Treasury rose from a low 4.05 at the time of the Fed to as high as 4.13%. That’s definitely not the direction Trump wants to see. Mortgage rates actually rose marginally, not falling, following the Fed decision. That said, we have a way to go to break out to the upside. Above 4.35%, the 10-year would enter a danger zone and be projected higher. New lows below 3.99% would signal lower. But that breakdown is now starting to look like a false breakdown. The follow through was feeble, usually a good clue.
We note that the spending bill is in deep trouble. It needs 60 votes in the Senate for it to pass. Because of the failure to protect healthcare programs the latest iteration lost with the parties voting along party lines with the odd exception. But it needs 60 votes to pass and it didn’t get it. Another temporary one was passed to take them until November 21.
The U.S. spending bill is estimated at $7.39 trillion. Of that Medicare/Medicaid makes up $1.70 trillion, Social Security is $1.54 trillion, defense is $0.93 trillion and interest on the debt is $1.05 trillion. That totals $5.22 trillion accounting for 70.6% of all the spending. No wonder Trump wants the interest rates lower. Interest on the debt just keeps on rising. Noteworthy, they collect an estimated $5.48 trillion in taxes leaving a budget deficit of $1.90 trillion which works out to 6.3% of GDP the highest in the G7 and one of the highest in the world. No wonder long rates are going to go up.
Gold and Silver
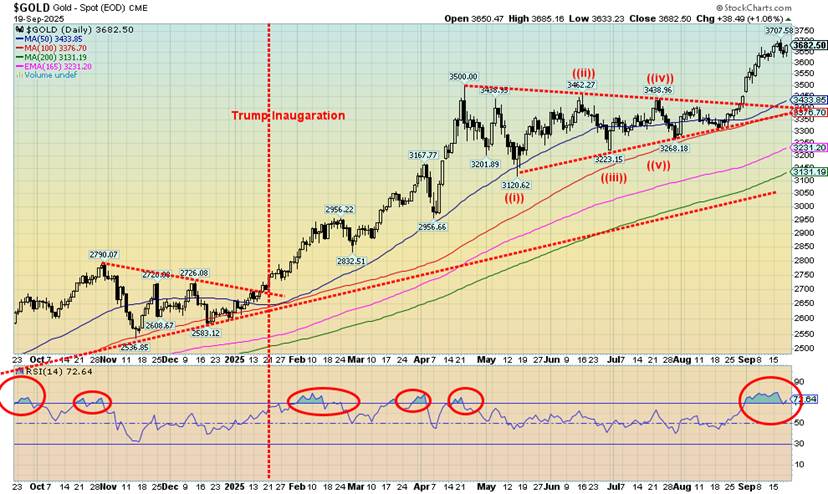
Gold’s response to the Fed rate cut was rather muted. The cut was widely expected. There may have been some disappointment they didn’t cut more. There were mixed messages about going forward but did indicate two more cuts this year. Inflation is still a concern. Nonetheless, that did not stop gold from making new all-time highs over $3,700 before pulling back. Silver made 52-week highs near $43, the highest level seen since 2011. It leaves silver shy of its all-time high by about 13%.
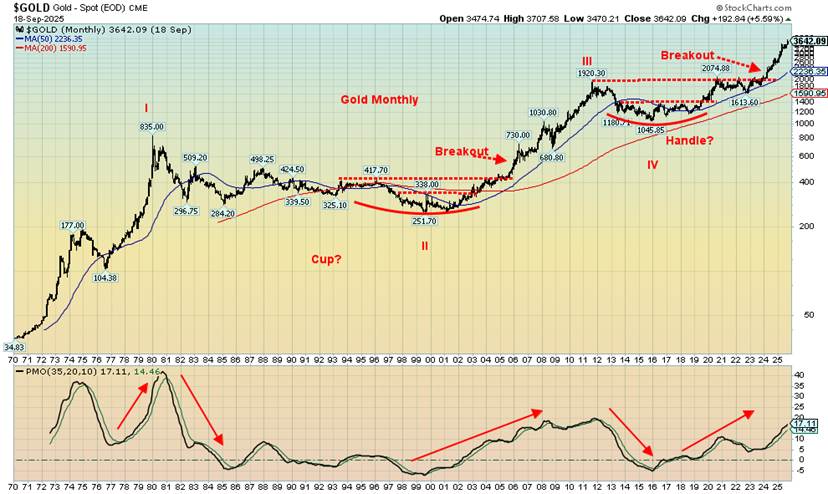
It has been a phenomenal year for the gold bugs who haven’t had returns like this since 2011. As one can see from the long-term monthly chart, we are in another leg up. It would be the third time since the 1970s. The first wave was from 1970 to 1980, although the real move came from 1976. The second wave up got underway in 1999–2000 and lasted until 2011. The third wave up got under way in 2016 and has not yet shown signs of a top.
The consolidation pattern (cup) that formed in the 1990s projected up to a minimum near $600. We went to $1,900. The more recent consolidation that formed from 2011–2023 (handle) projects up to at least $2,900. We’ve gone beyond that. The bull from 1976 to 1980 gained almost 800%. A comparable move today could take gold to $8,300.
On the week, gold gained 1.2%, silver 2.1%, and platinum 1.4%. The near precious metals saw palladium down 4.8% and copper slightly off 0.2%. The gold stocks managed gains with the Gold Bugs Index (HUI) up 3.3% and the TSX Gold Index (TGD) up 3.9%. All are trending in overbought territory, suggesting we could be at or near a correction. That would not necessarily be a bad thing as it would work off some of the overbought conditions.
Key levels to watch for gold are $3,600 and then $3,500. Below $3,500 there is a bigger problem. For silver it is $40.00–$40.50. For the HUI it is 535 and 515. Below 500 is problematic. For the TGD it is 650 and 590. We appear to be in the throes of a powerful bull market that may have further to run. But pullbacks can be healthy. Runaway moves not so much.
The drivers of this gold bull continue to be the same: geopolitical and domestic political tensions, economic uncertainty, and too much debt. Gold may have been responding to the alleged incursion into Estonian airspace, a NATO country, thus raising the temperature considerably in the region. Add in the recent alleged incursion of Russian drones over Poland’s airspace. Russia has accused NATO of de facto fighting against it. The temperature rises. Domestically the temperature is rising as well in the U.S. following the assassination of Charlie Kirk. Clashes have occurred and one of the fallouts was the cancelling of the Jimmy Kimmel show. Rising bond yields could be negative for gold. However, a falling US$ is positive. The US$ Index bounced back following the Fed’s rate cut this past week. Its breakout point is above 98.50.
The currencies were generally quiet with the US$ Index flat, the euro up 0.1%, the Swiss franc up 0.1%, the pound sterling down 0.7% and the Japanese yen off 0.2%. The Cdn$ rose 0.4%. The energy market continues to be quiet. We wonder how long this will last as WTI oil continues to trace what appears as a growing bottom pattern. WTI oil was up 0.1% but Brent crude fell 0.5%. Natural gas (NG) fell 1.0% as did NG at the EU Dutch Hub. The energy fared mildly better with the Arca Oil & Gas Index (XOI) up 0.2% and the TSX Energy Index (TEN) up 0.5%.
In a world that is increasingly on edge, the safe haven is gold.
Gold 1970–2025 (monthly)
__
(Featured image by Joshua Tsu via Unsplash)
DISCLAIMER: This article was written by a third party contributor and does not reflect the opinion of Born2Invest, its management, staff or its associates. Please review our disclaimer for more information.
This article may include forward-looking statements. These forward-looking statements generally are identified by the words “believe,” “project,” “estimate,” “become,” “plan,” “will,” and similar expressions, including with regards to potential earnings in the Empire Flippers affiliate program. These forward-looking statements involve known and unknown risks as well as uncertainties, including those discussed in the following cautionary statements and elsewhere in this article and on this site. Although the Company may believe that its expectations are based on reasonable assumptions, the actual results that the Company may achieve may differ materially from any forward-looking statements, which reflect the opinions of the management of the Company only as of the date hereof. Additionally, please make sure to read these important disclosures.
David Chapman is not a registered advisory service and is not an exempt market dealer (EMD) nor a licensed financial advisor. He does not and cannot give individualised market advice. David Chapman has worked in the financial industry for over 40 years including large financial corporations, banks, and investment dealers. The information in this newsletter is intended only for informational and educational purposes. It should not be construed as an offer, a solicitation of an offer or sale of any security. Every effort is made to provide accurate and complete information.
However, we cannot guarantee that there will be no errors. We make no claims, promises or guarantees about the accuracy, completeness, or adequacy of the contents of this commentary and expressly disclaim liability for errors and omissions in the contents of this commentary. David Chapman will always use his best efforts to ensure the accuracy and timeliness of all information. The reader assumes all risk when trading in securities and David Chapman advises consulting a licensed professional financial advisor or portfolio manager such as Enriched Investing Incorporated before proceeding with any trade or idea presented in this newsletter.
David Chapman may own shares in companies mentioned in this newsletter. Before making an investment, prospective investors should review each security’s offering documents which summarize the objectives, fees, expenses and associated risks. David Chapman shares his ideas and opinions for informational and educational purposes only and expects the reader to perform due diligence before considering a position in any security. That includes consulting with your own licensed professional financial advisor such as Enriched Investing Incorporated. Performance is not guaranteed, values change frequently, and past performance may not be repeated.


Vexuvo Secures €7.4M to Boost Agrivoltaic and Storage Growth
Vexuvo and the Sella Group have reached 7.4 million euros in total funding to support renewable energy growth. A new...


CAR-T Cell Therapy Induces Remarkable Remission in Patient with Multiple Autoimmune Diseases
A 47-year-old woman with three severe autoimmune diseases received CAR-T cell therapy at a German hospital, achieving one-year remission without...


Markets Rebound Briefly as War Risks and Inflation Persist
Artemis II’s safe return contrasted with failed peace talks, ending hopes of a sustained ceasefire. Markets briefly rallied on optimism,...

Dow Jones Near Highs Amid Low Volatility but Caution Signals Emerging
The Dow Jones recently closed near record highs after only a mild 10% correction, suggesting market strength. However, a few...


The TopRanked.io Weekly Digest: What’s Hot in Affiliate Marketing [LiveChat Affiliates Review]
Quick Disclosure: We’re about to tell you how LiveChat Affiliates run a top-notch affiliate program. And we really mean it....
 |
|
 |  |
 |
|
-

 Biotech4 days ago
Gilead’s $5 Billion Tubulis Deal Boosts Evotec Stake
-

 Crypto2 weeks ago
Crypto Markets Edge Up as Caution Persists and April Fools’ Scams Loom
-

 Markets6 days ago
Global Coffee Market Faces Price Drops Amid Strong Supply and Export Challenges
-

 Markets2 weeks ago
Dow Jones Tests Correction Zone Amid Bullish Momentum and Bubble Concerns