Markets
Markets Heated Up This Past Week as Guidance from the Fed Was Bearish
The Fed left rates unchanged at this past week’s meeting as expected but the guidance was hawkish. Markets didn’t like it and gapped down on Thursday. Markets were negative almost everywhere. Worse bond yields were rising as well raising the spectre of a bond accident. Looming in the background is a potential shutdown of the government. The last one in 2018 lasted 35 days and cost the economy billions.

Volatility is picking up, and that is not necessarily a good thing. On Thursday, the day after the FOMC, the S&P 500 gapped down at the opening. That is usually not a good sign. For the past few weeks, we have been noting that the market appears to be failing. With the gap down, it is another bad sign.
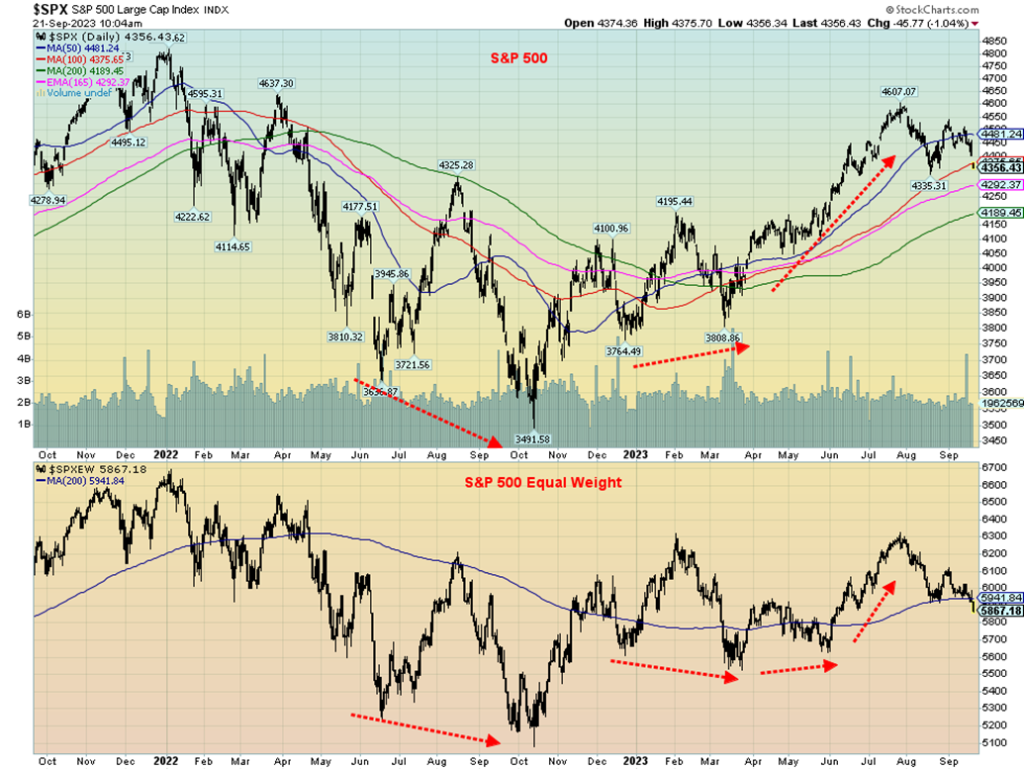
We have noted a divergence between the S&P 500 and the S&P 500 Equal Weight Index. The S&P 500 is a market cap-weighted index. The S&P 500 Equal Weight Index gives everyone the same weight. Huge companies like Apple, Amazon, and Microsoft constitute some 17% of the S&P 500. The 10 largest companies by market cap constitute 30% of the S&P 500. There are 503 companies in the index.
Our chart of the S&P 500 and the S&P 500 Equal Weight is shown on the next page. Note how both followed each other lower from June to October 2022. However, after the first rise out of October 2022, a correction followed. While the S&P 500 made a higher low on the pullback, the S&P 500 Equal Weight made a lower low. After that, the S&P 500 generally went straight up, easily taking out the August 2022 high. Following a correction in March to May 2023, the S&P 500 took off to new highs and easily took out the high seen in February 2023. Not so the S&P 500 Equal Weight, which struggled to equal the February high. A significant divergence.
Now we see the S&P 500 gapping down under the 100-day MA while the S&P 500 Equal Weight Index is dropping through the 200-day MA. That’s a bearish sign. In all, from the October 2022 low to the July 2023 top, the S&P 500 gained about 32%. The S&P 500 Equal Weight gained only 24.5% in the same period. Now the S&P 500 has fallen just over 5% vs. the S&P 500 Equal Weight, down just over 7%. In 2022, the S&P 500 gained over
19% while the S&P 500 Equal Weight rose barely over 13%. The heavyweights in the S&P 500 Index rule. Many of them are the FAANG stocks that led the AI bubble of 2023.
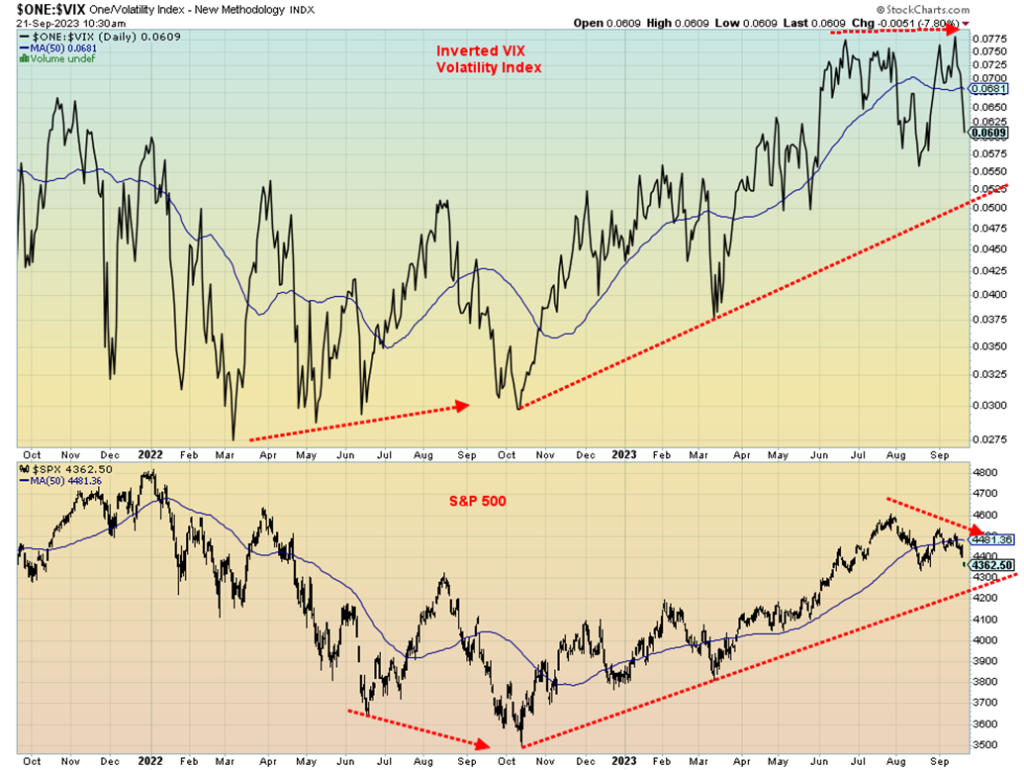
Volatility has picked up. We can’t help but notice divergences between the VIX Volatility Index and the S&P 500. We’ve used here an inverted VIX so that both the S&P 500 and the VIX move in the same direction.
In 2022, as we were headed for the October S&P 500 low, the VIX made a higher low while the S&P 500 made a lower low. That proved to be the bottom. Now it is the opposite. The VIX recently made a higher high after the first pullback while the S&P 500 made a much lower high. Another divergence. Once the S&P 500 breaks under 4,300 and especially under 4,200 we could be starting a new bear market.
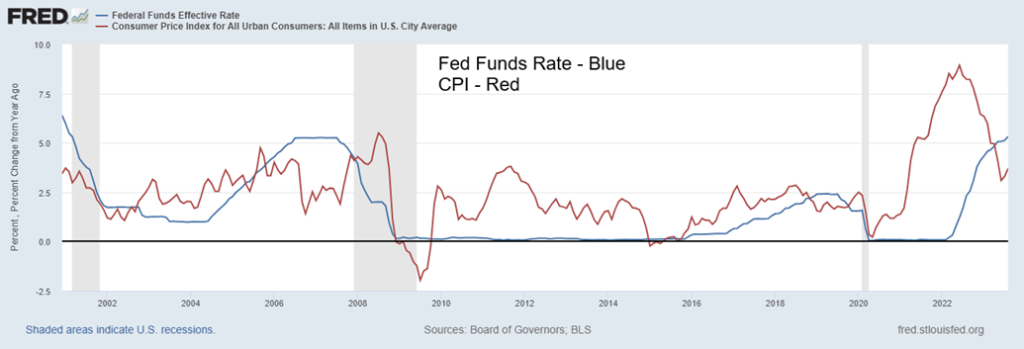
Markets walked into Wednesday’s FOMC interest rate decision. As was widely expected, the Fed left rates unchanged. Then came the guidance. Interest rates are to be kept higher for longer than expected. This is not really a surprise because, after years of the Fed rate being below the rate of inflation, for the first time since 2019 the Fed rate is actually above the CPI rate. No, the yield curve has still not normalized as it remains very inverted. But it is abating and we may have seen our low. Once that low is confirmed, recessions have occurred 100% of the time since the 1970s, 6–12 months after the low.
The Fed left the door open for further interest rate hikes if inflation were to raise its head once again. That could be possible, given the recent rise in oil prices. The Fed continues to talk up a soft landing with potentially upward revisions for the GDP into 2025 and downward revisions to unemployment. In other words, the Fed believes that the economy will continue to hang in and remain sufficient to maintain the current restrictive state. At the same time, the Fed is indicating that the odds of getting the inflation rate back to the 2% target may not occur. Could the Fed raise the target? Many economists are anticipating another rate hike before year-end, but they are also hinting at potential rate cuts in 2024 as economic conditions weaken. At least that is what the FOMC dot plots are implying. Cuts could total at least 50 bp. To cut rates, the Fed has to see unemployment softening and below-trend economic growth. Note: The Fed dot plot is a chart that shows you where each FOMC member thinks interest rates will be by the end of the current year, two or three (depending on the time of year) consecutive years after, and the more ambiguous “longer run.” Each “dot” represents a member’s individual view.
The FOMC has two meetings left in 2023: October 31–November 1 and December 12–13. Our focus is on the December 12–13 meeting as possibly the one where a rate hike might occur. Not surprisingly, markets did not take the news well and they have since fallen, while bond yields rose, the US$ Index rose, and gold fell. Oil wound up rising again but for other reasons, as noted in our commentary about oil.
Fed Funds vs. CPI % Change 2000–2023
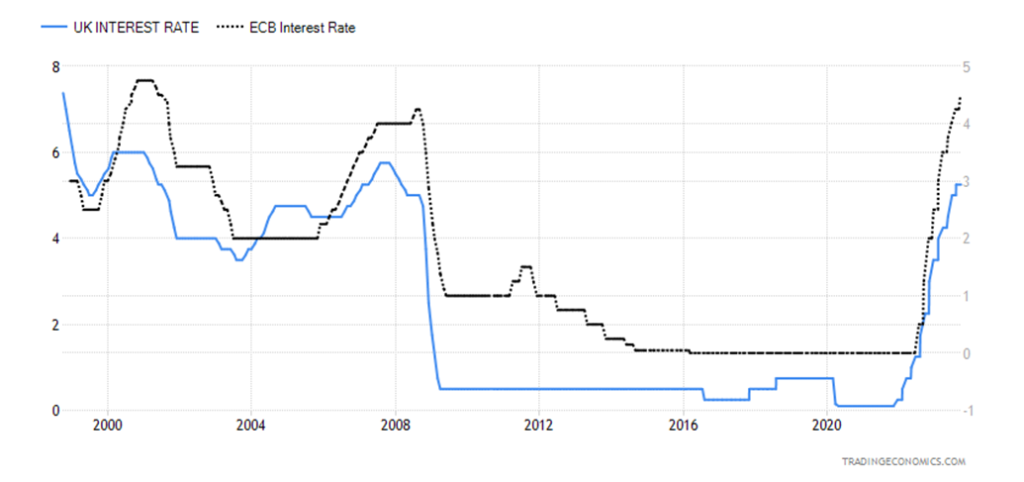
The Fed wasn’t the only one having an interest rate meeting this past week. The Bank of England (BOE) left rates unchanged. The U.K. also received a lower-than-expected inflation report. The European Central Bank (ECB), however, hiked rates 25 bp for the 10th consecutive time to 4.50%, despite signs that the EU is headed into a recession. Germany, the leading economy, already is in a recession so it is not surprising that the rest of the EU could follow. The ECB rate hike is the highest in 22 years.
The signs for further rate hikes from the Fed are there and the odds of rate cuts in 2024 are distant. However, the Fed keeps talking up a soft landing. It’s not likely they are going to talk up a hard landing as some economists believe. Rates will remain elevated unless the Fed sees inflation moving down substantially. The market didn’t like that and sold off.
Markets are facing increasing uncertainty on a number of fronts. 2024 is an election year, and volatility and even violence are expected to rise as we go into what appears to be a repeat of 2020 with Trump/Biden.
Tensions continue between the U.S. and China, the world’s two largest economies. Trade is diminishing, there are sanctions against China, and confrontations have taken place between the U.S. and Chinese warships (along with others, such as Canada) in the Straits of Taiwan. The Russian/Ukraine war continues with no end in sight. As the war continues, the risks of it morphing into something else are rising. There are numerous sovereign countries on the brink of bankruptcy. Two are of big concern—Turkey and Argentina.
Interest rates continue to rise, despite the Fed’s pausing. The 10-year U.S. treasury note, which impacts numerous other interest rates such as mortgages, keeps on rising and is the highest seen since 2007, before the onset of the 2008 financial crisis. As a result, the risk of a blow-up in the bond market is rising. Higher interest rates are here to stay and the risks are rising as result, particularly in the mortgage market. The U.S. federal debt recently surpassed $33 trillion. The earlier threat of a U.S. debt default was averted but has never really gone away, because of the deep divisions and polarization in the U.S. A further debt downgrade, particularly from Moody’s, cannot be ruled out.
Bank of England (BOE) European Central Bank (ECB) Interest Rate 1998–2023
Are signs of economic trouble on the way? The Fed expects the labor market to remain strong. But trouble could be brewing: first, in the form of the UAW strike, and, secondly, the growing potential for a government shutdown on September 30. While the UAW strike could be resolved tomorrow, it is already having a negative impact on parts plants where a few thousand workers have been laid off (Magna recently announced layoffs). The strike involves only about 13,000 employees of over 150,000 employees. But what if more join? How does it impact ancillary businesses like the local coffee shop? The longer it drags on, the greater the risk to the broader economy.
Potentially having deeper consequences is the shutdown of government. The last time was December 22, 2018, to January 25, 2019, under former president Trump. That shutdown lasted 35 days, although the average is about 10 days. Oddly enough, the stock markets fell in advance of the shutdown, down over 11% from December 6 to December 26. The lead-up seemed to be to sell the rumor and buy the news. Gold during the same period actually rose. The rally started in late November and lasted until early February. Gold rose over 12% during that period. Buy the rumor, sell the news?
However, like the UAW strike, the impact of a shutdown reverberates in numerous other businesses that depend on government workers being at their desks. And that has potentially negative consequences for the economy.
S&P 500, Gold September 2018 to February 2019
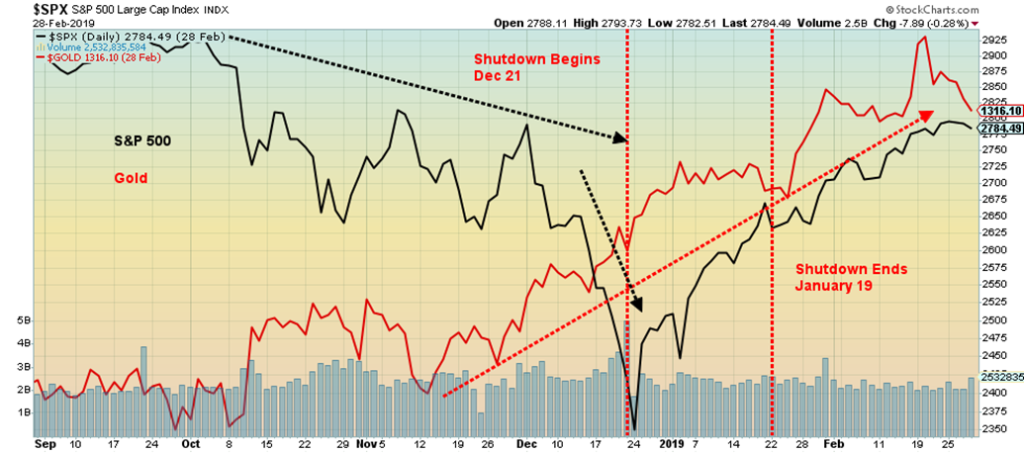
For markets today, we seem to have the opposite with the stock market coming off a high as opposed to falling sharply, as it did before the shutdown in 2018. We do have another week to go before we’ll know for sure whether the government shuts down. They might yet come to an agreement, but the odds are not looking good. There are some 2.9 million government workers that could be impacted. Will social security cheques go out? Back in 2018 over 800,000 government employees were furloughed without pay. Estimates pegged the shutdown as costing the U.S. economy over $11 billion. The divide was there for all to see between the Democrats and the Republicans. And today that divide is as wide as ever, including a divide within the Republican party.
We are plunging into the unknown. And, with the unknown, the odds of a Black Swan event are rising.
Canada Inflation
Canada Inflation vs. Chartered Banks Prime Lending Rate 1998–2023
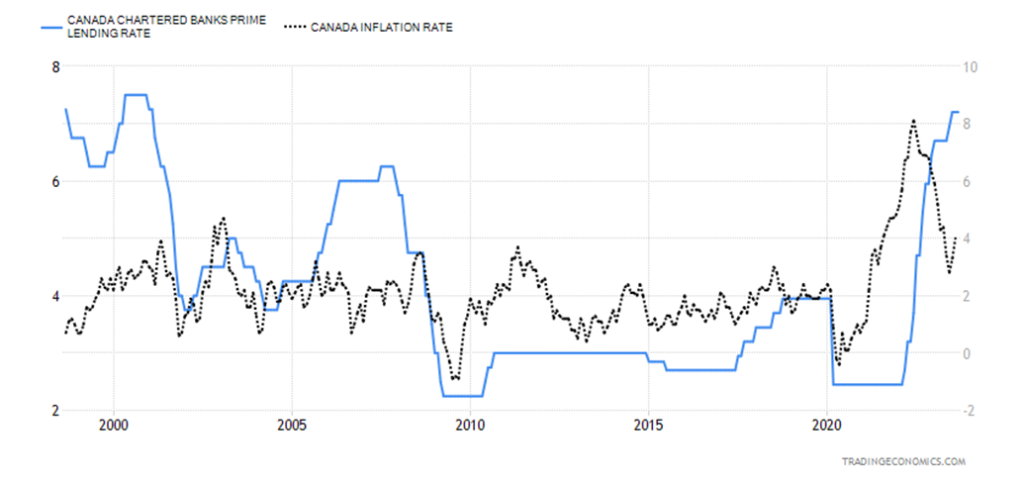
Canada’s inflation rate jumped last month to 4%, above the expected 3.8% and July’s rate of 3.3%. Rising oil prices were mostly to blame, which negatively impacted transportation. And as if that was not enough, the cost of the shelter went up 6% vs. 5.1% the previous month and rent was up 6.5% vs. 5.5%. This was the second consecutive month of rising inflation, raising fears that the Bank of Canada (BofC) might hike again before year-end. Oddly, food prices slowed to +6.8% vs. +7.8% the previous month. The core inflation rate such as food and energy rose by only 3.3%, but was up from 3.2% the previous month.
Instead of comparing this to the BofC rate, we compared it to the chartered banks’ prime lending rate. It is currently at 7.2%, unchanged from the previous month. But what’s interesting is, for the first time since 2007–2008, the chartered bank’s prime lending rate is above the rate of inflation. A positive yield curve. We believe that is a more normal type of situation as the ultra-low interest rates from 2008–2022 were constantly below the rate of inflation. That, along with quantitative easing (QE), is what contributed to the bubbles in stock markets, housing, etc. Inflation is not necessarily a monetary thing as, in this case, inflation hit hard assets because of the availability of too much money and ultra-low interest rates. Simply too much money, too much cheap money, was chasing too few assets. The result: asset inflation.
Another way we looked at it, but without inflation this time, was by comparing the BofC rate, currently at 5%, against the 10-year Government of Canada bond (CGB). As we noted previously, the BofC rate was consistently below the 10-year bond. Now, for the first time since 2007–2008, the 10-year is again below the central bank
rate. The BofC rate is at 5% while the 10-year is currently trading around 3.91%. Chartered banks set their mortgage rates based on the yield curve of Government of Canada bonds. Floating rates are, however, based on the prime lending rate.
For the first time in some time, we have a more normalized yield curve. Even if inflation were to pick up a bit more, the Bank of Canada may still do nothing as long as we have a normalized yield curve. Still, the adjustment for many is painful, especially in the mortgage market where over one-third of mortgages were based on floating rates. That was driven by the expectation that rates would never rise. They did. And now it has become painful for many, as delinquencies rise. As well, housing prices are softening but they still haven’t crashed. The days of chasing houses (or condos) with multiple bids is over. They just hope they can get a bid. Falling house prices add to the pain.
Bank of Canada Rate vs. 10-year Government of Canada Bond (CGB) 1998–2023
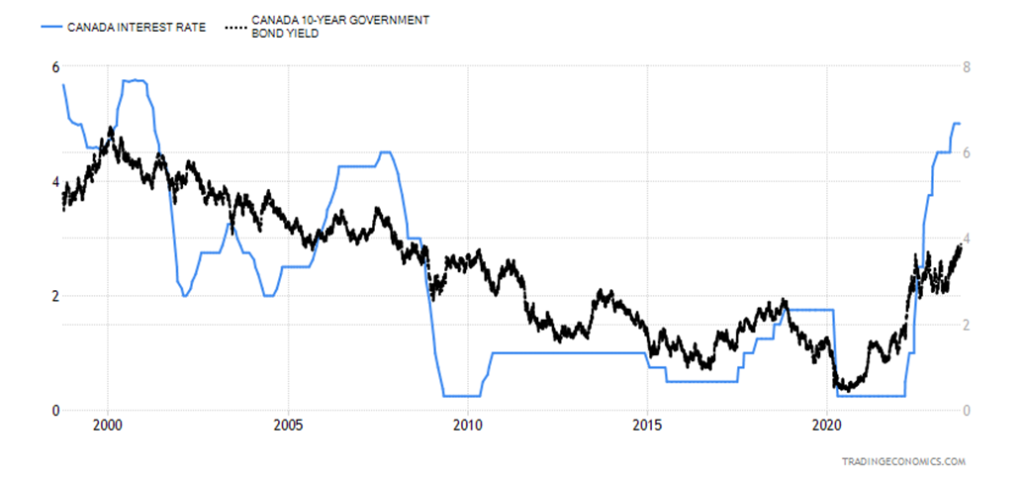
Chart of the Week
Events…
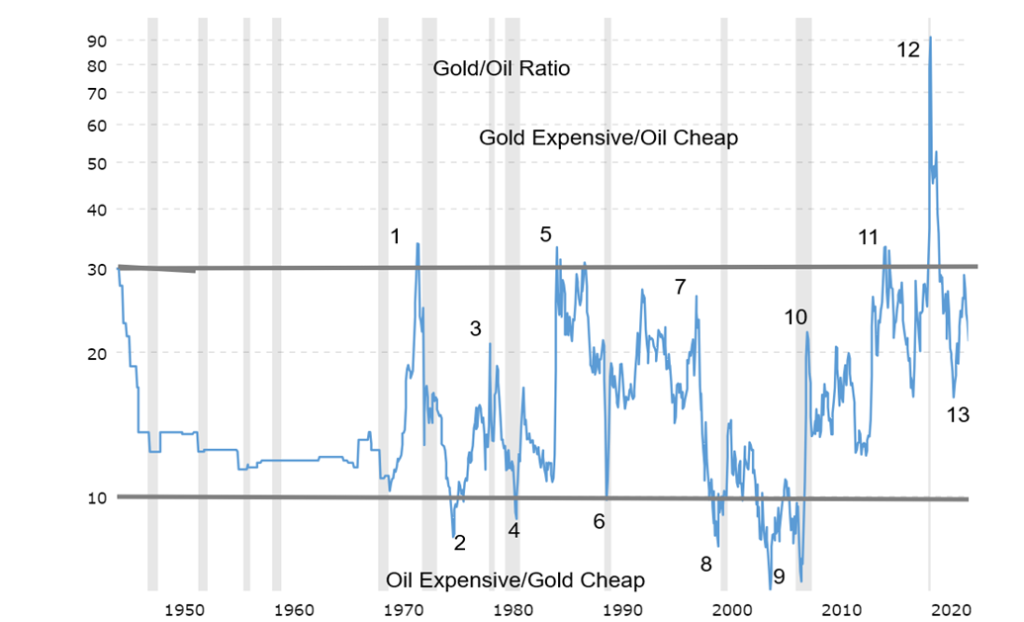
- First surge in gold prices following the end of the gold standard in August 1971
- Arab oil embargo, 1973
- Second surge of gold prices in late 1970s with the peak in January 1980 at $875
- Collapse of gold prices following the peak
- Collapse of oil prices as Saudis raise production, creating a price war
- Iraq War 1, 1990
- Russia/LTCM crisis, 1998
- Collapse of gold prices to $250 as oil prices start to rise with increased demand
- Increased demand for oil from China and Asia
- Financial crisis, 2008
- Peak of gold in September 2011 at $1,923
- Pandemic, March 2020
- Surging demand for oil, production cuts in Russia/Saudi Arabia, falling U.S. inventories
The best-known ratio we follow is the Dow/Gold ratio (Dow – Dow Jones Industrials (DJI)). The ratio is a measurement of the relative strength of the stock market vs. gold and determines whether one should own gold or equities. It tells us how many ounces of gold it takes to buy a unit of the DJI. The gold/oil ratio is a similar measurement of whether one should own oil or gold. The ratio tells how many barrels of oil we can buy with an ounce of gold. Both gold and oil are considered an inflation measurement as it tells us that high oil prices typically lead to inflation, whereas high gold prices reflect the need to get out of inflationary assets bonds, and cash.
The ratio has a long history. However, it is only recently that some analysts are paying attention to it. Of late, oil prices have been rising sharply, up some $27 from lows seen in April 2023 or 42%. Gold during the same period is down about 3%. An interpretation of the ratio suggests that a low ratio reflects a healthy economy but a high ratio suggests a distressed economy. Currently, it appears to be somewhere in between, despite the recent rise of oil prices. Gold is considered expensive vs. oil when the ratio is over 30, but if the ratio is under 10 it suggests that oil is expensive relative to gold.
As the chart shows, the ratio spends most of its time between 10 and 30. However, extremes do happen, such as during the pandemic when oil prices collapsed but gold was relatively stable. During the pandemic, the ratio leaped to the highest ever seen at 104. Long term, the ratio tends to average about 16:1, so mostly trading between 10 and 30 suggests it is around the average.
While the pandemic brought the gold extreme vs. oil, at the other extreme the ratio collapsed to just over 6 in 2008 as oil demand surged during the 2000s due to sharply increased demand, particularly from China. Events such as the Arab oil embargo in 1973, Gulf War 1 in 1990, and Gulf War 2 in 2003 also saw the ratio collapse due to sharply higher oil prices. For the other crises, such as the Russia/LTCM collapse of 1998 and the financial crisis of 2008, oil prices fell while gold rose.
Cycle analysts tend to look at the lows to determine if there is any pattern of cyclical lows. Since 1970, we noted 10 lows of importance. The average time between each low was 4.6 years but the range was 3 to 7 years. However, 4 of the 10 were 5 years old. By that definition, the last low was in May 2022, so we could expect another low around November 2026; but the low could range from as early as 2025 to as late as 2029. However, the odds favor the low being sometime in late 2026. Extreme peaks are rare and include ones in 1973, 1986, 2016, and 2020. All were recorded peaks of the ratio over 30. At the other extreme, there were five instances where the ratio went under 10 in 1976, 1982, 2000, 2005, and 2008.
Knowing that, on average, the next low may not occur until 2026 suggests we might see a peak in the ratio sometime in between. A move of the ratio over 30 would suggest that we could be approaching a peak with gold expensive and oil cheap.
Following the ratio is worthwhile. However, like many ratios, it tends to work best as a long-term indicator where we look for extremes that might suggest the trend could reverse. Right now, with the ratio around 21, it is trading in the normal range.
Markets & Trends
| % Gains (Losses) Trends | ||||||||
| Close Dec 31/22 | Close Sep 22, 2023 | Week | YTD | Daily (Short Term) | Weekly (Intermediate) | Monthly (Long Term) | ||
| Stock Market Indices | ||||||||
| S&P 500 | 3,839.50 | 4,320.06 | (2.9)% | 12.5% | down | up | up | |
| Dow Jones Industrials | 33,147.25 | 33,963.84 | (1.9)% | 2.5% | down | up (weak) | up | |
| Dow Jones Transport | 13,391.91 | 14,987.82 | (2.3)% | 11.9% | down | up (weak) | up | |
| NASDAQ | 10,466.48 | 13,211.81 | (3.6)% | 26.2% | down | up | up | |
| S&P/TSX Composite | 19,384.92 | 19,779.97 | (4.1)% | 2.0% | down | neutral | up | |
| S&P/TSX Venture (CDNX) | 570.27 | 570.09 | (3.5)% | flat | down | down | down | |
| S&P 600 (small) | 1,157.53 | 1,146.45 | (3.4)% | (1.0)% | down | down | neutral | |
| MSCI World | 1,977.74 | 2,087.53 | (1.6)% | 5.6% | down | neutral | neutral | |
| Bitcoin | 16,531.31 | 26,533.95 | 0.5% | 60.5% | neutral | neutral | neutral | |
| Gold Mining Stock Indices | ||||||||
| Gold Bugs Index (HUI) | 229.75 | 223.09 | (2.7)% | (2.9)% | neutral | down | down | |
| TSX Gold Index (TGD) | 277.68 | 270.93 | (2.2)% | (2.4)% | neutral | down | down | |
| % | ||||||||
| U.S. 10-Year Treasury Bond yield | 3.88% | 4.44% | 2.5% | 14.4% | ||||
| Cdn. 10-Year Bond CGB yield | 3.29% | 3.91% | 4.6% | 18.8% | ||||
| Recession Watch Spreads | ||||||||
| U.S. 2-year 10-year Treasury spread | (0.55)% | (0.67)% | 5.6% | (21.8)% | ||||
| Cdn 2-year 10-year CGB spread | (0.76)% | (1.00)% | (1.0)% | (31.6)% | ||||
| Currencies | ||||||||
| US$ Index | 103.27 | 105.61 | 0.3% | 2.3% | up | up | up | |
| Canadian $ | 73.92 | 74.29 | 0.3% | 0.5% | neutral | neutral | down | |
| Euro | 107.04 | 106.45 | (0.1)% | (0.6)% | down | down | down (weak) | |
| Swiss Franc | 108.15 | 110.24 | (1.1)% | 1.9% | down | neutral | up | |
| British Pound | 120.96 | 122.41 | (1.1)% | 1.2% | down | down (weak) | neutral | |
| Japanese Yen | 76.27 | 67.38 | (0.4)% | (11.7)% | down | down | down | |
| Precious Metals | ||||||||
| Gold | 1,826.20 | 1,945.60 | flat | 6.6% | down (weak) | neutral | up | |
| Silver | 24.04 | 23.84 | 1.9% | (0.8)% | neutral | neutral | neutral | |
| Platinum | 1,082.90 | 934.10 | 0.5% | (13.7)% | neutral | down | down | |
| Base Metals | ||||||||
| Palladium | 1,798.00 | 1,256.10 | 0.3% | (30.1)% | up | down | down | |
| Copper | 3.81 | 3.70 | (2.6)% | (2.9)% | down | down | neutral | |
| Energy | ||||||||
| WTI Oil | 80.26 | 90.03 | flat | 12.2% | up | up | up | |
| Nat Gas | 4.48 | 2.88 | 9.1% | (35.7)% | up | neutral | down | |
New highs/lows refer to new 52-week highs/lows and, in some cases, all-time highs.
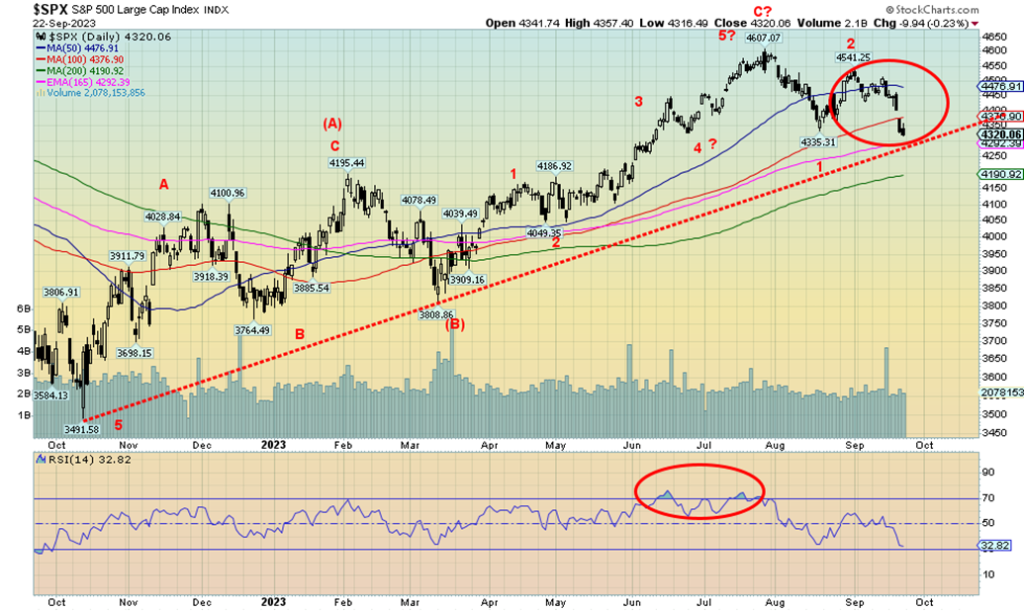
Is a new bear market underway? We don’t like the signs. On Thursday, after Wednesday’s FOMC interest rate decision, markets gapped down. It appears as a potential breakaway gap with further bearish implications. We gapped under the 100-day MA. The 200-day MA remains away at 4,190. We took out the first wave down below the August low of 4,335, closing the week under that level, a bearish sign. We failed to reach the July high of 4,607, failing at 4,541. Potential targets are now 4,125 below the 200-day MA. We noted the divergences with the S&P 500 Equal Weight Index and the VIX Volatility Indicator earlier. We have a lot of bearish signs. Other markets also gapped down. Few were spared.
The S&P 500 fell 2.9% this past week. The S&P 500 Equal Weight Index was down 2.9% as well. The Dow Jones Industrials (DJI) held up but was still down 1.9%. The Dow Jones Transportations (DJT) was down 2.3% and the NASDAQ fell 3.6%. The S&P 400 (Mid) was down 2.8% while the S&P 600 (Small) was off 3.4%. The NY FANG Index dropped 4.9%.
In Canada, the TSX Composite fell 4.1% while the small cap TSX Venture Exchange (CDNX) fared somewhat better, down 3.5%. The CDNX is now negative on the year. In the EU, the London FTSE was down 0.4%, one of the better performers. The EuroNext fell 2.0%, the Paris CAC 40 dropped 2.6%, and the German DAX was down 2.0%. In Asia, China’s Shanghai Index (SSEC) was actually a star, up 0.5%, but the Tokyo Nikkei Dow (TKN) fell 3.4% and Hong Kong’s Hang Seng (HSI) dropped 0.7%.
This is not a good sign for the bulls who appear to be still buying the dip. But what kind of bear will it be? Swift like March 2020 or even 2008–2009? Or will it be a grinding market like 1973–1974 or for that matter 1930–1932? Not that we are suggesting a decline like 1930–1932, but we could easily have a decline like 1973–1974 when the S&P 500 fell 48%. Others fell even more. The trouble is, one can never tell, at least initially. Maybe it’s a shallow bear like 1980–1982 when the S&P 500 fell 27%. Recall that in 2022 the market fell roughly 27–28%. Nonetheless, we appear to be starting the third wave down, as we have noted previously. Usually, this is the worst wave and we could see new lows below October 2022 at 3,492. Bear prepared!
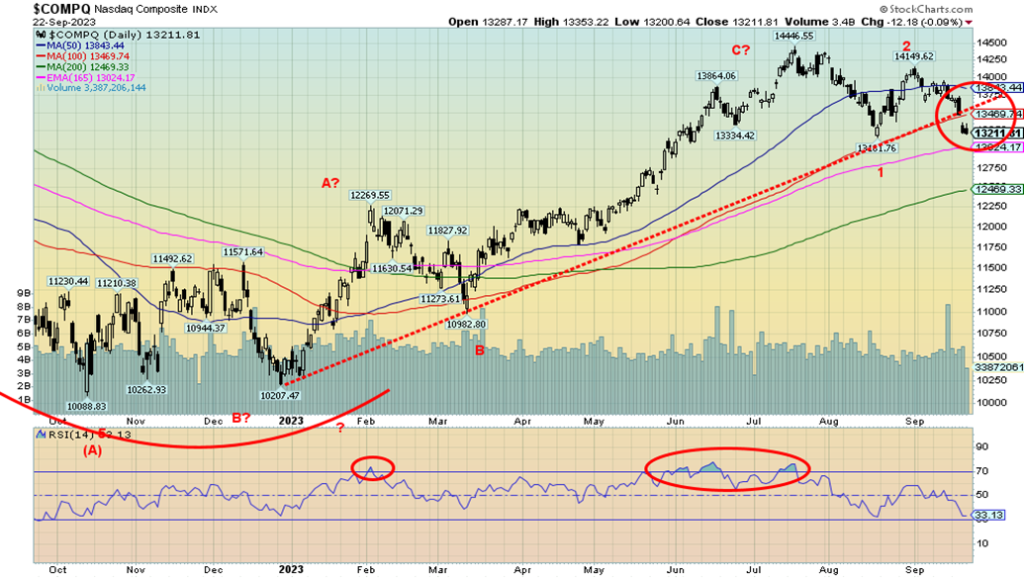
Like the S&P 500, the NASDAQ gapped down this past week after the FOMC on Wednesday. A very bearish sign. We gapped under that uptrend line to form a low in December 2022. We fell from the 14,446 July high, then rallied but failed to take out that high and now have taken out that first wave down low seen in August. Potential targets are 12,700/12,750. The 200-day MA is at 12,470 and that could easily be a target as well. Note those are minimum targets and a break under 12,000 would target even lower prices. The NY FANG Index fell 4.9% this past week and a number of FAANGS had a bad week. Tesla fell 10.8%, Snowflake was down 7.8%, Amazon was down 8%, and Nvidia was off 5.2%. They were the upside leaders, but now they appear to be the downside leaders. Not an enjoyable week and the chart of the NASDAQ gives us no comfort. The only good news is we could be approaching a temporary low with the RSI at 33. A breakdown under 30 would set up oversold conditions and lead to at least some shorts taking profits.
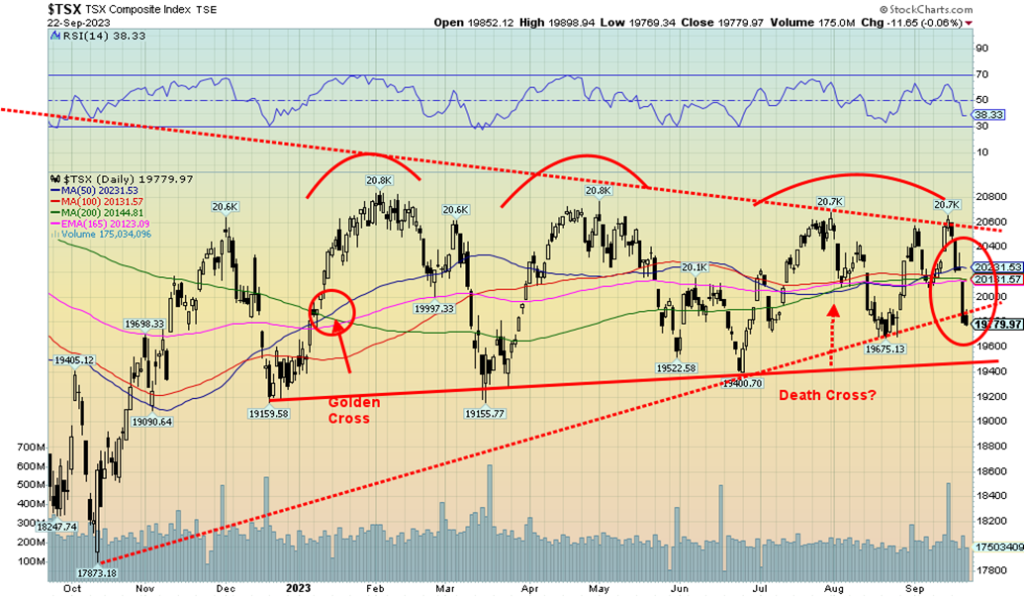
It was a terrible week for the TSX. What appeared to be an attempt at a breakout the previous week turned into a mini-disaster this past week. The TSX Composite fell 4.1% this past week, gapping down on Thursday as did many other stock markets. It is a signal to us that we are most likely headed for a new bear move to the downside. The TSX Venture Exchange (CDNX) actually fared a bit better, falling only 3.5%. No consolation as the CDNX looks increasingly bearish and many of the mining stocks that make up the index are trading at multi-year lows, some down even 90%. Feast or famine for that sector.
Not one TSX sub-index was up this past week. All fell. The leader was Information Technology (TKK), down 8.0%. Health Care (THC) fell 5.9%, but THC is the smallest component. Important components like Energy (TEN) fell 4.4%, Financials (TFS) were down 3.3%, Industrials (TIN) were off 3.8%, and Materials (TMT) fell 4.5%. The blue chip-based TSX 60 dropped 4.3%, more than the TSX Composite itself. Others losing more than 4% included Income Trusts (TCM), down 4.7%, and Real Estate (TRE), off 4.7%. Both are highly interest-sensitive. Who were the losers with the least loss? Consumer Staples (TCS) fell 2.4%, Golds (TGD) dropped 2.2%, and the winner was Telecommunications (TTS), losing 1.6%. BCE held in.
This chart now looks quite bearish with four or five attempts to break that downtrend line. It’s all over now as we broke the uptrend line. Looming below is a major support line near 19,400. Once that breaks, downside targets could be 18,750 or a mere 5% from current levels. There could be even further downside targets. Only new highs above 20,600 could break this.
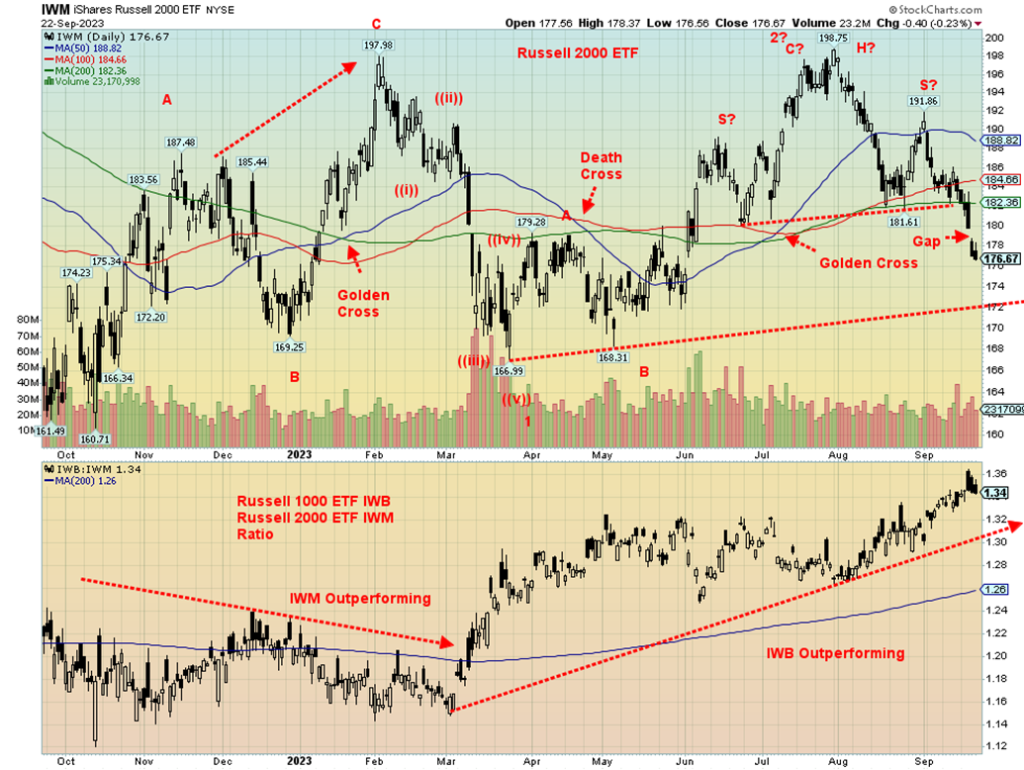
Above is a chart of the Russell 2000 ETF small-cap index. The ETF replicates the Russell 2000. Below is the Russell 1000 Russell 2000 ETF ratio. The Russell 1000 is the large-cap stocks of the Russell 3000 index. The 3000 is the 1000 + the 2000.
Like everyone else, the Russell 2000 gapped down on Friday. This chart is looking quite bearish with a potential head and shoulders top pattern. The neckline has been broken and targets potentially down to 163. That is getting perilously close to the lows of October 2022. The odds of the October low falling then rise significantly. The ratio chart of Russell 1000/2000 shows how the 1000 has been outperforming the 2000 since March 2023. It was a warning sign that a shift was going on from small cap to large cap. Prior to that the 2000 was outperforming but only marginally. Oddly the ratio seems to have fallen over the past few days. However, if we are entering a bear the odds still are in favor of 1000 over 2000.
U.S. 10-year Treasury Bond/Canadian 10-year Government Bond (CGB)
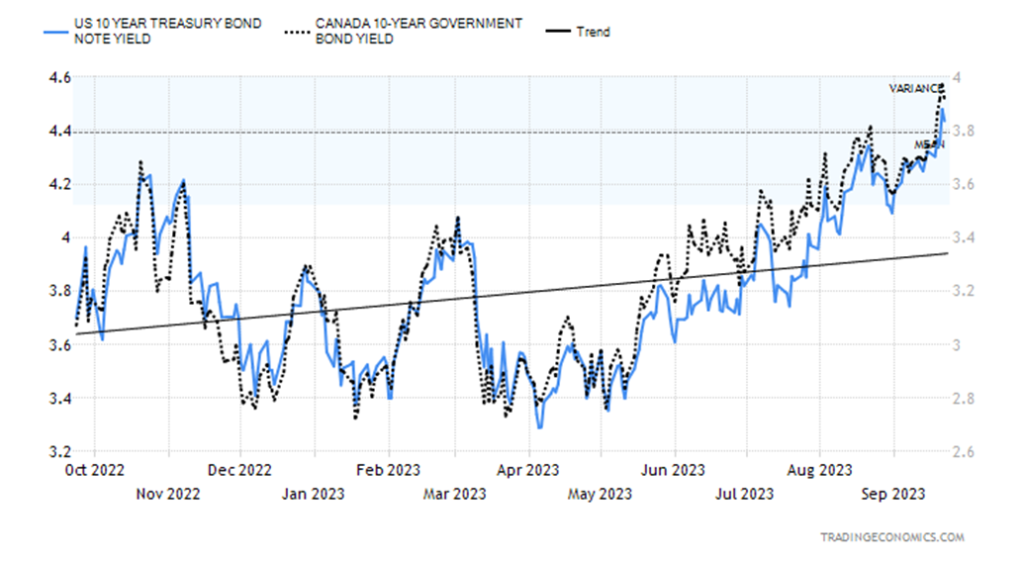
Interest rates keep chugging higher, suggesting we are in a new phase for interest rates. Instead of low rates as we experienced for years, thanks to first the financial crisis and then the pandemic, both helping to create bubbles, we are now in a period of rising and elevated interest rates, pricking all those bubbles. Cyclically, bonds tend to make lows (price as yields move inversely to price) every six years, with in-between lows either every two years or one three-year low. That pattern has been pretty consistent, especially since the major lows of 1981. What we have experienced since bonds topped (price) in July–August 2020 is the steepest drop we have witnessed since the bear markets of the late 1970s. Distinct six-year lows with a range of 5–7 years were seen from 1981 in 1987, 1994, 2000, 2005–2007, 2013, and 2018. The next one is due now until 2025. We have now been breaking all of the trend lines up from the first 1981 and also a one from the 1987 low. We have entered a new period of higher interest rates and are not likely to return to the previous period of low-interest rates.
A hawkish Fed isn’t helping. While the Fed stood pat, as was widely expected, they hinted at another rate hike this year (probably in December) and potentially two rate cuts in 2024 that would likely come later in the year. The U.S. 10-year treasury note is now up to 4.44%, well up from its low of 0.55% in 2020. It has broken all downtrend lines and is pointed higher. No surprise then that there are problems for the stock market as well as growing problems in the housing market, both of which seemed to believe interest rates would stay low forever.
The same is true in Canada where the 10-year Government of Canada bond (CGB) is at 3.91%, up from a low of 0.48% in August 2020. These are huge increases on a percentage basis. The amazing part is, up until now at least, no major bond fund has failed. And that is saying something, given the previous bond market collapses during the Savings & Loan crisis of the 1980s, the dot.com crisis of 2000–2002, and the financial crisis of 2007–2009. There was also the Russian/LTCM meltdown in 1998. Many of them involved high-yield or junk bonds. We also recall bond crisis in 1984, 1994, and, 2000. The bond market is the biggest in the world and the U.S. bond market the largest bond market in the world. Unlike stocks, bonds do not trade on an exchange. Bonds are normally at the center of any financial crisis.
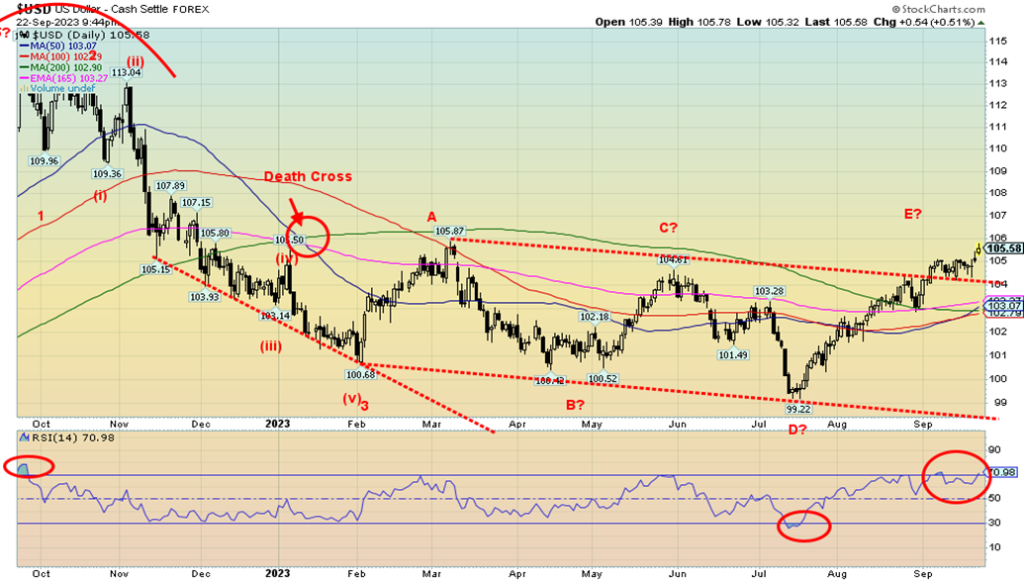
The US$ Index appears to have achieved potential targets and is just shy of that March 2023 high of 105.87. The pattern of the past year continues to appear to us a potential huge ABCDE-type of pattern, based on the decline to the 100.68 low in early February 2023. While it has the appearance of a breakout, we note the RSI is now overbought over 70. That doesn’t guarantee a top, but it indicates that we could be forming a top. Nonetheless, until we break under 102/103, the trend is up and is expected to continue that way. The alternative is that we completed an ABC correction with the low at 99.22 and we are now embarking on a new bull run.
On the week, the US$ Index rose 0.3%. The other currencies were mixed as the Canadian dollar, thanks to higher oil prices, rose 0.3% but the euro fell 0.1%, the Swiss franc dropped 1.1%, the pound sterling was off 1.1%, and the Japanese yen continued its woes, down about 0.4%. One positive for Japan is that gold in the Japanese yen made fresh all-time highs this past week, the only currency in the US$ Index to do so. Is it being a leader?
We can’t rule out higher prices ahead. The US$ Index has been up for 10 weeks in a row. We have labeled this an E wave. However, it could also be wave 1 out of a different pattern where the low of July 2023 at 99.22 was actually the fifth wave down with the corrective from February 2023 to the high in June 2023, the corrective wave. However, a pullback should soon be in order. A breakback under 104 would indicate a top is in. A break under 102 could start a downward drop. But only new lows under 99 would confirm we are embarking on another major wave down. A rising U.S. index is negative for gold and for foreign issuers of U.S. dollar debt.
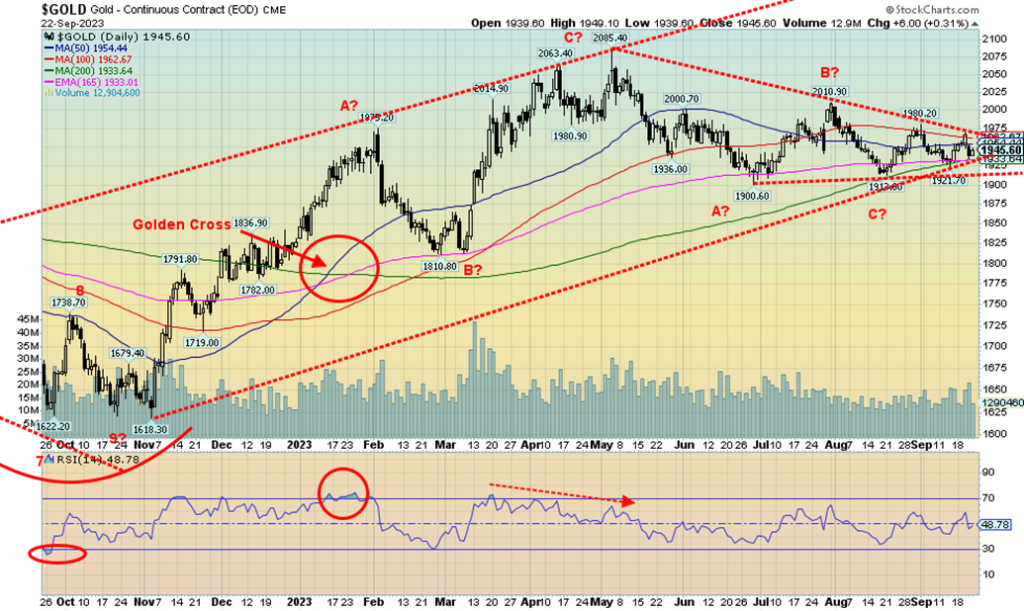
It was a strange week for gold prices. Despite a higher US$ Index, gold managed to remain flat on the week. Silver actually rose up 1.9%. Gold rallied into Wednesday but fell sharply on Thursday, following Fed Chair Powell’s guidance that, while the Fed stood pat as expected at Wednesday’s FOMC, they are committed to defeating inflation. With oil prices still rising, inflation was ticking up again, raising the specter of further rate hikes in 2023. Gold did not like that, falling sharply on Thursday but bouncing back nicely on Friday, despite the higher US index.
The triangular pattern is running out of room. A resolution should soon be upon us. The downward-sloping pattern is, however, not encouraging. To the upside, a breakout of $1,975/$1,980 could set us toward $2,000.
But to the downside, a breakdown under $1,915/$1,930 could set up a downward spiral with potential targets down towards $1,800 and, in a worst-case scenario, a decline to $1,725. A firm break under $1,930 would also break the 200-day MA.
While gold was flat and silver up, platinum gained 0.5% and the near PMs saw palladium up 0.3% but copper falling 2.6%, falling on economic worries here and in China. The gold stocks fell with the Gold Bugs Index (HUI) down 2.7% and the TSX Gold Index (TGD) off 2.2%. The commercial COT is giving few clues, but is somewhat negative, according to our calculations. Our former source has become hit-and-miss (mostly miss), so, as a result, we have to calculate it ourselves. Indications are that it is at 29%, which is mildly bearish.
Talk of $2,500 gold is just that when the pressure appears to be to the downside. Our focus is on the December FOMC for a possible low. To confirm that our long-term cycles of 7.8 years and 23.5 years are in, we need to break out above $2,100. We are in the period for our long-term lows, but long-term cycles have wide parameters. Last year’s low in November 2022 fits the bill, but we always believed that if the low came in December 2023 it would be better fit. However, is it a lower low under November 2022’s low of $1,618 or a higher low? A higher low would be quite bullish. We recall 2015 when gold made what is, so far, the low of the last dozen years at $1,045. That low came on the December 2015 FOMC. The FOMC rate decision is December 12–13. We’d earmark that period for a potential low.
As we go into 2024, we have an election that we suspect could generate a lot turmoil, even violence. As well, we have the ongoing war between Russia/Ukraine which appears to be stalemated. Each could dial up the violence as more powerful weapons are sent to Ukraine. The polarization of society in the U.S. is wide and also growing wide in Canada as well. Extreme right-wing parties are on the rise in the eurozone as well and that, in turn, brings the potential for violence. Tensions continue between the U.S. and China and confrontations could intensify. Canada is now in a serious spat with India. India is a BRICS member, along with Russia, China, Brazil, and South Africa. Others are joining BRICS, creating a potentially polarized world. All these are ultimately positive for gold.
However, first, we have to find that low and confirm it with a breakout over $2,100.
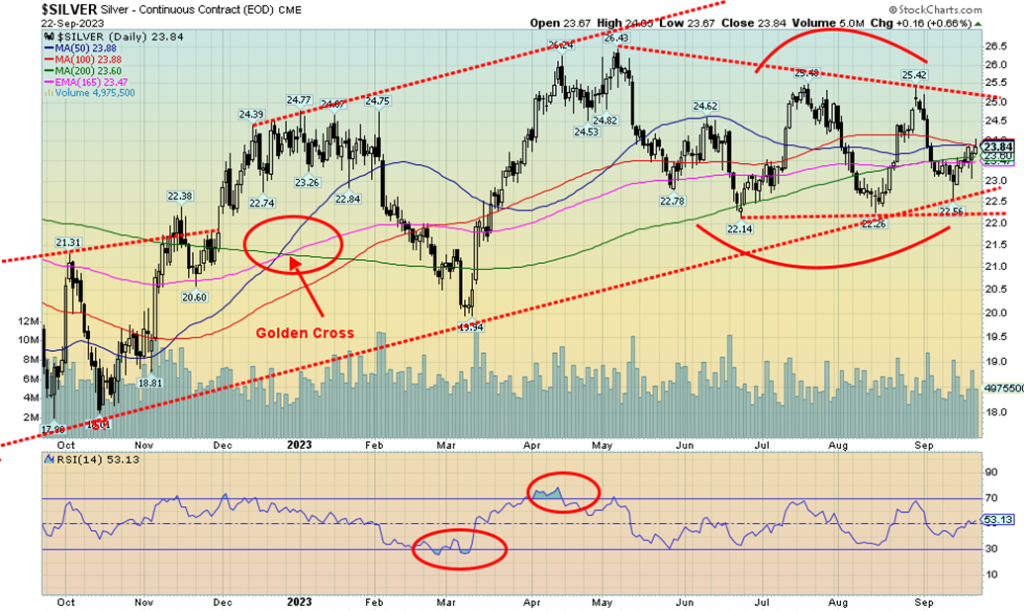
In a surprise move, silver actually closed higher this week, gaining 1.9% vs. gold just flat. Silver leading is good. However, we had mixed signals this past week with silver up but gold stocks down. We’d prefer both to be leading gold to suggest we are going higher. Silver is forming what appears to be a large triangle. We also have what appears to be a double top and a double bottom. As we have noted many times, the upside breakout doesn’t come until we break firmly over $25. However, the downside risk is first at $23, then under $22.25. A break of those levels indicates we could fall to new lows. A break under $20 would confirm that and suggest a potential test of the November 2022 low of $17.90. Getting above $24 would be good, but we won’t feel comfortable about an upside breakout until we are above $25. The RSI is currently neutral. Two scenarios—one bullish, the other bearish. The pattern is like a double zig-zag. The rise this week is encouraging, but only becomes meaningful if we follow through and take out $25.
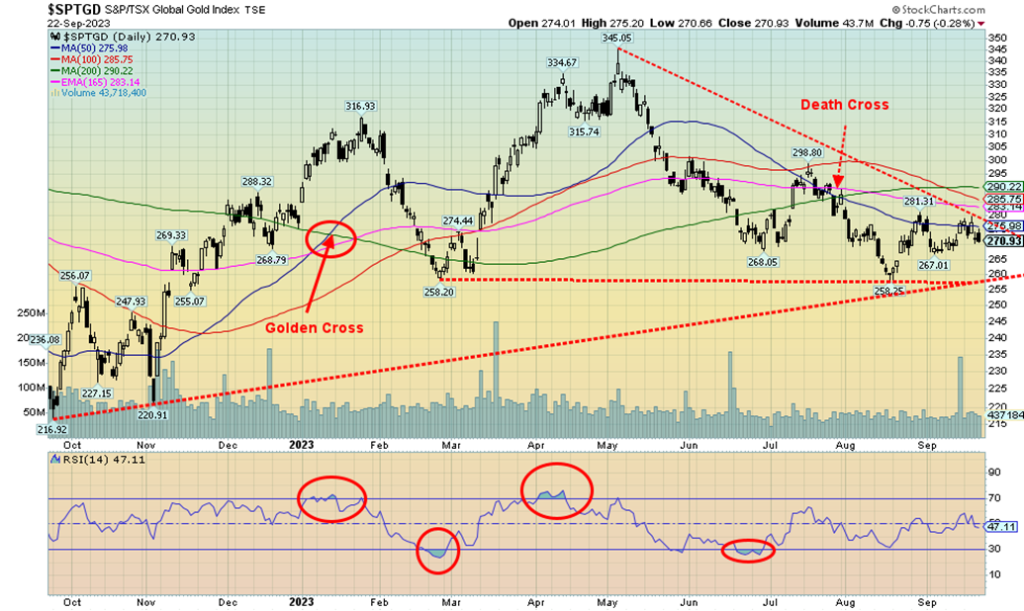
Gold stocks traded poorly this past week, more in conjunction with the broader market rather than following gold/silver higher. The TSX Gold Index (TGD) fell 2.2% while the Gold Bugs Index (HUI) was off 2.7%. Despite the decline, the short-term trend was still neutral at week’s end. Sentiment even improved marginally as the Gold Miner’s Bullish Percent Index (BPGDM) did improve to about 18% from close to 15%. The RSI for the TGD is at 47, an indication the market is fairly neutral at this point. Like gold and silver, the TGD appears to be forming a triangle. We confess we don’t like the downward slope of the index, indicating the next move might be to the downside. A break of 260 and especially under 255 could indicate a decline to at least 220 or about 19% from current levels. Only a break above 280 and especially over 209/300 would be positive and indicate the next move is the upside. Gold bugs, of course, would prefer the latter.
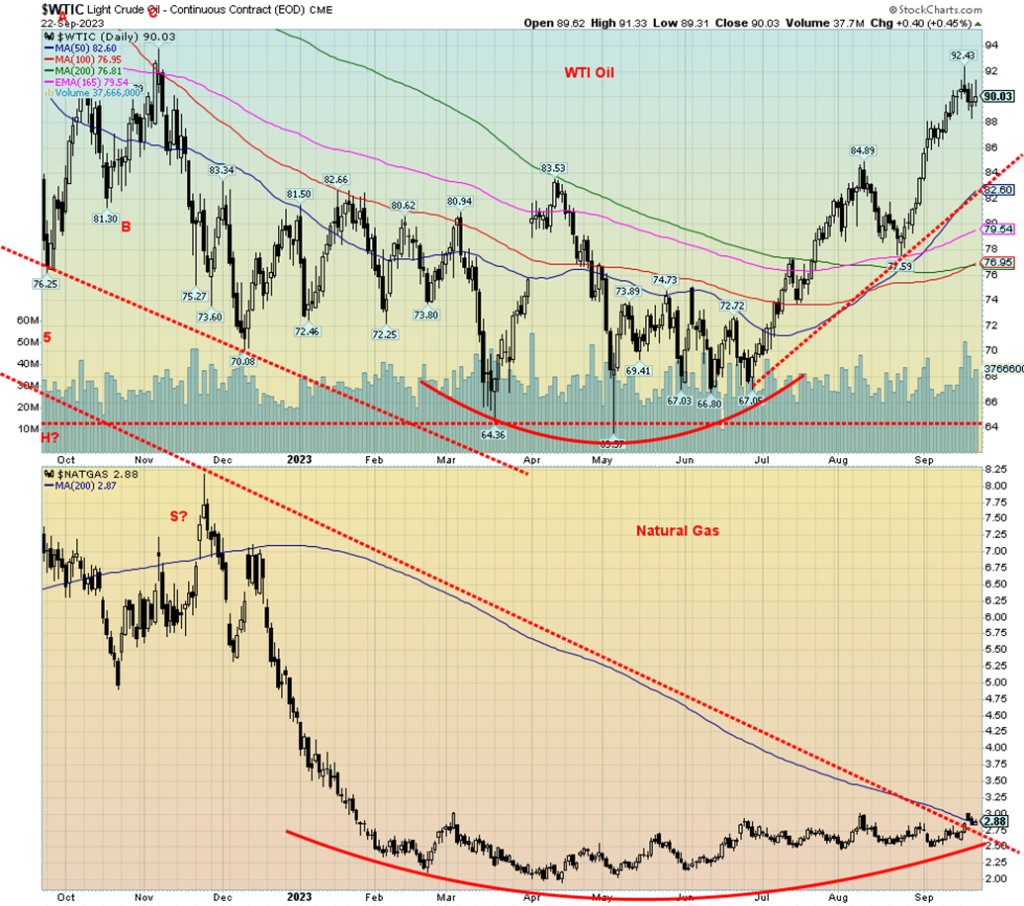
Oil prices didn’t do a lot this past week. However, they largely maintained the recent gains. WTI oil was essentially flat on the week while Brent crude actually fell 1.5%. What did happen was that Russia decided to ban fuel exports for an undetermined period. That boosted diesel prices. Europe saw a huge $45 per metric tonne day-to-day surge on its middle distillates. The rise in distillates also pushed oil prices back up after a short correction sparked by economic concerns. A reminder that the Fed is indicating rates will stay higher for longer but, led by Germany, the EU is moving into recession. Russia’s ban on exports of gasoline and diesel is aimed at all countries except for Belarus, Kazakhstan, Armenia, and Kyrgyzstan. Oil continues to be a geopolitical weapon.
There has been only minor movement in the U.S.’s stock of oil and gasoline reserves. That alone should help keep prices up as both are hovering near 5-year lows. The best movement on the week was natural gas (NG), where Henry Hub NG rose 9.1% while the EU Dutch Hub was also up 9.1%. NG did pull back late in the week when a storage build-up was reported. Nonetheless, prices at the Dutch Hub remained elevated on the week. The energy stocks seemed to ignore price gyrations and, instead, followed the broader market lower. The ARCA Oil & Gas Index (XOI) fell 2.6% while Canada’s TSX Energy Index (TEN) dropped more, down 4.4%.
Technically, WTI oil appears to be consolidating at an elevated level around $90 and NG appears to be breaking out, but it was feeble so we are not convinced it’s a real break just yet. We did get above the 200-day MA, but barely. It would look better for a breakout if we were trading consistently over $3. We suspect we’ll get there as the rounding bottom pattern is too compelling. As we go into the fall, energy prices are expected to remain elevated. Seasonally, the best period is December to June.
__
(Featured image by Behnam Norouzi via Unsplash)
DISCLAIMER: This article was written by a third party contributor and does not reflect the opinion of Born2Invest, its management, staff or its associates. Please review our disclaimer for more information.
This article may include forward-looking statements. These forward-looking statements generally are identified by the words “believe,” “project,” “estimate,” “become,” “plan,” “will,” and similar expressions. These forward-looking statements involve known and unknown risks as well as uncertainties, including those discussed in the following cautionary statements and elsewhere in this article and on this site. Although the Company may believe that its expectations are based on reasonable assumptions, the actual results that the Company may achieve may differ materially from any forward-looking statements, which reflect the opinions of the management of the Company only as of the date hereof. Additionally, please make sure to read these important disclosures.
Copyright David Chapman 2023
David Chapman is not a registered advisory service and is not an exempt market dealer (EMD) nor a licensed financial advisor. He does not and cannot give individualised market advice. David Chapman has worked in the financial industry for over 40 years including large financial corporations, banks, and investment dealers. The information in this newsletter is intended only for informational and educational purposes. It should not be construed as an offer, a solicitation of an offer or sale of any security. Every effort is made to provide accurate and complete information. However, we cannot guarantee that there will be no errors. We make no claims, promises or guarantees about the accuracy, completeness, or adequacy of the contents of this commentary and expressly disclaim liability for errors and omissions in the contents of this commentary. David Chapman will always use his best efforts to ensure the accuracy and timeliness of all information. The reader assumes all risk when trading in securities and David Chapman advises consulting a licensed professional financial advisor or portfolio manager such as Enriched Investing Incorporated before proceeding with any trade or idea presented in this newsletter. David Chapman may own shares in companies mentioned in this newsletter. Before making an investment, prospective investors should review each security’s offering documents which summarize the objectives, fees, expenses and associated risks. David Chapman shares his ideas and opinions for informational and educational purposes only and expects the reader to perform due diligence before considering a position in any security. That includes consulting with your own licensed professional financial advisor such as Enriched Investing Incorporated. Performance is not guaranteed, values change frequently, and past performance may not be repeated.


Ecobnb Turns Sustainable Tourism Into Measurable Impact
Ecobnb’s sustainable tourism platform generated significant environmental and social impact in 2025, avoiding 58,207 kg of CO₂ and adding 583...


Sugar Markets Balance Biofuel Demand and Global Supply
Sugar markets in New York and London were mostly unchanged as the Iran conflict renewed interest in biofuels. Drought concerns...


The $40 Trillion Trap: Disinflation Is Not Deliverance
U.S. debt has reached $40 trillion, with $24 billion weekly interest, while deficits accelerate. Despite disinflation in CPI, from cooling...


FinTech Matures as AI and Infrastructure Drive the Next Growth Phase
Fintech markets are entering a mature phase, shifting from rapid growth to consolidation, specialization, and sustainable business models. Zurich and...


Bitcoin, and Ethereum Rise, While Cardano Enters Transition
Bitcoin and Ethereum posted modest weekend gains, supported by ETF inflows. A new proposal may protect Bitcoin from quantum threats....
 |
|
 |  |
 |
|
-

 Impact Investing1 week ago
Italy’s Startup Ecosystem Shrinks but Becomes More Digital and Specialized
-

 Crypto2 weeks ago
Crypto Platforms Expand Stock Perpetual Trading
-

 Africa4 days ago
Senegal’s Debt Strategy: Choosing Between Restructuring and Financial Innovation
-

 Crypto2 weeks ago
SpaceX Bitcoin Move Sparks Debate Amid Market Uncertainty