Featured
Finding the bull stocks in your portfolio
Over the past few days, the stocks doubled in pricing, making the stock market overvalued. A correction is only a matter of time.

These days, the claim that the stock market is overvalued seems common sense. Unfortunately, climbing indices and aggregated numbers do not give you an idea about the current state of overvaluation in your own portfolio.
It is hard to ignore the articles about the imminent market correction. Indeed, many stocks, especially in the U.S. and the booming technology sector, reached unprecedented levels. Usually, high valuations are demonstrated using indices like Nasdaq.
That’s reasonable. But it remains abstract and does not directly relate to you because as a stock-picking investor, your portfolio is unique. In this article, I examine the valuation of my portfolio to give you an idea of how the valuation of your own portfolio can be done.
How to calculate the fair value of solid growth stocks
I invest in solid companies with stable and growing earnings, cash flows and dividends and find these companies by calculating the correlation between time and the evolution of earnings, cash flows and dividends.
In a casino, playing red on a roulette wheel 10 times in a row doesn’t help you to predict what’s coming next. But a company with increasing profits 10 times a row has a significantly higher chance of doing so next year compared to a company with a mixed earnings history.
In a competitive environment, generating profits requires effort — it doesn’t come coincidentally. Turning profits 10 years in a row is the financial manifest of an excellent business model, along with sound business processes, capable management and strong brands combined with market power.
That’s why my fair value logic for solid growth stocks is based on historical facts. To do so, I calculate averages on a 10-year timeframe (outliers removed) and use the results as multipliers.
To give you an example, if the average PE-ratio of the last 10 years was 20 and the current earnings per share is $2. The fair value is 20 x $2 = $40. Some logic applies to fair value calculation based on operating cash flow and dividends. More details about the methodology can be found here.
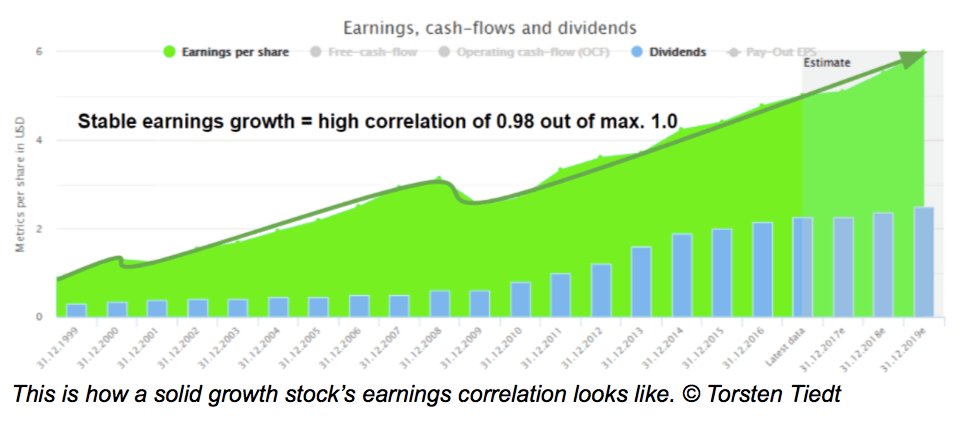
If I were investing in stocks with volatile earnings and cash flows, I would prefer a discounted cash-flow model based on estimates instead.
My portfolio
My “solid growth stocks” are international. Nearly half of them are from the U.S. The other half is from Europe except Tencent being a Chinese company.
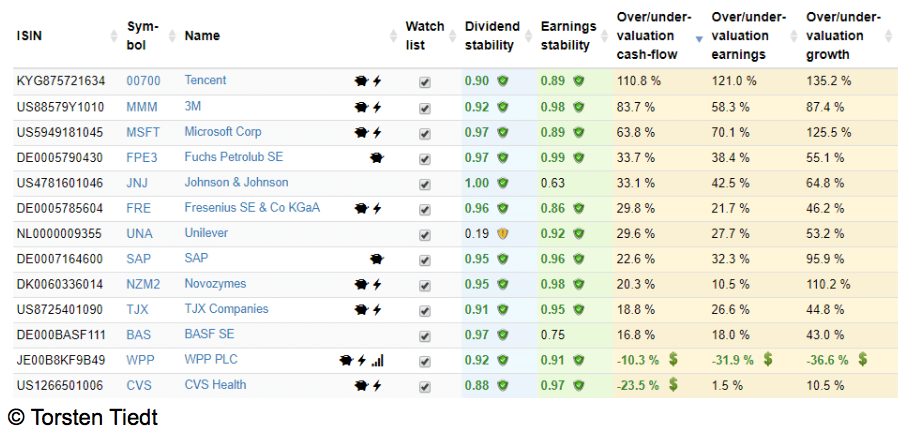
The brownish columns show the current valuation sorted descending by valuation measured using the operating cash flow. Most of the stocks are overpriced. Some to an extent of 100 percent and more. Let’s examine some of my stocks.
Tencent
Tencent is the most overvalued stock in my portfolio. The brownish stripe spans high and low price of the given year. The brown line shows the average price of the year, except the prices for latest data (also known as 12 trailing months) and estimates where the current price is shown.
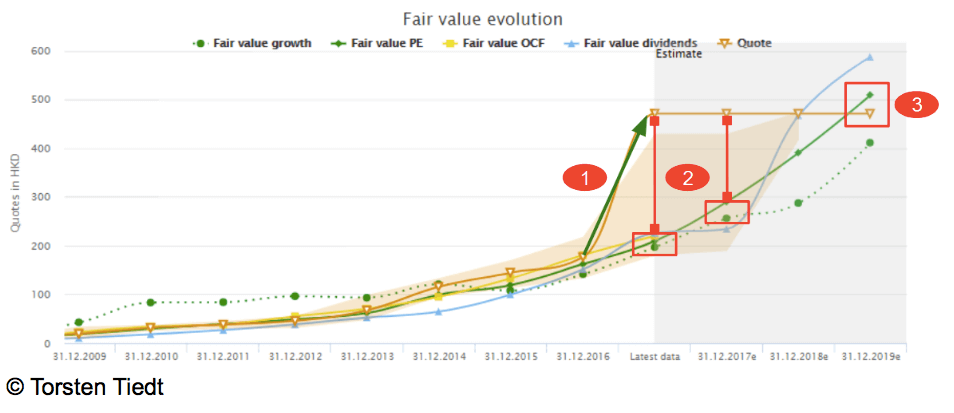
In the past, most fair values closely follow the stock price. But in 2016, the stock price explodes leaving all fair values far behind (1). The price chart now resembles an overstretched rubber band waiting to bounce back to the fair value it belongs (2).
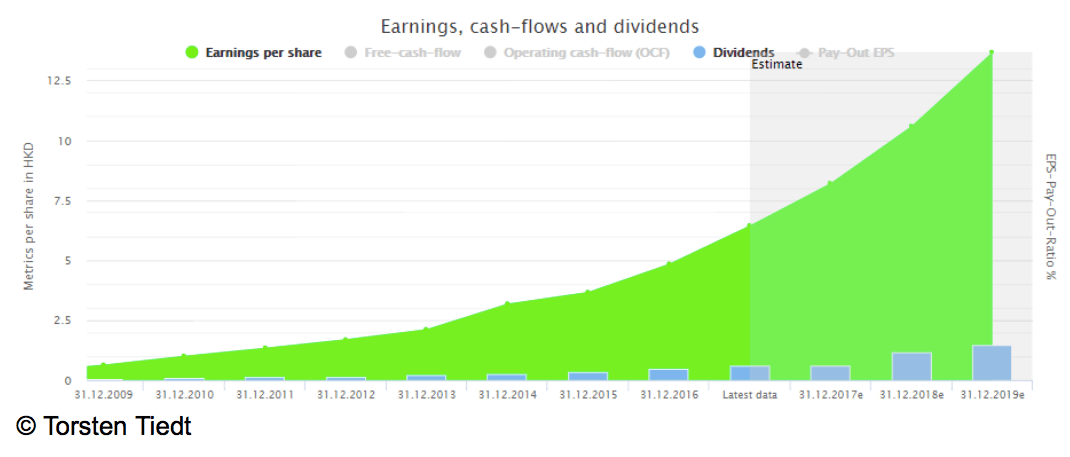
Tencent’s earnings growth rates are very high. But even if the estimated earnings realize, it will take two years until the fair value based on historic PE-ratio is reached (3). As a long-term investor, you don’t need to sell Tencent because of its high price. But you should be aware that a sudden price drop is possible.
3M
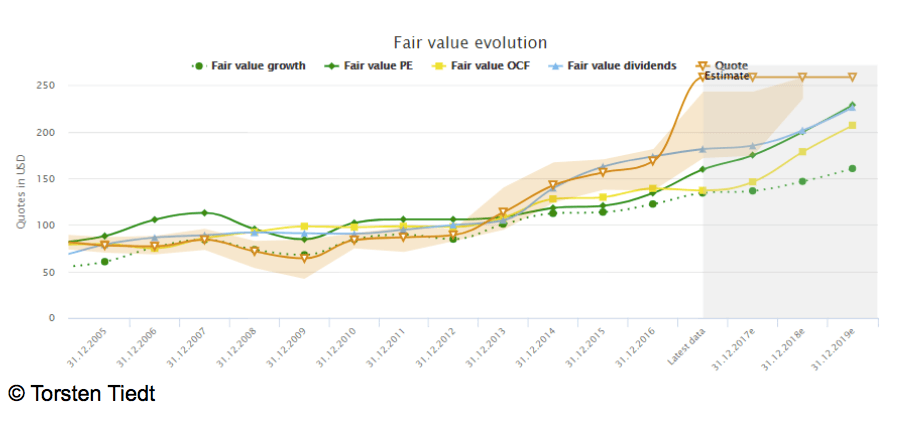
Very ambitious current valuation at Microsoft, too. Based on current price and estimates, the fair valuation will be reached in mid-2020. Regarding Microsoft, we need to consider that the company’s management is better than it was during Ballmer’s reign. This means higher valuations are partly justified.
Bargains still exist
Most stocks in my portfolio are overvalued to a certain extent. But even in bull markets, attractively priced stocks exist — even in the U.S. With L-Brands, CVS, WPP and Fresenius, my last buys were low or least moderately priced stocks. Of course, there must be a reason why these stocks aren’t higher priced. But chance-risk-ratio are often attractive, especially if it is a solid dividend stock.
Conclusion
Although it looks like the bull market continues, a sharp correction is highly probable due to current valuation levels. The weak U.S. dollar and the tax reform may delay this, but a correction will finally have to come. When this happens, you should have an idea about the current valuation of your portfolio to be prepared.
—
Note: This article was written on 29th of January. One week before the correction finally started. Images show prices and valuations at this date.
DISCLAIMER: This article expresses my own ideas and opinions. Any information I have shared are from sources that I believe to be reliable and accurate. I did not receive any financial compensation in writing this post, nor do I own any shares in any company I’ve mentioned. I encourage any reader to do their own diligent research first before making any investment decisions.

-

 Business6 days ago
The TopRanked.io Weekly Digest: What’s Hot in Affiliate Marketing [uMobix Affiliate Program Review 2026]
-

 Cannabis2 weeks ago
Spain Launches Registration Process for Standardized Medical Cannabis Preparations
-

 Biotech1 day ago
ByBug Turns Insect Larvae into Low-Cost Biofactories for Animal Health
-

 Impact Investing1 week ago
Green Bonds Take Center Stage as GSS Market Matures


You must be logged in to post a comment Login