Markets
Gauging Risk and Reward + Important Update on Barron’s CI
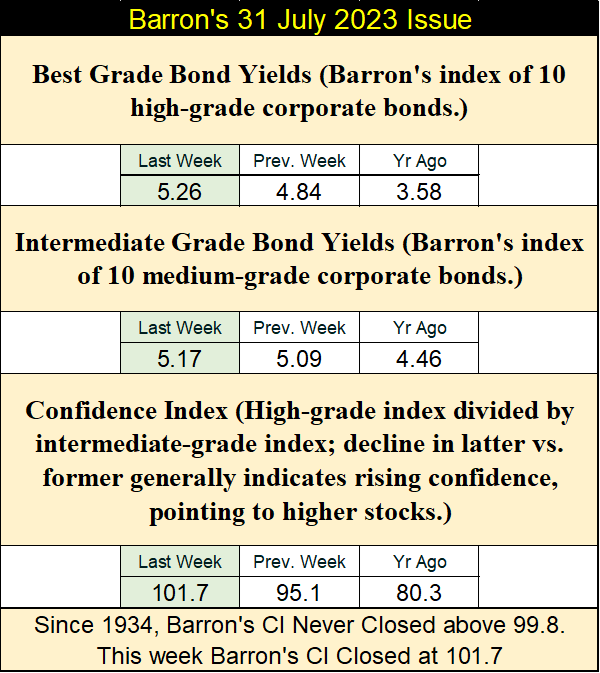
For the first time since 1934, the Barron’s Confidence Index (CI) closed above 100, reaching 101.7. This means that yields for Barron’s IG Bonds were lower than yields for their BG Bonds. The sudden change is seen as illogical and puzzling, raising the question of who, with significant funding at their disposal, influenced the corporate bond market to drive IG yields below BG yields.
Last week I covered Barron’s Confidence Index (CI), the yield spread between Barron’s Best Grade (BG) & Intermediate Grade (IG) Bonds, where I noted yields for BG were always lower, as they offered lower risks to bond holders. So, since January 1934, for the past 4,673 issues of Barron’s, their CI has * Always been LESS * than 100, with 100 indicating BG and IG yields are equal to each other.
A week later, for the first time since 1934, Barron’s CI closed above 100, at 101.7, indicating yields for Barron’s IG Bonds were lower than yields for their BG Bonds. This is not only illogical, but outright stupid, demanding a question be asked; who is the idiot(s) with massive amounts of funding at their disposal, for funding purchases in the corporate bond market, that drove IG yields below BG yields?
Below is how this looks on a chart for CI going back to 1934. Since March 2020 when the FOMC’s Idiot Primate, Jerome Powell, announced that for the first time, the FOMC would begin monetizing corporate bonds (Lower Red Circle), the CI has increased dramatically from 48.0 in Barron’s 04 May 2020 issue, to this week’s historic 101.7.
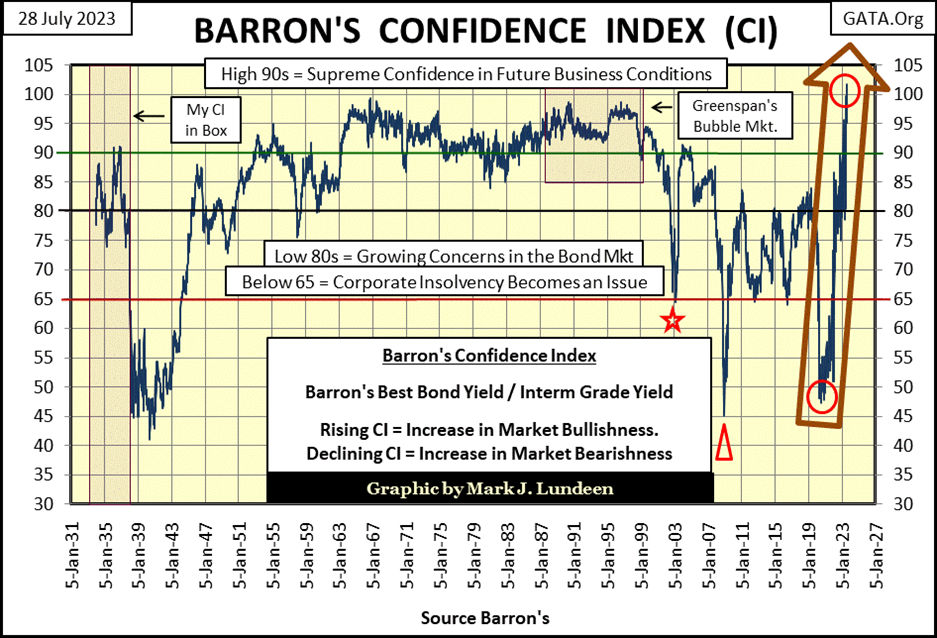
I don’t know how many billions-of-dollars (trillions?) of monetary inflation was required to achieve this phenomenal advance in the CI, to drive yields in IG bonds lower than yields for BG bonds. But in doing so, these idiots have created a historic mismatch of risk in the corporate bond market, one that must be of some consequence, somewhere in the financial system.
Though right now, I’m at a loss for words to guess exactly what, or where that may be, though I trust in due time, we’ll all discover exactly the what and the where are. Something like; without these idiots purchasing these bonds, in vast quantities, many corporate bonds now trading, would have no bids at current prices.
Could that be true? I wouldn’t doubt this possibility. Buying garbage financial assets at top dollar, to “stabilize market valuations,” is one of the hallmarks of the “policy makers’ monetary policy.”
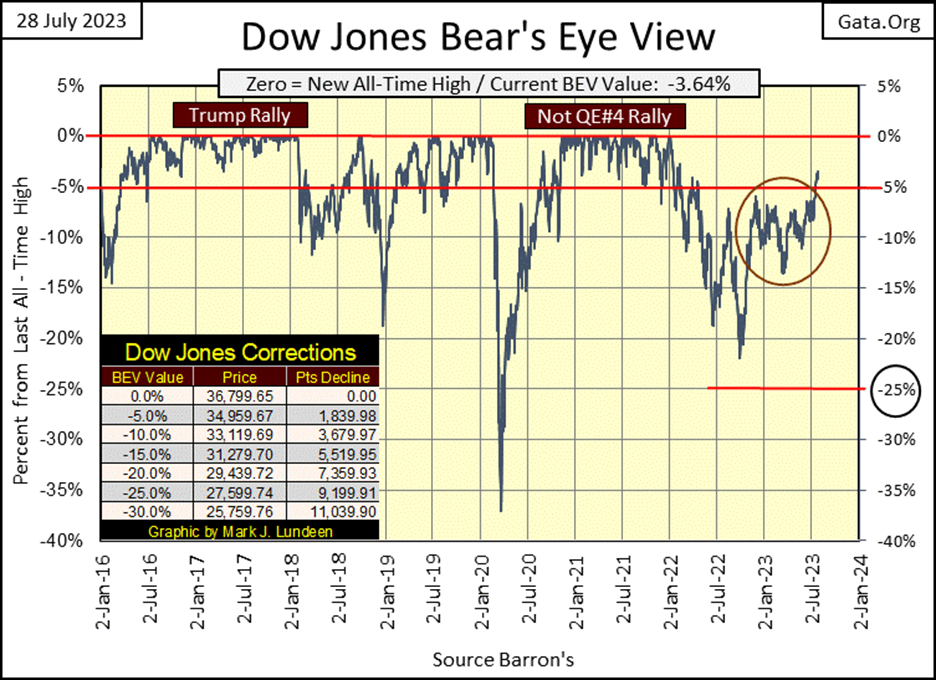
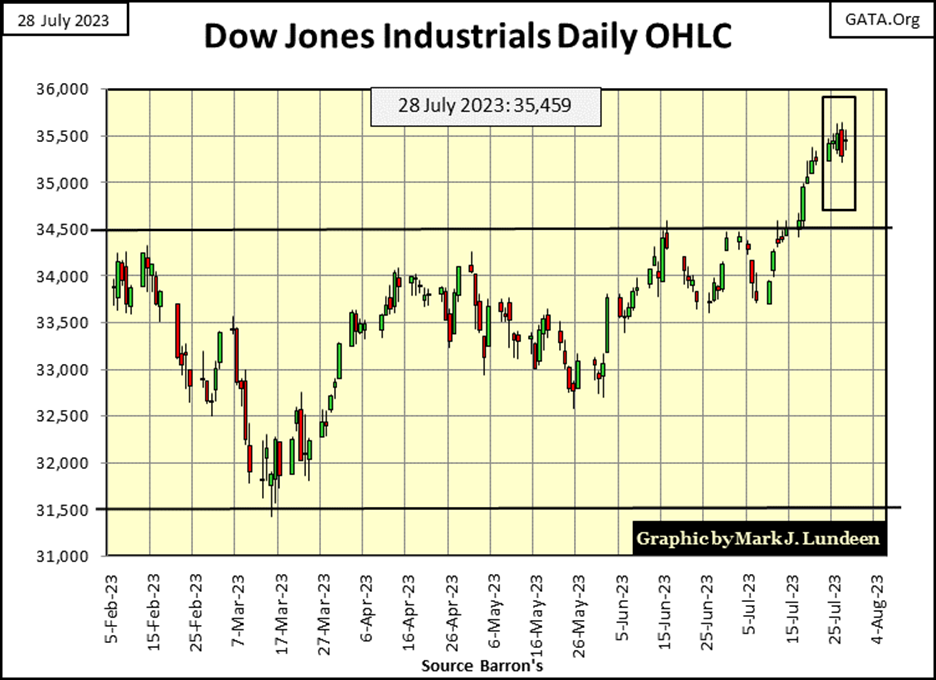
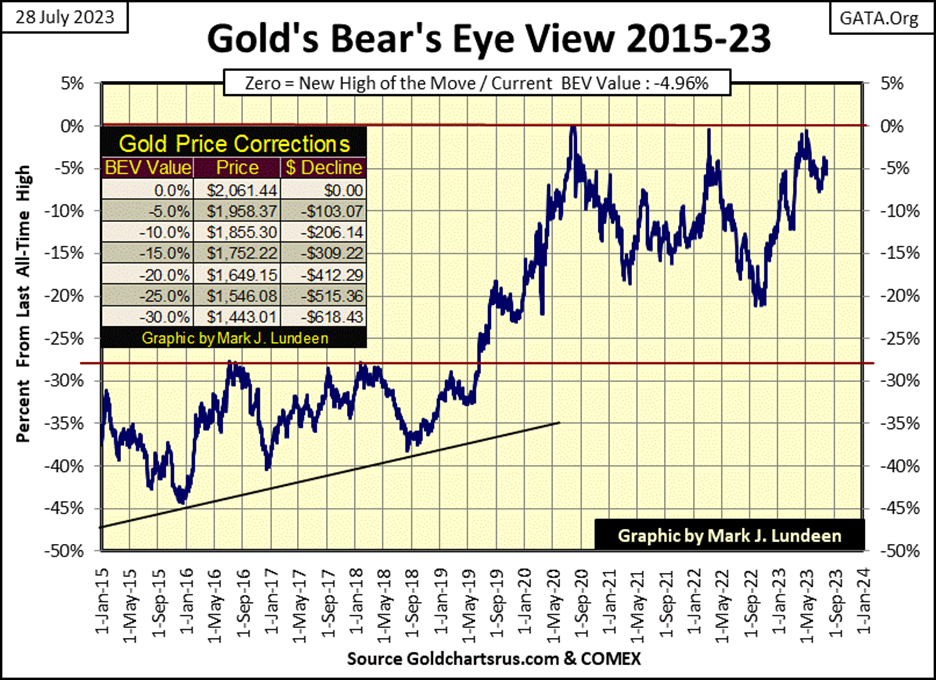
So, let’s move on to the Bear’s Eye View for the Dow Jones below. The Dow Jones has broken out of a trading range that has gone on since the spring of 2022, and is now making an effort to close at a new all-time high, a BEV Zero (0.0%) in its BEV chart below.
Will the Dow Jones break out, closing at new historic valuations? In our world dominated by idiots, where Barron’s CI can close at 101.7, anything is possible. So sure, expect the Dow Jones to be making market history in the weeks to come.
That done, the question becomes; what next? Does the Dow Jones then cut through to the 40,000s, like a hot knife through butter on its way to 50,000? Excuse me, I had to double-check this week’s CI once again. Did it really close the week at 101.7?
Geeze Louise, it really did! This makes it possible, maybe even likely, the Dow Jones will cut its way through the 40,000s, like a hot knife through butter, as it then does a quantum-leap to the 60,000s, skipping the 50,000s altogether. Stranger things have happened, like seeing Barron’s CI close this week above 100.
But until the Dow Jones does see its quantum leap to 60,000, maybe it’s best to keep the discussion to what we see below in the Dow Jones daily bar chart. Well, it’s sort of boring. Last week saw a good thrust towards new all-time highs, but this week the Dow Jones lost a little of that momentum. Still, the Dow Jones upward trend remains intact.
And what would be a new all-time high for the Dow Jones? A close above its last all-time high of 04 January 2022; 36,799.65, only 1,340 points away from this week’s close. I’m thinking this will happen, but I know the market is a fickle mistress; so, I’m not holding my breath until it does.
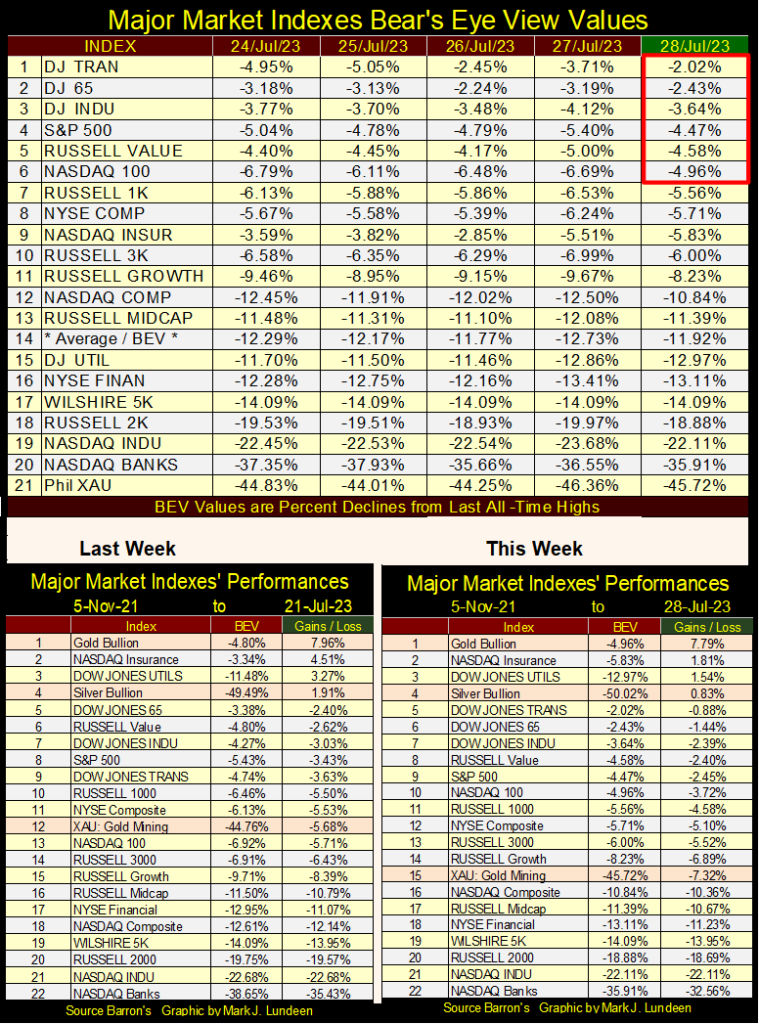
At this week’s close, six of the major market indexes I follow below, closed in scoring position; a BEV value of something less than -5%, but short of a BEV Zero; BEV values of -0.01% to -4.99%.
Why is this range of BEV values called scoring position? Look at the Dow Jones BEV chart above. During the Trump, and again during the NOT QE#4 Rallies, both lasting longer than a year, not every day in these rallies saw the Dow Jones close at a new all-time high (0.0%). More frequently, during these rallies the Dow Jones closed in scoring position (BEVs of -0.01% to -4.99%), before the Dow Jones once again made a new all-time high, in its BEV chart above.
So, seeing an increasing number of indexes below close in scoring position, is a necessary pre-condition for the market to once again begin a rally. That done, these indexes must then begin generating new BEV Zeros (0.0% = new all-time highs).
However, the ball is now on the bulls’ side of the court, and I think the bulls lack the necessary drive to return the ball back over to the other side of the net, with the required enthusiasm, to make Wall Street once again an exciting place to be.
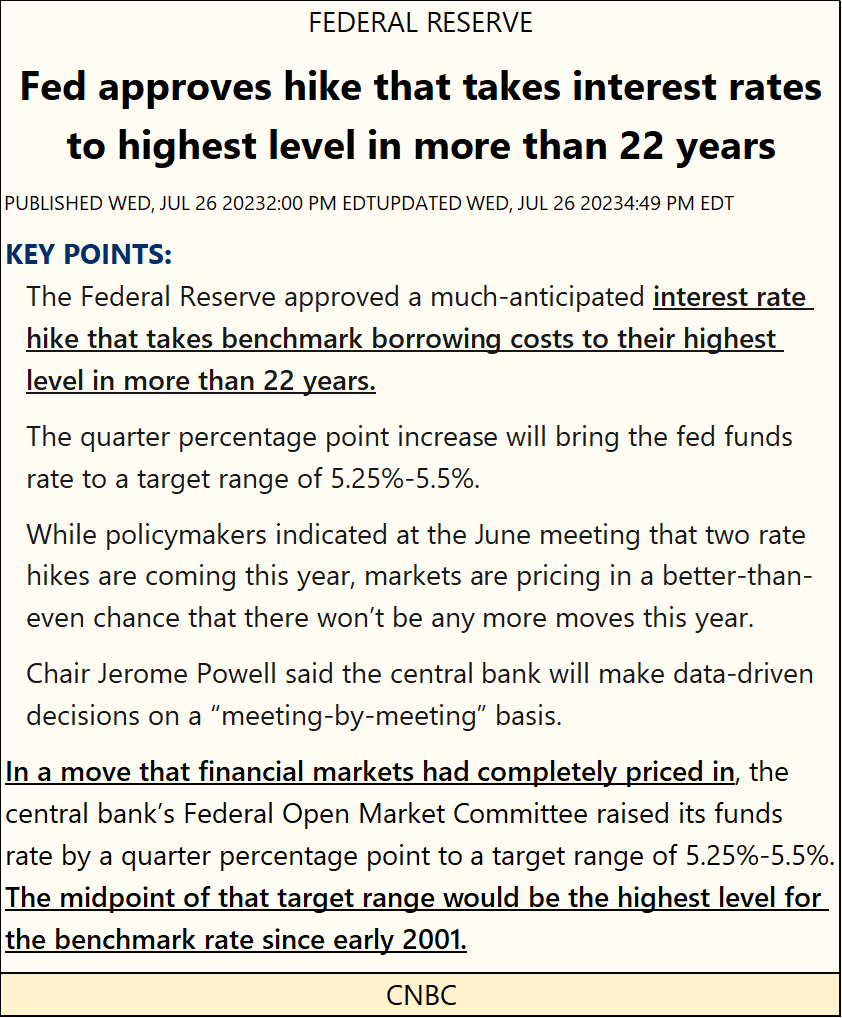
One problem the bulls have, the FOMC continues raising their Fed Funds rate.
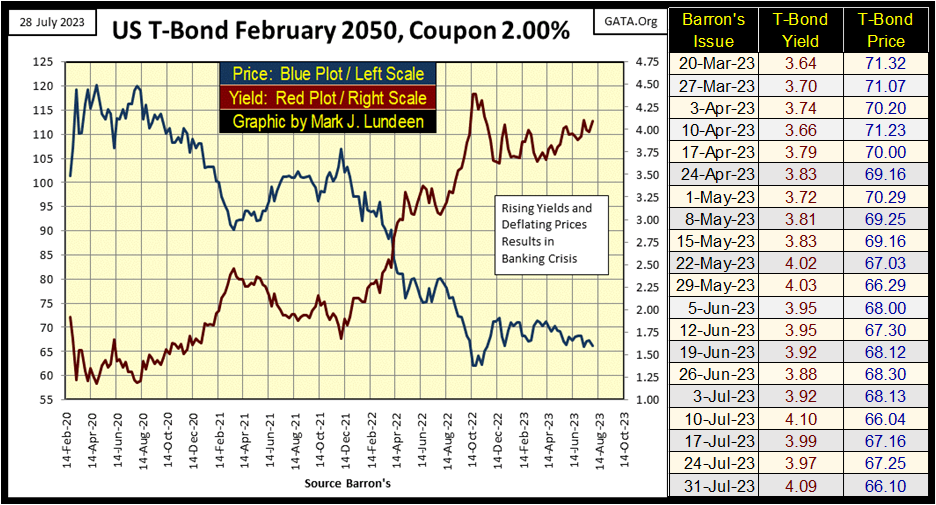
At week’s close, the yield curve remained very inverted (chart below, Red Plot). Inverting the yield curve as seen below, is never bullish for the stock market. When I look at this week’s yield curve, I’m not thinking bull market at the NYSE. I’m thinking recession in the economy, and deflating valuations at the NYSE.
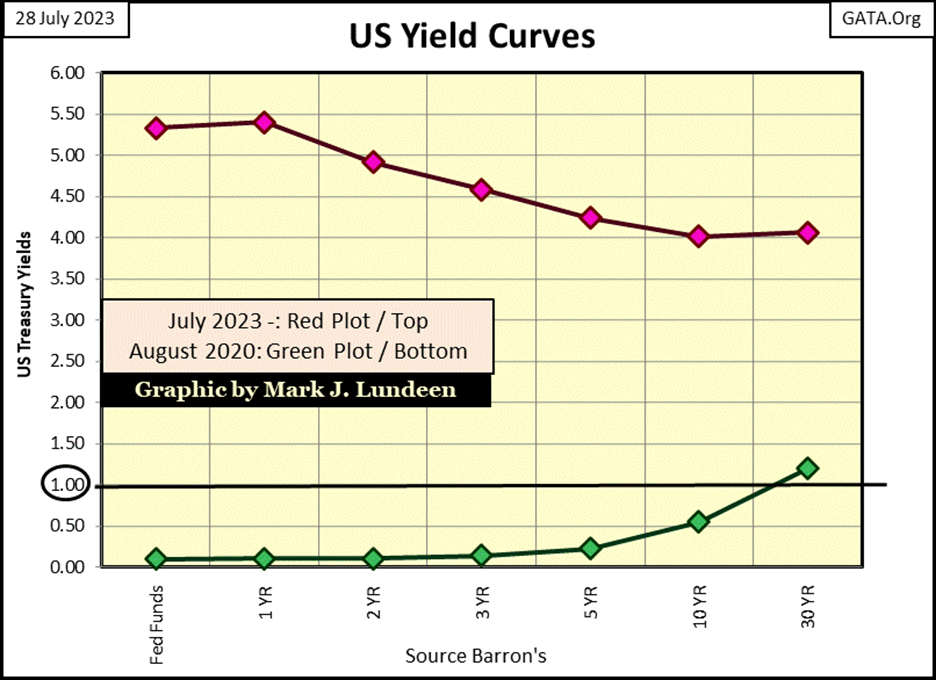
Yields in the Treasury market continue rising (valuation continue deflating). This 30Yr T-Bond plotted below was issued in February 2020. Since its highs of August 2020 (Green Yield Curve above), its valuation (Blue Plot below) has deflated by 45%, as its yield has increased from 1.19%, to 4.09% at the close of this week.
With the Swamp Creatures now dominating Washington DC, committed to issue ever more T-debt in the years to come, by the trillions-of-dollars, there is nothing for this bond to do, but to see its yield rise to ever higher levels, as its future valuation deflate to levels now unknown.
If you can, keep your distance from all US dollar denominated debt. You’ll be hurt if you can’t.
It’s only a matter of time before a panic once again strikes the American debt markets. Expect CNBC to once again provide commercial-free, primetime TV for Washington’s Swamp Creatures, and the idiots from the FOMC, to discuss in front of the voting public, how best to once again “stabilize” the financial markets, as they did in October 2008 during the sub-prime mortgage debacle, a debacle they created.
Expect their key to “stabilize” the pending crisis, will be the necessity of allowing the idiots at the FOMC to implement a digital currency, which the Swamp Creatures will be more than happy legislate into reality. We don’t need a crystal ball to see that one coming.
Good Grief, this is all so depressing. I feel like ending this week’s article right here. But this is a good time to look at the risks and rewards found in the market, so here it is below.
Risk and reward, correctly gauging these two market variables, and the chances of an investor becoming a successful investor will increase greatly. Investing is not a simple game. People buy something in the market, hoping to turn a dollar into two, and maybe they will, and then maybe they won’t.
There have been times when investing in a great company, with unlimited potential proved to be ruinous, and times investing in a real dog of a company ended up with huge gains. How is one to identify one situation from the other? How best to improve your odds in this game-of-chance called investing, is by estimating when risks are minimum, and chances of rewards are maximum.
Investors need to start with discovering when risking money offers the best chance of making money, and more importantly; knowing when risking money offers almost no chance for making a profit. At such times, investors have best be out of the market.
Being a simple sort of guy, I like keeping things simple by looking at the obvious; looking at the Dow Jones from 1924 to 1986 in the chart below.
Here are the mechanics for gauging risks and rewards in the stock, or any other market. At market tops;
- risks are maximum,
- potential for rewards are minimum.
At market bottoms;
- risks are minimum,
- potential for rewards are maximum.
Looking at the above undeniable truth, people will say “don’t be stupid, of course this is obviously true.” But few people invest according to what is stated above. If they did, they’d be out of this market!
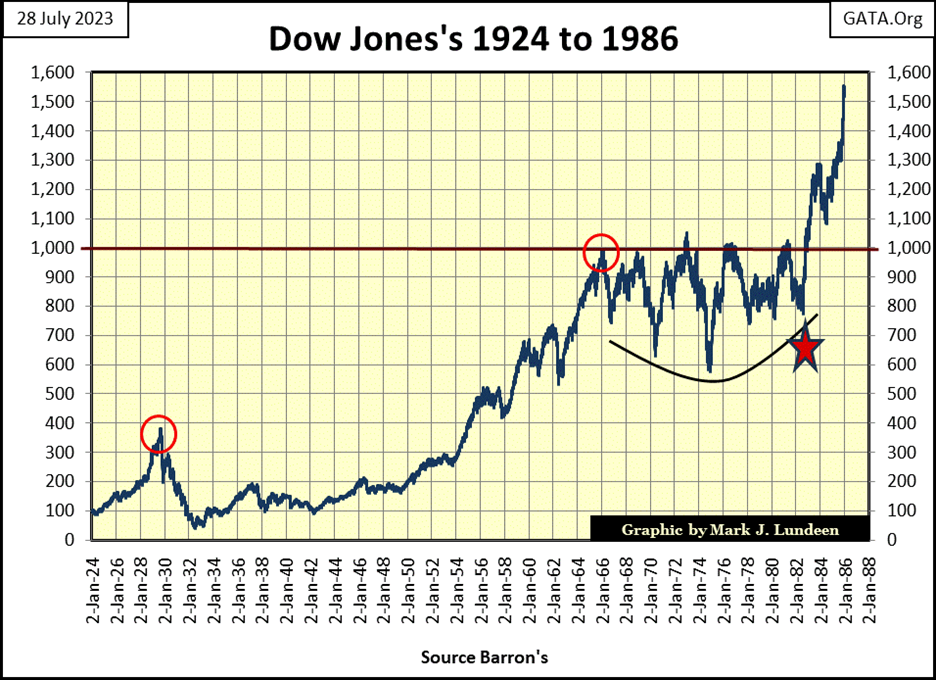
In the chart below, from January 1924 to September 1929, Wall Street saw the Roaring 1920’s Bull Market, where the Dow Jones soared 298% in a little more than five years. Since 1885, the Dow Jones had never seen such a gain in only five years. That is obvious in the chart below. What isn’t obvious in the chart below, is the public’s attitude of risking their money in the stock market in January 1924 compared to September 1929.
In January 1924, the public was out of the stock market, for the good reason the Dow Jones was still recovering from a 47% bear market bottom from August 1921. As seen below, in 1924 money was coming into the stock market, inflating valuations in share prices, which slowly, but surely caught the attention of the public. As the Dow Jones’ valuation increased, the risks of investing in the stock market approached maximum, as the prospects for making a profit diminished, becoming zero at the ultimate top of the bull market.
As 1929 began, what people refused to purchase for $95 five years earlier (the Dow Jones), they were eager to pay over $250 for. As the Dow Jones approached its 1920’s last all-time high on 03 September 1929: $381.17, investors became fully committed to the Bull Market on Wall Street, as market risks became maximum, and the potential for reward went to zero!
It wasn’t just retail investors who became fully committed to the bull market at its 1929 top. Irving Fisher, leading economist at Yale University, and the top “market expert” of the 1920s, said the following just six days before the market crashed:
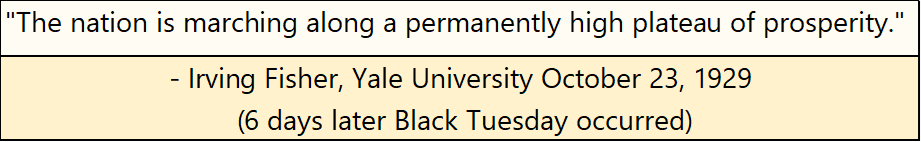
No doubt seven days later, Professor Fisher regretted saying that! But being a “market expert” has its own risks. However, from the Dow Jones’ market top of September 3rd 1929, down to its 89% bear market bottom on July 8th 1932, as each dollar of its valuation was clawed back by Mr Bear on its way to the bottom, market risk was being reduced, as the potential for profit was increasing.
How was that? Simple. For someone who bought at the September 1929 top, $381, the Dow Jones didn’t see $381 again until 23 November 1954. The September 1929 investor only broke even after twenty-five years. Using the 23 November 1954 as a common end point, buying at the July 1932 bottom (41.22) had little market risk, while its potential for reward was greatly expanded. Buying at the July 1932 bottom, returned 924% for the bear-market bottom feeder by November 1954.
So, what can investors in 2023 learn from the 1920s? First of all, and most importantly, that market psychology is perverse. Investors, as a group tend to avoid the market when risks are low, and the possibility for profits are high, as in January 1924, or even better in August 1921, at the 47% bottom for the Dow Jones.
What investors, and “market experts” favor are market tops, when risks are maximum and the possibility for making a profit are minimum. This is a pattern played over and over on Wall Street.
On July 8th 1932, at the bottom of an 89% bear market for the Dow Jones, the greatest buying opportunity in stock-market history, there were few buyers. That Mr Bear wiped out most personal wealth in the past three years didn’t help. But at the bottom of the Great Depression Crash, where less than $0.10 could purchase what was selling for over $1.00 a few years before, there were few takers. Yes, market psychology is perverse.
Let’s keep this short, and look at the gains in the Dow Jones from 08 July 1932 (41.22) to the 09 February 1966 top (995.15), a thirty-four-year advance of 2414% in the Dow Jones. The 1966 market top wasn’t a mania, like the 1929 top clearly was, but it was still a time when investors should have kept their money from the stock market. Why? Look at the Dow Jones Dividend Yield below.
Dividend yields for the Dow Jones works the same as for bonds; rising dividend yields = declining valuations for the Dow Jones. Or, high dividend yields = low share prices (good times to buy), while low dividend yields = high share prices (good times to exit the market).
From 1960, to January 1973, the Dow Jones dividend was yielding between 3% to 4.9%, far from the traditional 6% yield that signaled a strong buy. From 1966 to the early 1980s, five times the Dow Jones failed to get above, and then stay above 1000. Then in July 1982, when the Dow Jones dividend yield increased to 7.01%, a bull market began in the Dow Jones, a bull market that continues to this day.
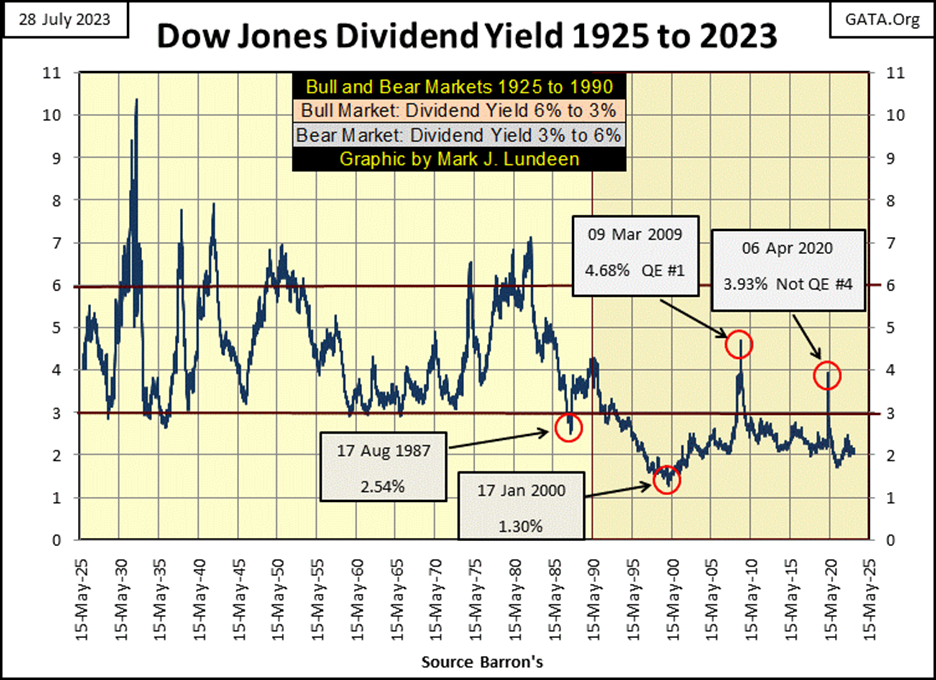
But this four-decade long bull market is one odd duck, when we compare the Dow Jones dividend yield before 1987, when Alan Greenspan became the Idiot Primate of the FOMC, and after. Before Greenspan, seeing the Dow Jones’ dividend yield decline to 3% signaled the start of a bear market. After Greenspan, the Dow Jones’ dividend yield since 1993 has never increased to something above 3%, except during the sub-prime mortgage crisis, and the March 2020 flash crash.
So, a Dow Jones dividend yield of 3% no longer signals a market top, a time to sell. Since 2008, seeing the Dow Jones dividend yield 3% or more is an indication the idiots at the FOMC are going to implement a new episode of Quantitative Easing to “stabilize” market valuations.
This week, the Dow Jones closed with a dividend yield of 2.01%. Watch what happens when the Dow Jones once again yields something over 3%.
I am no “market expert” like Professor Irving Fisher of Yale University. And to be honest with everyone, it’s important for my readers to know who it is that is writing all this market stuff above. I graduated from high-school, and I must admit not at the top of my class. I then went to sail the seven seas for twenty years, as an electrician on US Navy ships. But I’m a serious student of the market, and I’ve spent many years studying markets, because markets are my passion.
From my market research, as seen above, data you’ll see nowhere else, seeing the Dow Jones yielding only 2.01% at this week’s close, tells me this market is pregnant with risk, with Mr Bear eager to provide the midwifing services, when the gestation comes to term.
This is a market with little possibility of reward for anyone who dares risk their money in it. This will be true until the Dow Jones’ dividend is yielding something over 6%, better yet, something over 7%.
And what would a 7% dividend yield mean for the Dow Jones? The current dividend payout for the Dow Jones is $712.73. Divide that by a 7% yield (0.07), and that fixes the Dow Jones at 10,181, a 72.3% market decline from the Dow Jones last all-time high of 36,799.
It could get worse. Unlike bonds, stocks are not fixed income. Corporate management can increase, or cut their dividend payout as they see necessary. Without the permission of the company’s shareholders, a company’s management could eliminate their dividend program, reducing their dividend payout to zero.
During the coming bear market decline, seeing the current Dow Jones payout of $712.73 cut in half to $356.36, or more is possible. Using that as a payout, with a 7% yield, and the reduction in the Dow Jones goes down to 5,090, an 86% bear market decline in the Dow Jones from its last all-time high of 36,799.
Is an 86% bear market likely? Before 1970, it would not be. Way back then, corporate management, and their government regulators, still had living memories of the Great Depression, so they were fully aware that stupidity in finance had consequences.
But corporate American is now controlled by Baby Boomers, all born after 1946. My generation’s memories of the financial system are one of a continuous bull market, where stupidity in finance was rewarded with a government bailout, by a Federal Government also dominated by Baby Boomers.
Because no one was ever concerned that such a massive bear market was even possible, and I’m talking about the big banks, their government regulators, and Washington’s elected officials, I think such a massive market decline is unavoidable. If for no other reason; than shit can be piled only so high, even if the shoveler has an MBA from Harvard.
Unavoidable because, free from all concerns their greed could have massive consequences, using the unlimited credit flowing from the FOMC, they did some incredible stupid things, and then bound their stupidity to the balance sheets of private individuals, corporations, and yes even the balance sheet of the Federal Government.
When this bubble pops, it will send shock waves throughout the economy that will be long remembered, as are the shock waves from credit defaults from the Depressing 1930s. Counterparty failure will once again become a topic at family gatherings.
That is what makes gold and silver bullion such good investments in the 2020s; they have no counterparty risk, no risk of default. So, what did gold do this week? Like the Dow Jones, gold too closed the week in scoring position, but generated little excitement doing so.
So, what is gold and silver’s problem? What they need to begin their blastoff into market history – is the money now circulating in the stock, bond and real estate markets. And that is how it most likely will stay, until Mr Bear begins savaging Wall Street with some massive claw backs in valuations. Until then, take advantage of the precious metal markets, by buying them at their current, government subsidized low prices.
Gold in the step sum table below saw a 15-count of +7 last week, and sold off a bit following that. One positive thing to keep in mind about gold, the bulls have so far refused to allow it trade below $1900. And since July 19th when it saws its 15-count of +7, more times than not, gold closed in scoring position.
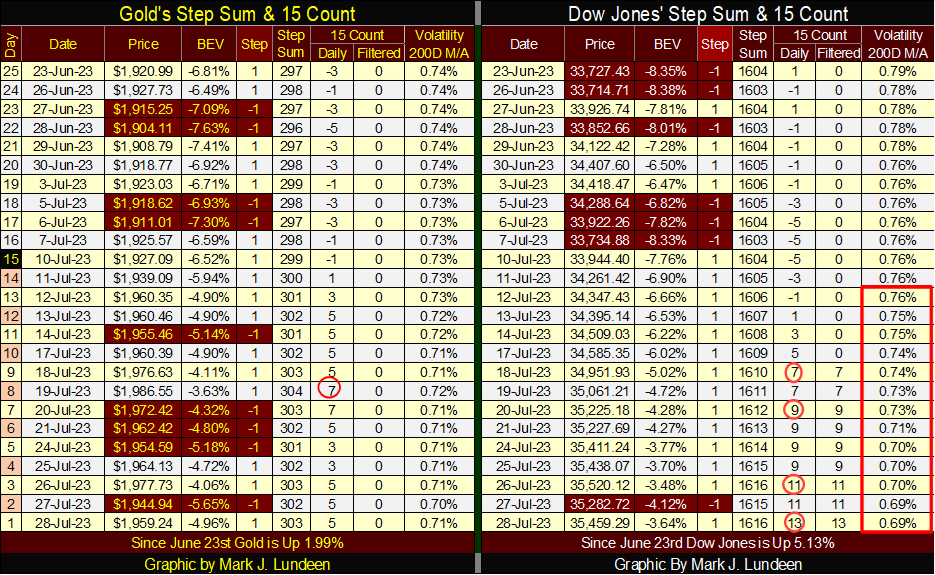
The Dow Jones’ 15-count is this week’s big item. It went from a 15-count of +7 on July 18th, to a 15-count of +13 at this week’s close – wow! In the table below, since 31 December 1970 (13,217 NYSE Trading Sessions) the Dow Jones has closed with a 15-count of +13 on only six of those 13,217 trading days.
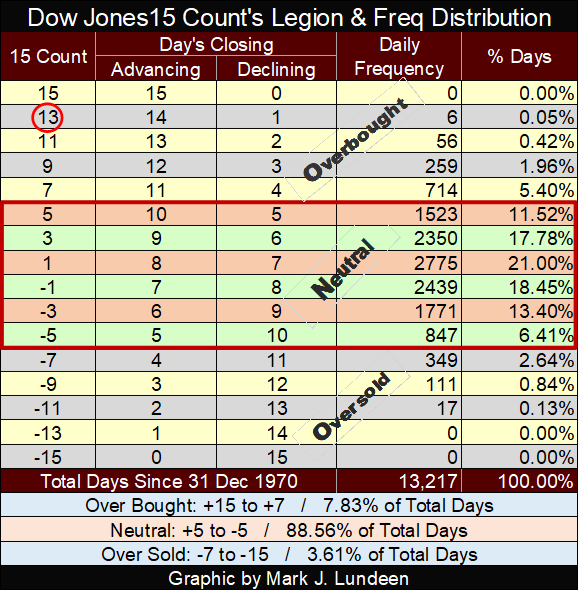
Is the Dow Jones overbought? It seems to me it is, but then Barron’s CI closed the week at 101.7, so who knows what in the hell is going on? I haven’t a clue of what will come from this +13, 15-count. I would think a big pullback in the stock market – but?
Geeze Louise, look at daily volatility for the Dow Jones, in the past three weeks it collapsed from 0.76% down to 0.69% at weeks close. It won’t go down to 0.0%. Somewhere below is a bottom, a bottom when reached may result in an explosion in market volatility in the Dow Jones, which is never good for the bulls. This is something to keep our eyes on.
Some news on Eskay Mining. Here is a video discussing several exploration companies. Eskay Mining begins at 54.44 minutes into the podcast, but just click on the link below and you’ll go right there.

__
(Featured image by Nataliya Vaitkevich via Pexels)
DISCLAIMER: This article was written by a third party contributor and does not reflect the opinion of Born2Invest, its management, staff or its associates. Please review our disclaimer for more information.This article may include forward-looking statements. These forward-looking statements generally are identified by the words “believe,” “project,” “estimate,” “become,” “plan,” “will,” and similar expressions. These forward-looking statements involve known and unknown risks as well as uncertainties, including those discussed in the following cautionary statements and elsewhere in this article and on this site. Although the Company may believe that its expectations are based on reasonable assumptions, the actual results that the Company may achieve may differ materially from any forward-looking statements, which reflect the opinions of the management of the Company only as of the date hereof. Additionally, please make sure to read these important disclosures.


Ecobnb Turns Sustainable Tourism Into Measurable Impact
Ecobnb’s sustainable tourism platform generated significant environmental and social impact in 2025, avoiding 58,207 kg of CO₂ and adding 583...


Sugar Markets Balance Biofuel Demand and Global Supply
Sugar markets in New York and London were mostly unchanged as the Iran conflict renewed interest in biofuels. Drought concerns...


The $40 Trillion Trap: Disinflation Is Not Deliverance
U.S. debt has reached $40 trillion, with $24 billion weekly interest, while deficits accelerate. Despite disinflation in CPI, from cooling...


FinTech Matures as AI and Infrastructure Drive the Next Growth Phase
Fintech markets are entering a mature phase, shifting from rapid growth to consolidation, specialization, and sustainable business models. Zurich and...


Bitcoin, and Ethereum Rise, While Cardano Enters Transition
Bitcoin and Ethereum posted modest weekend gains, supported by ETF inflows. A new proposal may protect Bitcoin from quantum threats....
 |
|
 |  |
 |
|
-

 Crowdfunding6 days ago
Insight Foto Festival Launches €4,500 Crowdfunding Campaign to Support 2026 Edition
-

 Africa2 weeks ago
UCITS Funds Drive Casablanca Market Activity in Q1 2026
-

 Business1 day ago
Dow Jones’ Record Run Faces Early Signs of Potential Shift
-

 Business1 week ago
Jobs Cooling Fast as a Cautious Fed Leaves Markets Without a Safety Net