Markets
GDP Slips as Sticky Inflation and Weak Sentiment Cloud U.S. Outlook
U.S. GDP showed -0.5% growth despite stronger sales and higher consumer spending. Q1 was -3.2%, leaving first-half growth at 1.65%, just above yearly expectations. Net exports boosted GDP, but consumer sentiment weakened. Inflation remains sticky with PCE at 2.7%. Markets faltered, gold rose, and jobs data face uncertainty amid BLS turmoil.

The Q2 GDP growth surprised to the upside, coming in at 3.8% vs. the expected 3.3% and Q1 negative 0.5% growth. Sales came up 7.5% vs. an expected 6.8% and Q1 negative 3.2%. Why the big difference? The difference was two-fold. Consumer spending rose more than expected. And there was a larger than expected decline in imports, even as there was also a decline in exports.
However, the contribution to GDP is determined by the net exports and, net, they were up more than expected. In looking at this, combined with the Q1 negative growth, the first half’s growth was only 1.65%, which is just above the expectation for the year of 1.4%. As to sales, they were up 2.15% for the first half as Q1 fell 3.2%.
GDP numbers are from the Bureau of Labour Statistics (BLS), the same group that provides the labour numbers. As we know, President Trump fired the head of the BLS, given he was upset with the big downward revisions and lower than expected nonfarm payroll growth. We’re still awaiting the appointment of a new full-time head.
The September nonfarm payrolls and unemployment rate are expected this coming week on October 3. At least, that’s the plan. The expectation is anywhere from 39 thousand to 70 thousand jobs in September with a steady unemployment rate of 4.3%. Given the turmoil at the BLS, we can only hope these numbers do come out on time and are not suspicious given the turmoil at the BLS and possible political interference.
Did the week go as planned? Stocks faltered after making all-time highs again, gold soared, the US$ Index was up small and bond yields rose. The GDP growth was better but underneath it’s not so great as consumer confidence continues to fall.
GDP Growth Rate, GDP Sales Quarter to Quarter 2015–2025
PCE Prices
PCE Prices, Core PCE Prices, Fed Rate, 10-year US Treasury Note 2015–2025
PCE prices came in mostly as expected. The PCE Price Index was 2.7%, as expected, but up from 2.6% in August. Core PCE prices were 2.9%, again as expected, unchanged from August. All this points to inflation remaining sticky. As noted in the chart, both the Fed rate at 4.25% and the 10-year U.S.
Treasury note at 4.18% remain above the PCE prices. The Fed puts more emphasis on the PCE price index than the CPI Index and the PPI index. Nonetheless, PCE prices continue to rise rather than go down. Stagflation? They haven’t claimed that to be the case yet, but that’s how it’s looking. Lowering rates does nothing for inflation and may actually force inflation higher.
Consumer Sentiment
Michigan Consumer Sentiment 2015–2025
The final September Michigan Sentiment Index came in at 55.1, below the previous August report and below the consensus of 55.4. Consumer sentiment continues to be in the dumps, down around where it was during the 1980–1982 recession and the 2007–2009 Great Recession. And we are not even in an official recession. The 5-year inflation expectations keep rising, last at 3.7%; they’re up from August’s 3.5% but below the consensus of 3.9%.
Consumers continue to expect inflation to rise. That’s interesting as personal income for September rose 0.4%, above the expected 0.3% but unchanged from August. Personal spending, however, rose 0.6% above the expected 0.5% and above August’s rise of 0.5%. Spending continues to be good despite weakening consumer sentiment. And that shows up in the GDP numbers where consumer spending was higher than expected.
The Shutdown
There is the possibility of a government shutdown by September 30/October 1 if the funding bill isn’t resolved by that time. Right now, it is a staring contest. The bill needs 60 votes to pass in the Senate; therefore, seven Democrats need to join the Republicans to make it happen. Otherwise, they would need to agree to a stopgap funding bill. One of the biggest issues is healthcare where the Republicans are tearing it apart and the Democrats aren’t budging. President Trump refuses to negotiate with the Democrats, making things even worse. If they fail to agree, the result could be mass firings.
Non-essential operations would stop but ongoing things like Social Security/Medicare and defense would continue. Even a stopgap bill would only carry them until November 24. At this point a stopgap bill appears to be the only thing that will keep things going. The government budget deficit currently is closing in on $2 trillion, representing some 6.3% of GDP, the highest in the G7. The U.S. federal debt at $37.5 trillion is the largest government debt in the world. Higher deficits usually translate into higher inflation.
U.S. Government Spending and U.S. Budget 2015–2025
Markets & Trends
| % Gains (Losses) Trends | ||||||||
| Close Dec 31/24 | Close Sep 26/25 | Week | YTD | Daily (Short Term) | Weekly (Intermediate) | Monthly (Long Term) | ||
| S&P 500 | 5,881.63 | 6,643.70 (new highs) * | (0.3)% | 13.0% | up | up | up | |
| Dow Jones Industrials | 42,544.22 | 46,247.29 (new highs) * | (0.2)% | 8.7% | up | up | up | |
| Dow Jones Transport | 16,030.66 | 15,730.52 | 0.8% | (1.0)% | up (weak) | neutral | up | |
| NASDAQ | 19,310.79 | 22,484.07 (new highs) * | (0.7)% | 16.4% | up | up | up | |
| S&P/TSX Composite | 24,796.40 | 29,769.28 (new highs) * | flat | 20.4% | up | up | up | |
| S&P/TSX Venture (CDNX) | 597.87 | 933.95 (new highs) | 3.2% | 53.2% | up | up | up | |
| S&P 600 (small) | 1,408.17 | 1,446.73 | (0.6)% | 2.7% | up | up | up | |
| MSCI World | 2,304.50 | 2,791.18 | (0.9)% | 21.1% | up (weak) | up | up | |
| Bitcoin | 93,467.13 | 109470.25 | (5.2)% | 17.1% | down | up | up | |
| Gold Mining Stock Indices | ||||||||
| Gold Bugs Index (HUI) | 275.58 | 604.46 (new highs) | 4.6% | 119.3% | up | up | up | |
| TSX Gold Index (TGD) | 336.87 | 724.63 (new highs) * | 4.2% | 115.1% | up | up | up | |
| % | ||||||||
| U.S. 10-Year Treasury Bond yield | 4.58% | 4.18% | 1.2% | (8.7)% | ||||
| Cdn. 10-Year Bond CGB yield | 3.25% | 3.23% | 0.9% | (0.6)% | ||||
| Recession Watch Spreads | ||||||||
| U.S. 2-year 10-year Treasury spread | 0.33% | 0.53% | (3.6)% | 60.6% | ||||
| Cdn 2-year 10-year CGB spread | 0.30% | 0.73% | flat | 143.3% | ||||
| Currencies | ||||||||
| US$ Index | 108.44 | 98.14 | 0.5% | (9.5)% | up | down | down | |
| Canadian $ | 69.49 | 0.7171 | (1.1)% | 3.2% | down | up | neutral | |
| Euro | 103.54 | 117.01 | (0.4)% | 13.0% | neutral | up | up | |
| Swiss Franc | 110.16 | 125.31 | (0.3)% | 13.8% | up (weak) | up | up | |
| British Pound | 125.11 | 134.04 | (0.5)% | 7.1% | down | up | up | |
| Japanese Yen | 63.57 | 66.88 | (1.0)% | 5.2% | down | neutral | down (weak) | |
| Precious Metals | ||||||||
| Gold | 2,641.00 | 3,767.88 (new highs) * | 2.3% | 42.7% | up | up | up | |
| Silver | 29.24 | 46.19 (new highs) | 7.4% | 58.0% | up | up | up | |
| Platinum | 910.50 | 1,588.10 (new highs) | 12.1% | 74.4% | up | up | up | |
| Base Metals | ||||||||
| Palladium | 909.80 | 1,285.50 | 11.4% | 41.3% | up | up | neutral | |
| Copper | 4.03 | 4.72 | 3.3% | 17.1% | up | neutral | up | |
| Energy | ||||||||
| WTI Oil | 71.72 | 65.35 | 4.2% | (8.9)% | up | down | down | |
| Nat Gas | 3.63 | 3.18 | 9.3% | (12.4)% | up | down | down (weak) | |
S&P 500
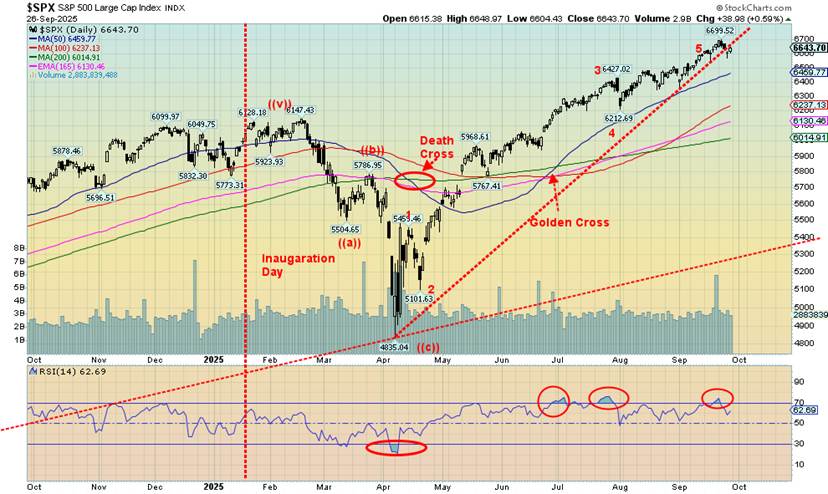
The stock market just keeps on rolling. Recession – what recession? Financial issues – what financial issues? Overbought market? Who cares? Valuations and many other indicators in nosebleed territory? So what? Greed rules; greed is good. Growing domestic and geopolitical problems? Who cares? Just buy.
There has been little doubt about this record-setting stock market. We keep on reminding ourselves that 10 stocks in the S&P 500 are the ones totally dominating the market. If they falter, the market might have a heart attack. This week we saw the NY FANG Index fall 2%. Leading the way was Meta down 4.5%, Amazon -5.1%, Google -3.2%, and Microsoft -1.3%. But offsetting that we saw Apple up 4.1%, Nvidia +0.9%, and Tesla +3.4%.
The eighth in the MAG7, Broadcom, fell 3.0%. MAGS, the MAG7 ETF, fell 1.0% on the week after making all-time highs. All that helped the S&P 500 (SPX) fall 0.3% on the week after once again making all-time highs. Also making all-time highs were the Dow Jones Industrials (DJI) that fell 0.2% and the NASDAQ that lost 0.7% on the week. New all-time highs, lower close. A negative sign. Have we topped?
Bucking the trend was the Dow Jones Transportations (DJT) that was actually up 0.8%. But the DJT has never been anywhere near its all-time high, diverging with the DJI for months now. For the smaller cap stocks, we saw the S&P 400 (Mid) down 0.5% and the S&P 600 (Small) off 0.6%. The S&P 500 Equal Weight Index rose 0.1% but did not make all-time highs. The Wilshire 5000 made all-time highs but closed down 0.4%.
In Canada, the TSX Composite was flat, thanks to the continued rise in the materials (gold, metals, and materials). TSX Financials (TFS) made all-time highs but closed down 0.5%. In the EU, the London FTSE rose 0.7%, the Paris CAC 40 was up 0.2%, the German DAX was up 0.4%, and the EuroNext was up 1.1% to new all-time highs. In Asia, China’s Shanghai Index (SSEC) was up 0.2%, the Tokyo Nikkei Dow (TKN) up 0.7%, but Hong Kong’s Hang Seng (HSI) fell 1.6%. A divergence?
We have few illusions about this market. The negative signs are there, but we haven’t broken down yet. A black swan? A sovereign debt crisis, war between NATO and Russia, tensions in the Mid-East with Israel get worse, an unexpected large banking collapse? The potential for black swans is there but none have happened. We still expect that this stock market won’t end with a whimper but with a bang.
The S&P 500 falters under 6,000, breaks under 6,500, and collapses under 6,400. New highs continue the ride. We may have broken that trendline, but so far follow-through has been largely non-existent. We can only say now, “buyer beware.”
U.S. Bonds
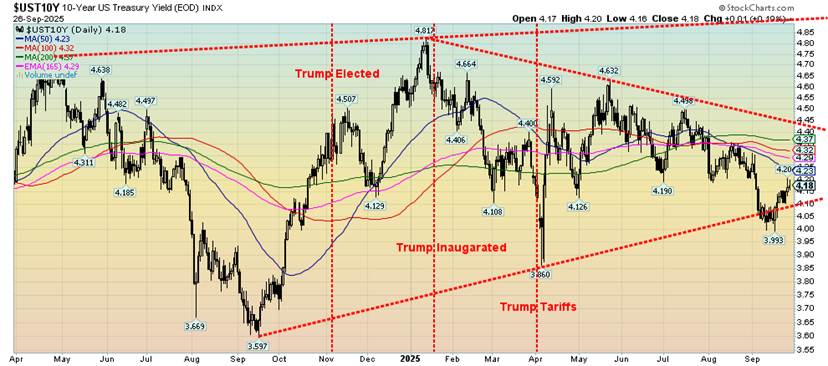
U.S. bond yields are not going in the right direction. The Trump administration wants them to go down but instead they are rising once again. Despite all the problems accumulating in behind with inflation remaining sticky, the economy is still showing growth, albeit slowing growth, and the labour market hasn’t fallen apart yet. The U.S. 10-year Treasury note yield rose to 4.18% this past week from 4.13%. Canada, not to be left behind, also saw its 10-year Government of Canada bond (CGB) rise to 3.23% from 3.20%.
Note that we have crawled back over that trend line. When a trend line is broken, we’re supposed to stay under it. But rebounding suggests it may have been a false breakdown. Nonetheless, returning over it is also not a guarantee we’re headed higher. To really confirm that we need to regain above 4.32%. But not helping is that the inflation numbers for both CPI and especially PCE prices indicate that inflation remains a problem and instead of falling they both are rising again, albeit slowly.
The Q2 GDP growth didn’t help, but as we noted that was the result of the sharp decline in imports. Exports minus imports is a component of GDP and that rose as a result of the falling imports. We also note that both income and spending rose as well and, despite poor consumer sentiment, the U.S. consumer keeps spending. Maybe that’s why consumer debt is rising to record levels of $18.4 trillion.
The expectations remain that the Fed will cut two more times this year, at the October FOMC and the December FOMC. If inflation remains sticky, the spread between inflation and the Fed rate narrows but could still remain positive.
Gold and Silver
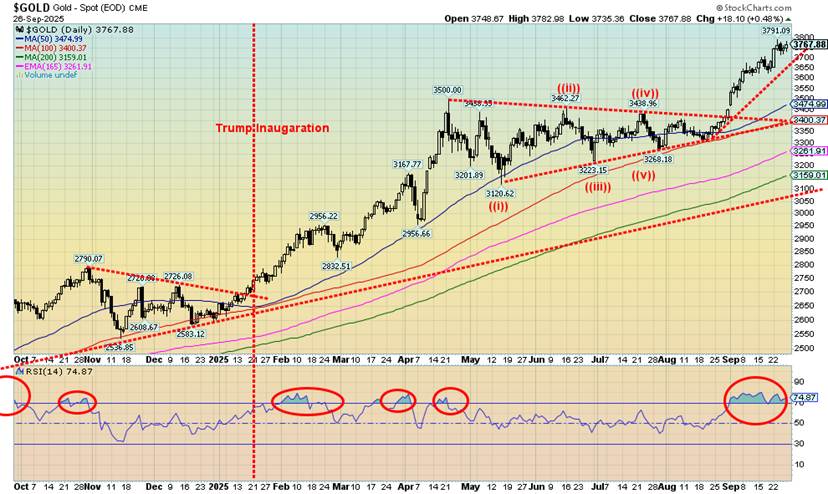
The records keep falling with gold hitting a high this past week of $3,791, just shy of our $3,800 target. If we successfully take out $3,800, then the next target is $4,000. Really soaring now is silver, which hit a 52-week high of $46.61 before settling at $46.19. Silver is now indicating that the all-time highs near $50 could now fall. We are only about 7% away.
Heating up on the geopolitical side is NATO going on war footings because of the Russian drone incursions in Poland and the brief flyover of Russian jets into Estonian air space. Cries continue from Ukraine to bring in NATO. Russia has firmly warned that NATO in the war changes the game completely and could cause the war to spread further. Domestic political instability continues in the U.S. with the words of President Trump and the Republicans vs. the Democrats seeing the temperature rising. A slowing global economy also adds to gold’s attractiveness as a safe haven. And it may be the safe haven of last resort because Bitcoin took a hit this past week.
On the week, gold rose 2.3%, silver was up 7.4%, platinum hit 52-week highs, up 12.1%, while the near precious metals saw palladium rise 11.4% and copper up 3.3% following that mine disaster of Freeport-McMoRan, the world’s largest copper producer. Not to be outdone, the Gold Bugs Index (HUI) rose 4.6% to new 52-week highs and the TSX Gold Index (TGD) was up 4.2% to record highs once again. Junior gold miners are continuing to show some life. Their rally may just be getting underway.
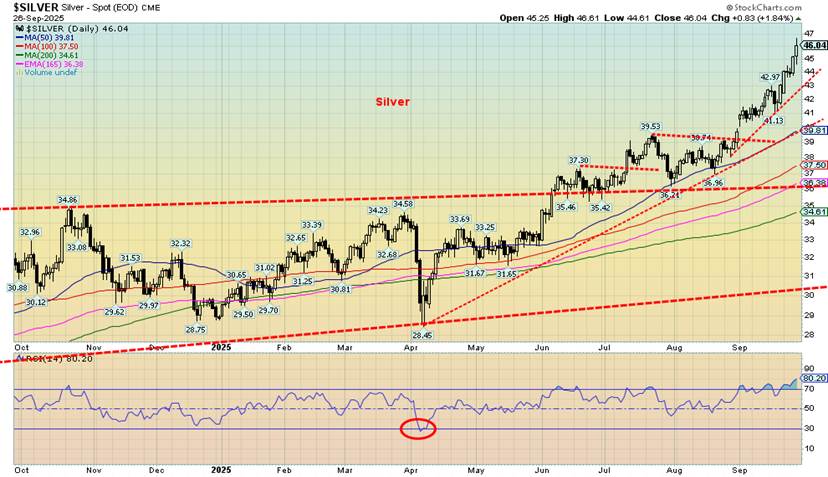
The first sign of trouble for silver is under $43 while confirmation of a possible breakdown starts under $40. For gold, a break under $3,650 is some sign of trouble but under $3,400 is more of a problem. Note how both their RSIs remain above 70 (even 80), which is overbought territory. But in a strong bull, as this appears to be, we can remain that way for some time. We’ve seen in it before in 1979 and 2011. But never worry about taking a profit, even if it goes higher.
Currencies have been quiet with the US$ Index up 0.5% this past week and all the other currencies down with the Japanese yen and the Canadian dollar off 1% and 1.1% respectively. Oil prices rose this past week as result of the rising tensions in Europe (Russia/NATO), with WTI oil up 4.2% and Brent crude 4.7%. Both the ARCA Oil & Gas Index (XOI) and the TSX Energy Index (TEN) hit 52-week highs with XOI up 5.2% and TEN up 4.3%. Are oil stocks leading? Possibly.
__
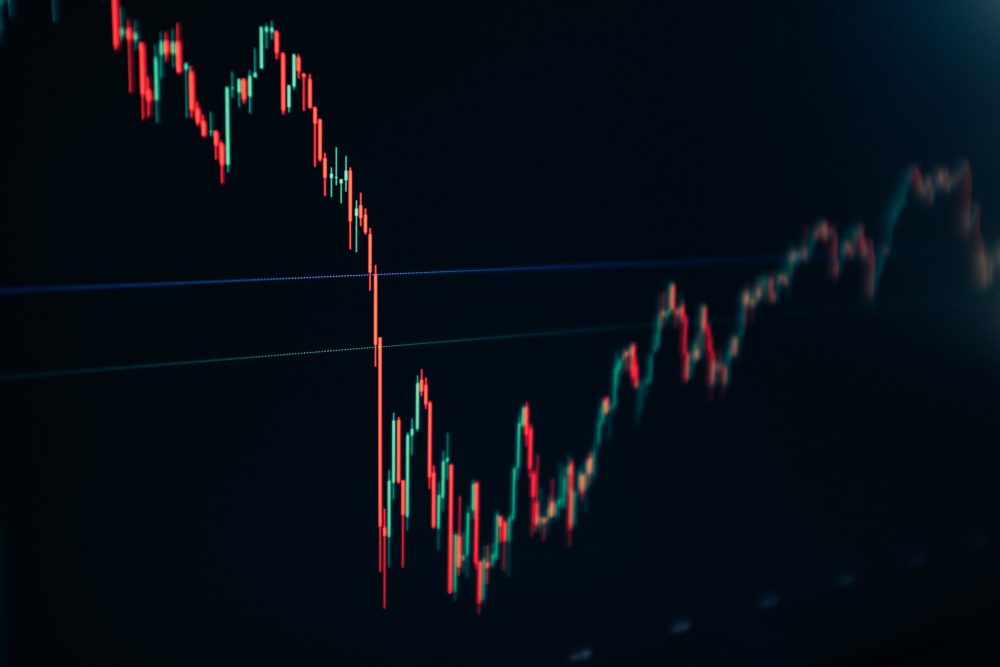
(Featured image by Markus Spiske via Unsplash)
DISCLAIMER: This article was written by a third party contributor and does not reflect the opinion of Born2Invest, its management, staff or its associates. Please review our disclaimer for more information.
This article may include forward-looking statements. These forward-looking statements generally are identified by the words “believe,” “project,” “estimate,” “become,” “plan,” “will,” and similar expressions, including with regards to potential earnings in the Empire Flippers affiliate program. These forward-looking statements involve known and unknown risks as well as uncertainties, including those discussed in the following cautionary statements and elsewhere in this article and on this site. Although the Company may believe that its expectations are based on reasonable assumptions, the actual results that the Company may achieve may differ materially from any forward-looking statements, which reflect the opinions of the management of the Company only as of the date hereof. Additionally, please make sure to read these important disclosures.
David Chapman is not a registered advisory service and is not an exempt market dealer (EMD) nor a licensed financial advisor. He does not and cannot give individualised market advice. David Chapman has worked in the financial industry for over 40 years including large financial corporations, banks, and investment dealers. The information in this newsletter is intended only for informational and educational purposes. It should not be construed as an offer, a solicitation of an offer or sale of any security. Every effort is made to provide accurate and complete information.
However, we cannot guarantee that there will be no errors. We make no claims, promises or guarantees about the accuracy, completeness, or adequacy of the contents of this commentary and expressly disclaim liability for errors and omissions in the contents of this commentary. David Chapman will always use his best efforts to ensure the accuracy and timeliness of all information. The reader assumes all risk when trading in securities and David Chapman advises consulting a licensed professional financial advisor or portfolio manager such as Enriched Investing Incorporated before proceeding with any trade or idea presented in this newsletter.
David Chapman may own shares in companies mentioned in this newsletter. Before making an investment, prospective investors should review each security’s offering documents which summarize the objectives, fees, expenses and associated risks. David Chapman shares his ideas and opinions for informational and educational purposes only and expects the reader to perform due diligence before considering a position in any security. That includes consulting with your own licensed professional financial advisor such as Enriched Investing Incorporated. Performance is not guaranteed, values change frequently, and past performance may not be repeated.


TopRanked.io Weekly Affiliate Digest: What’s Hot in Affiliate Marketing [Bovada Affiliate Program]
This week, we're mashing up 80s tech with 2020s private messaging apps. Why? Because Big Tech just dropped a big...


Euro Stablecoins Struggle to Compete with Dollar Dominance in Crypto Markets
Euro stablecoins remain marginal despite the euro’s global importance, with minimal trading volume compared to dollar rivals like USDT and...


Gilead Sciences Advances Growth Strategy with Focus on HIV, Oncology, and Innovation
Gilead Sciences focuses on developing treatments for HIV, cancer, and inflammatory diseases, driven by blockbuster drugs like Biktarvy. Growth relies...


Casablanca Stock Exchange Profits Surge in 2025 as Growth Momentum Strengthens
In 2025, Casablanca Stock Exchange profits rose 40% to MAD 50.9 billion. Net income grew 22.3%, driven by strong industrial...


Credibur Scales Rapidly: €2 Billion in Structured Debt Facilities in Six Months
Infrastructure fintech Credibur has added over two billion euros in structured debt facilities within six months. Its platform connects lenders,...
 |
|
 |  |
 |
|
-

 Crowdfunding3 days ago
Democratizing Farmland Investment: The Rise of Farm Fractions in Agritech
-

 Crowdfunding1 week ago
Cyberpunk Trading Card Game Surges Past Goals on Kickstarter
-
 Business6 days ago
Markets Volatility, Geopolitics, and Signals of a Potential Trend Shift
-

 Impact Investing3 days ago
EU Taxonomy 2025: Progress in ESG Reporting, Gaps in True Sustainability