Featured
Global stock market posts new highs despite Las Vegas shooting, Catalonia vote
The week was filled with hurricanes, acts of terror, elections, tax reform and job numbers.

As wrenching as Las Vegas was, it had no impact on global markets—except for gun stocks that soared, Las Vegas hotels that plummeted, and conspiracy theories that proliferated.
Puerto Rico
Puerto Rico had no real impact on stocks either, although it was on again-off again for the Puerto Rico debt. President Trump seemed to indicate that the debt should be forgiven, but then, of course, he didn’t really ask anyone and was soon overruled.
Hedge funds (and even the mutual funds) don’t really want to lose money. Hedge funds had already filed in court to protect their asset.
Catalonia
Catalonia’s attempt to separate from Spain may be the most interesting. It had no real impact on EU stock markets, some of which ran up to new all-time highs. While Catalonia voted overwhelmingly for independence the turnout was only 43%, as Catalonians had to vote against the backdrop of a huge police presence, clashes in the street, and Madrid declaring it was illegal and threatening to arrest the leaders of Catalonia. Madrid even tried to wage cyber-war against them with attempts to shut down the internet to cut off communications.
It was not what one would expect in one of the EU’s largest democracies. But then, Catalonia represents one-fifth of the Spanish economy so Spain without Catalonia would be severely hurt. All the unrest could still hurt Spain, as the country is a popular tourist destination. The EU was silent, but they don’t want to see Catalonia separate from Spain. There are numerous independence movements throughout the EU. If Catalonia secedes, this could prompt more secessionist referendums and even lead to the breakup of the EU.
Secessionist movements are having a hard time. Most notably was the negative reaction to the separation of Crimea and Donbas. Crimea joined Russia against the backdrop of Ukraine (and the west) accusing Russia of having seized Crimea despite a referendum that overwhelmingly supported secession and joining Russia. Ukraine attacked Donbas to try and stop them from seceding while at the same accusing Russia of invading Ukraine in the Donbas. Since then over 10,000 people have died in the conflict, one that remains unresolved.
Kurdistan
Kurdistan was met by threats from Turkey, Iraq, and Iran if they dared to try and create a Kurdish homeland. A Kurdish homeland had been denied for 100 years when the Kurds were spurned at the Treaty of Versailles, Paris 1919. The British and the French divided the Ottoman Empire in their own image and political and economic needs in denying the Kurdish homeland. A long guerrilla war was fought in Iraq by the Kurds against the British in the 1920’s. Civil war ensued in Turkey between the Turkish government and the Kurds, a conflict that has been ongoing off and on for a century, and thousands of Kurds have died. The Kurds in Northern Iraq and the Kurds in Northern Iran have always had a difficult and uneasy relationship with Baghdad and Tehran.
The only successful independence was Kosovo. Kosovo, formerly an autonomous province of Serbia but now a disputed territory and partially recognized state, is largely inhabited by ethnic Albanians. The Albanians were fighting a nasty war with Serbia and Serbia invaded to bring them under control. Given the strategic importance of Kosovo in the central Balkans, the West led by NATO came to its rescue leading to the establishment of Kosovo’s unilateral declaration of independence in 2008. While Kosovo’s independence is recognized by 111 UN members, many including Serbia do not recognize it. Serbia is and has been an important Russian ally in the Balkans. Both Serbia and Kosovo were at one time a part of Yugoslavia before its breakup in the 1990s.
The September jobs report
For the first time since September 2010, the US Bureau of Labour Statistics (BLS) reported a decline in nonfarm payrolls. Largely because of the negative impact of the hurricanes nonfarm payrolls fell in September by 33,000. The market had expected a gain of 90,000. August nonfarm payrolls were revised upward to 169,000. The headline unemployment rate (U3) fell to 4.2% from 4.4%. The U6 unemployment rate that includes discouraged workers (less than one year) fell to 8.3% from 8.6%. The Shadow Stats unemployment rate (U6 plus discouraged workers unemployed for more than one year and no longer counted by the BLS) slipped to 21.9% from 22.2%.
The BLS also reported that the labor force participation rate rose to 63.1% from 62.9%. One would have thought that would have resulted in a higher unemployment rate but no, as the number of employed persons actually rose by 906,000 including it appears 1,500,000 counted as employed but otherwise unemployed because of the hurricanes.
Confusing, given the decline in nonfarm payrolls. Nonfarm payrolls are determined by what is known as the Establishment Survey as collected by the BLS. The establishment survey incorporates payroll records of numerous non-farm establishments and government agencies. But participation rates and the unemployment rate are determined through the Household Survey conducted by the US Census Bureau that surveys 60 thousand households each month. The two surveys have items that are not common to both. A deeper explanation can be found here. The BLS reports the Employment Situation Summary each month here. What all this does is render the employment numbers reported as moot and confusing.
The BLS also reported that average hourly earnings also rose in September by 12 cents or 0.45%. It also was an unexpected gain. The gain in August was only 0.2%. Despite the weaker than expected nonfarm payrolls, the market focused on the strong employment gains, the jump in the participation rate, the jump in hourly earnings, and the lowering of headline unemployment (U3). In the early going the US$ rose while gold and other commodities sold off.
Tax reform redux
It is no surprise that Congressional Republicans are moving quickly to try and institute tax reform. A reminder, however, that even if tax reform were to be passed by the Republic-controlled Congress it must pass as well in Senate. While the Senate is also Republican controlled and the passage of the tax bill only requires a majority, remember they thought that would be the case with the repeal of Obamacare as well. It takes only three malcontent Republican senators to defeat the bill. The Democrats will be lined up against the tax bill as they believe the bill does little to really reform and high-income earners are the main beneficiaries. The stock market likes the tax bill and it is one reason the stock indices keep rising to new all-time highs.
But if there is a serious fly in the ointment for the tax bill it is the Federal Reserve. The Fed admits the tax bill could deliver a short-term growth surge but in the end it would prove to be inflationary, would add considerably to the US debt that already stands at $20.3 trillion, and, could spark a further stock bubble that when it bursts could return the US to sub-par growth again and even a debt crisis. The Fed believes this is stimulus the country doesn’t need at this time. Another independent economic analysis supports this view. There are many deficit hawks in the Republican caucus and they could prove to be difficult if the perception is that the debt would expand considerably. This is setting aside the fact the tax bill would benefit the wealthy and jeopardize a host of other programs including Medicaid, Medicare, and other social programs.
Given as well that the debt ceiling has to be dealt with again by year-end the next few months should prove interesting. Canadians, however, should not be envious. Our tax reform fights seem quaint by comparison.
MARKETS AND TRENDS
|
|
Percentage Gains Trends
|
|||||||
| Stock Market Indices | Close
Dec 31/16 |
Close
Oct 6/17 |
Week | YTD | Daily (Short Term) | Weekly (Intermediate) | Monthly (Long Term) | |
| S&P 500 | 2,238.83 | 2,549.33 (new highs) | 1.2 | 13.9 | up | up | up (topping) | |
| Dow Jones Industrials | 19,762.60 | 22,773.67 (new highs) | 1.7 | 15.2
|
up | up | up (topping) | |
| Dow Jones Transports | 9,043.90 | 9,886.88 (new highs) | (0.3) | 9.3 | up | up | up (topping) | |
| NASDAQ | 5,383.12 | 6,590.18 (new highs) | 1.5 | 22.4 | up | up | up (topping) | |
| S&P/TSX Composite | 15,287.59 | 15,728.32 | 0.6 | 2.9 | up | up | up | |
| S&P/TSX Venture (CDNX) | 762.37 | 788.32 | 0.9 | 3.4 | up | down (weak) | up (weak) | |
| Russell 2000 | 1,357.14 | 1,510.23 (new highs) | 1.3 | 11.3 | up | up | up (topping) | |
| MSCI World Index | 1,690.93 | 1,969.14 | (0.1) | 16.5 | up | up | up | |
| Gold Mining Stock Indices | ||||||||
| Gold Bugs Index (HUI) | 182.31 | 202.10 | 2.8 | 10.9 | down (weak) | neutral | up (weak) | |
| TSX Gold Index (TGD) | 194.35 | 201.84 | 2.9 | 3.9 | neutral | down | up (weak) | |
| Fixed Income Yields | ||||||||
| U.S. 10-Year Treasury yield | 2.45 | 2.37
|
1.7 | (3.3) | ||||
| Cdn. 10-Year Bond yield | 1.72 | 2.12 | 2.4 | 23.3 | ||||
| Currencies | ||||||||
| US$ Index | 102.28 | 93.64 | 0.8 | (8.5) | up | down | down (weak) | |
| Canadian $ | 0.7440 | 0.7980 | (0.9) | 7.3 | down | up | neutral | |
| Euro | 105.22 | 117.33 | (0.7) | 11.5 | down | up | up (weak) | |
| British Pound | 123.21 | 130.68 | (2.5) | 6.1 | down (weak) | up | down | |
| Japanese Yen | 85.57 | 88.76 | (0.1)
|
3.7 | down | neutral | neutral | |
| Precious Metals | ||||||||
| Gold | 1,151.70 | 1,274.90 | (0.8) | 10.7 | down | up (weak) | up | |
| Silver | 15.99 | 16.79 | 0.7 | 5.0 | down | down (weak) | neutral | |
| Platinum | 905.70 | 916.70 | 0.1 | 1.2
|
down | down | down | |
| Base Metals | ||||||||
| Palladium | 683.25 | 919.00 | (1.9)
|
34.5 | neutral | up | up | |
| Copper | 2.5055 | 3.03 | 2.7 | 20.9 | up (weak) | up | up | |
| Energy | ||||||||
| WTI Oil | 53.72 | 49.29 | (4.6) | (8.3) | up (weak) | neutral | neutral | |
| Natural Gas | 3.72 | 2.86 | (5.0) | (23.1) | up (weak) | neutral | neutral | |
Source: www.stockcharts.com, David Chapman
Note: For an explanation of the trends, see the glossary at the end of this article. New highs/lows refer to new 52-week highs/lows.
© David Chapman
Onward and upward
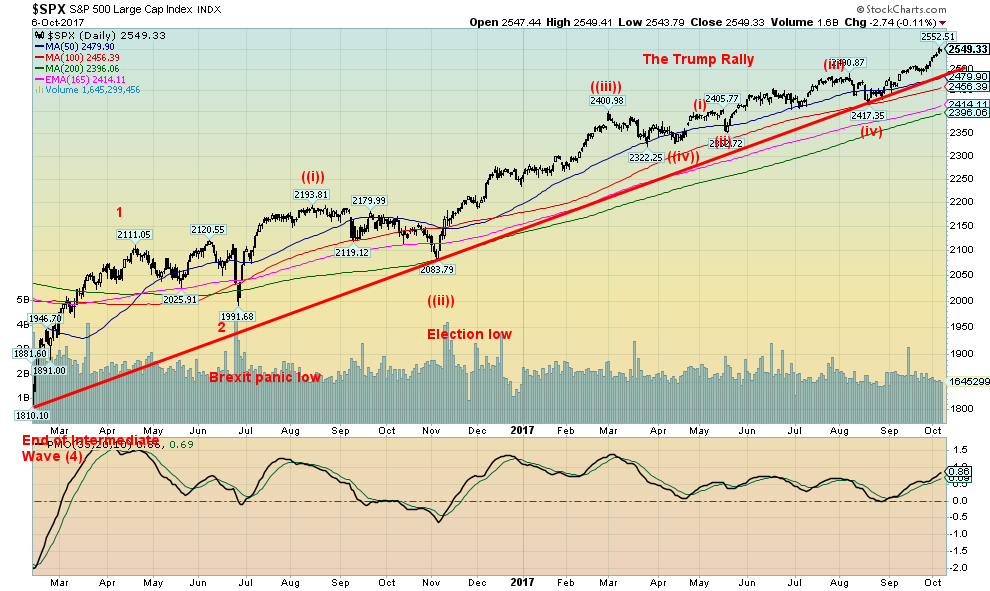
It seems that nothing can stop this market. New highs are becoming a weekly occurrence. The S&P 500, the Dow Jones Industrials (DJI), the Dow Jones Transportations (DJT), the NASDAQ, and the Russell 2000 all hit new all-time highs once again this past week. Grant you, they wavered on Friday but only slightly. And all of this is occurring against the backdrop of a declining advance line, declining volume and declining momentum. We don’t see any sign of trouble until the S&P 500 falls back under 2,500. But even that would be insufficient to break the upward trend.
The weekly trend (intermediate) breaks under 2,400 so that would be a more important point. Finally, the monthly (long-term) trend doesn’t break until under 2,000 and preferably under 1,800. These are points to keep in mind, but the reality is we do not expect to see them anytime soon. However, be aware of them. As to bullish potential, well, our next good target appears to be up around 2,650. That is a mere 100 points away. It is the bull market that is refusing to die.
© David Chapman
Fear and greed
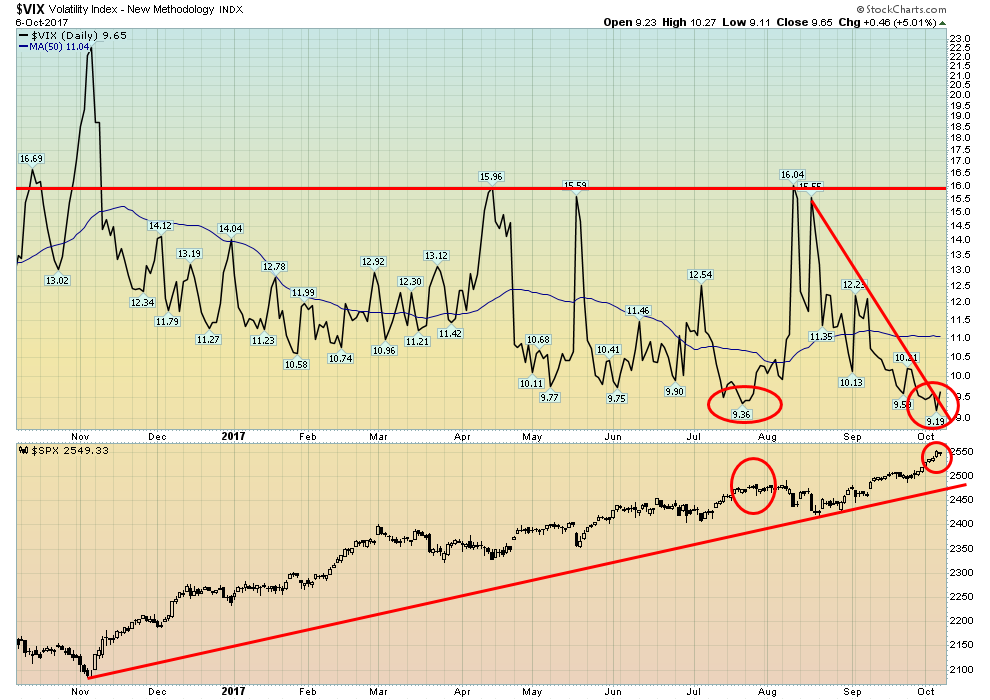
That is what the VIX volatility indicator is all about. Once again, the VIX set a new record low of 9.19 as the S&P 500 was once again making another new all-time high. Fear, what fear? The market seems to not have any. Maybe it really is different this time. Or, maybe not. It might not be strange to say that pundits have been calling for the market to crash since 2010. We hope they still weren’t short.
The strange thing about this bull is the market just relentlessly climbs higher. There has been no blow-off or spike that might be the sure sign of a top. But the stock market has not been the only market relentlessly climbing higher. Bond prices kept rising although to be fair they did top out in 2016. Bond yields (yields move inversely to prices) were even negative in Germany, Switzerland, Japan, and a few other jurisdictions. This helped fuel a property bubble in Toronto, New York, Miami, Hong Kong, and elsewhere over the past number of years, particularly for high-end properties. While it has wavered at times it too has climbed higher. Overall US house prices remain 20–50% off their 2007 highs. Other things that have been strong in bull markets over the past few years include rare coins, art, and antiques. And don`t forget the soaring prices in the cryptocurrency market (Bitcoin). Fear? The word seems dead. But not all have enjoyed the bull rush. Commodities are still languishing. But could they catch up? The next bull market?
Source: www.stockcharts.com
It pays to have some perspective
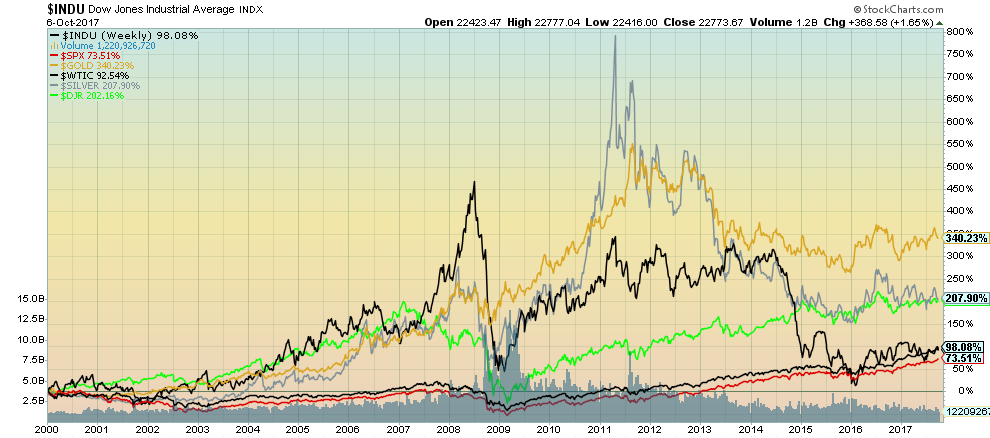
Despite the big rise in the stock markets since 2009, the major stock indices are still lagging. Since 2000, the big winner has been gold: up 340%. You’d never know it, however, based on the past five/six years. Gold peaked in 2011, as did silver. Silver is up 208% since 2000 but at one point it was up over 700%.
As to the indices, well the DJI has seen a gain of 98% and the S&P 500 is up 93%. Oh, individual stocks have vastly outperformed particularly the FAANGs (Facebook, Apple, Amazon, Netflix, and Google), but the 2008 financial crisis knocked the stock indices for a loop. The Dow Jones REIT Index has enjoyed a nice run up 202% since 2000.
Source: www.tradingeconomic.com, www.bls.gov
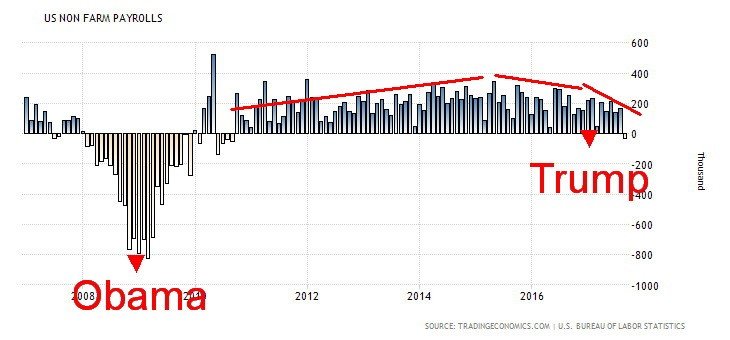
Here are the monthly nonfarm payrolls going back to the financial crisis of 2008. Obama took over at the depths of the crisis in January 2009. Over the next several years there was steady improvement peaking in 2015. After that, it started to slow down. Trump took over in January 2016 and the nonfarm payrolls have been in a slow decline culminating in the negative September report, the first one since September 2010.
Trump called the monthly nonfarm payrolls phony. And he does have a point given the sharply diverging methodologies of the Establishment Survey vs. the Household Survey. Given the first few months of his Presidency, he was changing his tune. But then after eight years of growth, there could be expected some slowdown especially given the headline unemployment rate (U3) has fallen to multi-year lows.
© David Chapman
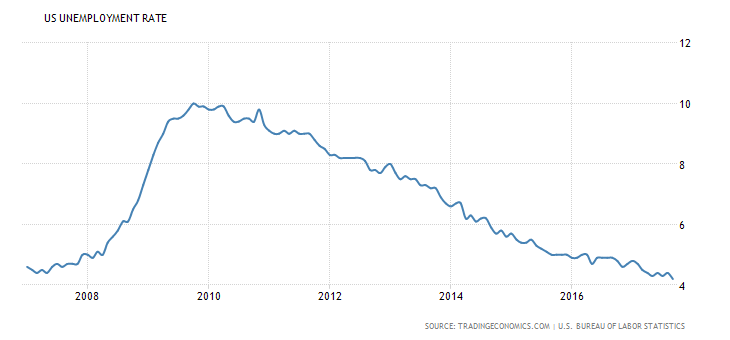
Here is the headline unemployment rate (U3). Reported at 4.2%, it is the lowest U3 rate since February 2001. The rate peaked at around 10% in late 2009 and has been falling steadily ever since. The employment-population ratio was reported at 60.4%, the highest level seen early 2009.
Nonetheless, it is off its peak of 64.7% seen in April 2000. As noted earlier, the labor force participation rate came in at 63.1%, a level not seen since 2013. Back in January 2007, the labor force participation rate stood at 66.4%.
Source: www.shadowstats.com
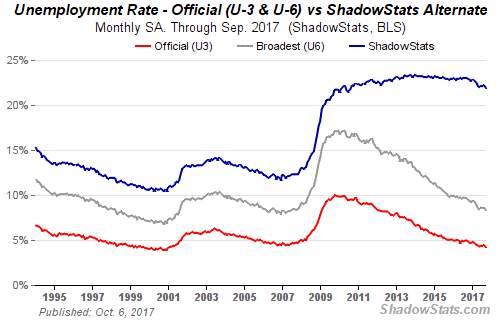
Here is the Shadow Stats chart that shows the U6 unemployment rate and the Shadow Stats rate. The Shadow Stats rate incorporates long-term unemployed over one year and those ignored by the BLS and not counted as a part of the labor force. Some 94.9 million Americans are considered not to be a part of the labor force.
Grant you, 51.3 million of them are retirees, and there are 10.5 million disabled. Many others are students or stay-at-home mothers. Some 18% of the labor force is considered part-time. Many of those would prefer full-time work and would make up a good portion of the U6 unemployment rate.
But one thing the Shadow Stats chart shows is that the Shadow Stats unemployment has come down very slowly when compared to the much more rapid decline in the U6 and U3 unemployment rate.
Source: www.stockcharts.com
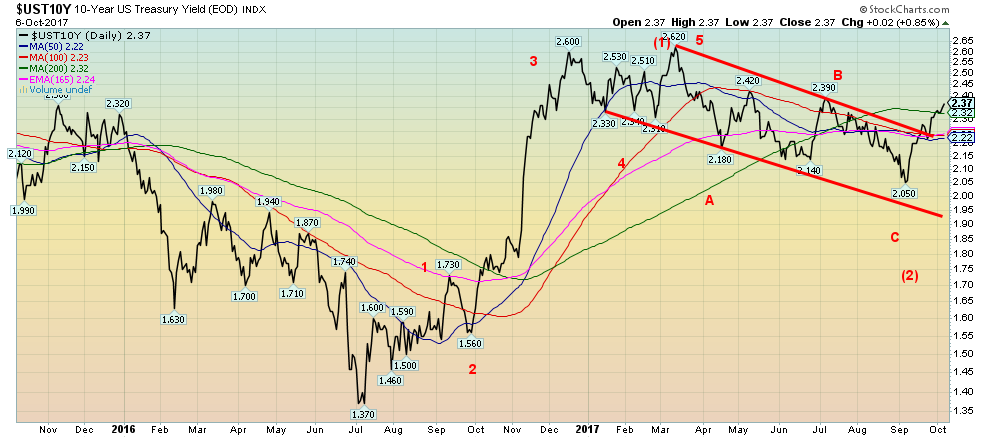
Bond yields in the US continue to rise as the 10-year US Treasury note rose to 2.37% this past week from 2.33% the previous week. We have now cleared the 200-day MA so it is quite possible now to challenge the March 2017 high of 2.62%.
We believe we are in the process of making the third wave to the upside (prices are falling as prices move inversely to yields). Minimum targets should be at least 3%. Given the strong employment numbers reported Friday (setting aside the weak nonfarm payrolls), many believe the Fed will hike rates in December and probably again in March 2018. Only a return and break below 2.22% might change this scenario.
Source: www.stockcharts.com
Spread watch
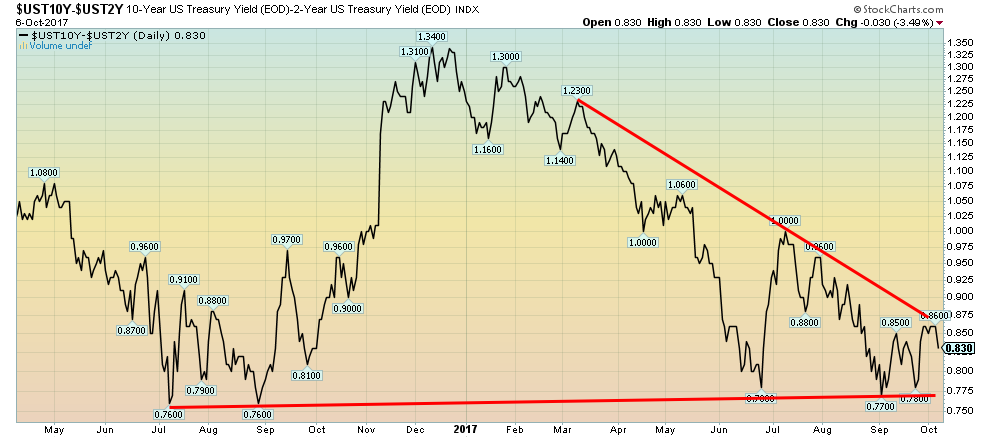
Almost on cue, the 2- year 10- year spread tested the downtrend line then turned down once again. This past week the spread lost 3 bp falling to 83 bp from 86.
Once again, a test of the breakdown line near 77.5 could be looming.
Source: www.coindesk.com
Bitcoin watch
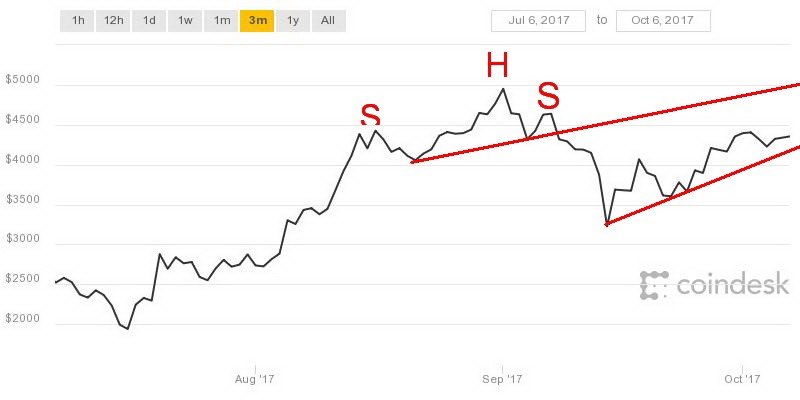
Not a lot has changed in the past week. Bitcoin is either rebasing for a new move to the upside or this is just return action following the sharp drop from what appears as a head and shoulders top pattern. The pattern’s objectives were fulfilled. But confirmation that new highs are probable would not take place until the right shoulder at $4,640 is taken out. A drop below $3,600 would suggest that new lows are probable.
There are numerous attempts going on to create Bitcoin derivatives through an ETF. So far, efforts have been blocked by the SEC. Bitcoin continues to come under attack from central bank officials. Bitcoin’s success will come if more people become involved in either Bitcoin or other cryptocurrencies.
But a proliferation of cryptocurrencies is just confusing for the uninitiated and as some suggest it just reduces all of them to a speculation. Still, funds with cryptocurrency exposure are popping up. But is that really the way to participate? Or is it just another way to speculate?
Source: www.stockcharts.com
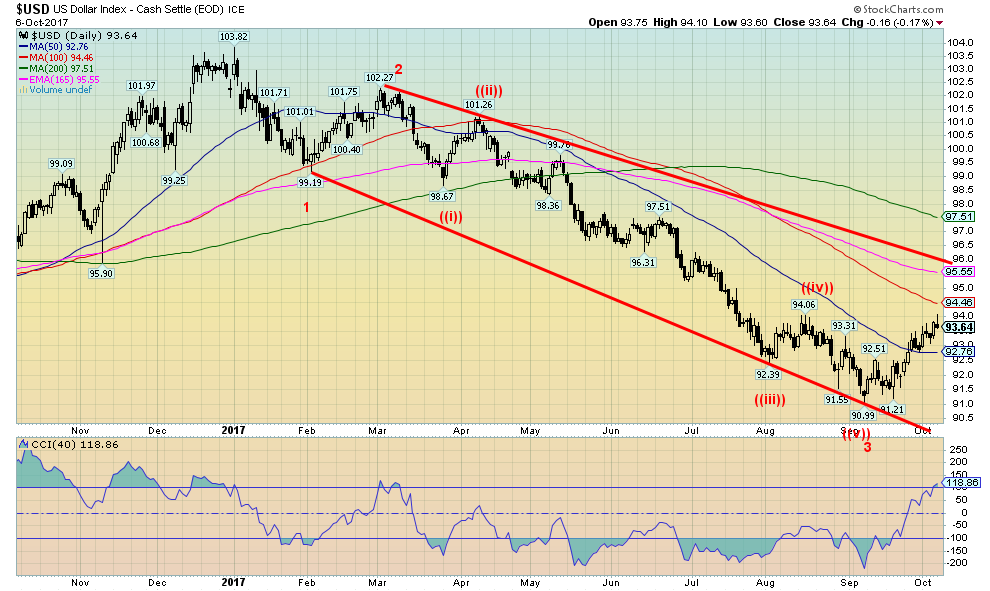
The US$ Index enjoyed another up week (the 4th consecutive) this time gaining 0.8%. All other major currencies suffered by comparison. Pound Sterling was knocked back 2.5% as Brexit faltered and PM Theresa May was under attack, the Euro was off 0.7% while the Japanese Yen was only down 0.1%. The Cdn$ suffered once again this time losing 0.9%. The US$ Index has broken above the 50-day MA and appears headed for the 100-day MA near 94.50.
Friday’s action did see a reversal as the US$ Index opened higher on the better than expected jobs numbers setting aside the hurricane loss of 33,000 nonfarm payrolls in September. The short-term reversal on Friday might see the US$ Index pullback to the 50-day MA near 92.75. Below that level, further support is seen at 92. The rally from the 90.99 low in September appears to be the start of a correction following the long decline in the US$ Index that got underway back in December 2016. There is potential eventually to test the downtrend line currently up near 95.50. A rise now over 94.50 would solidify that potential. In the interim, the US$ Index appears poised for a pullback within the context of the advance. A stronger US$ Index is normally negative for gold and other commodities.
Source: www.stockcharts.com
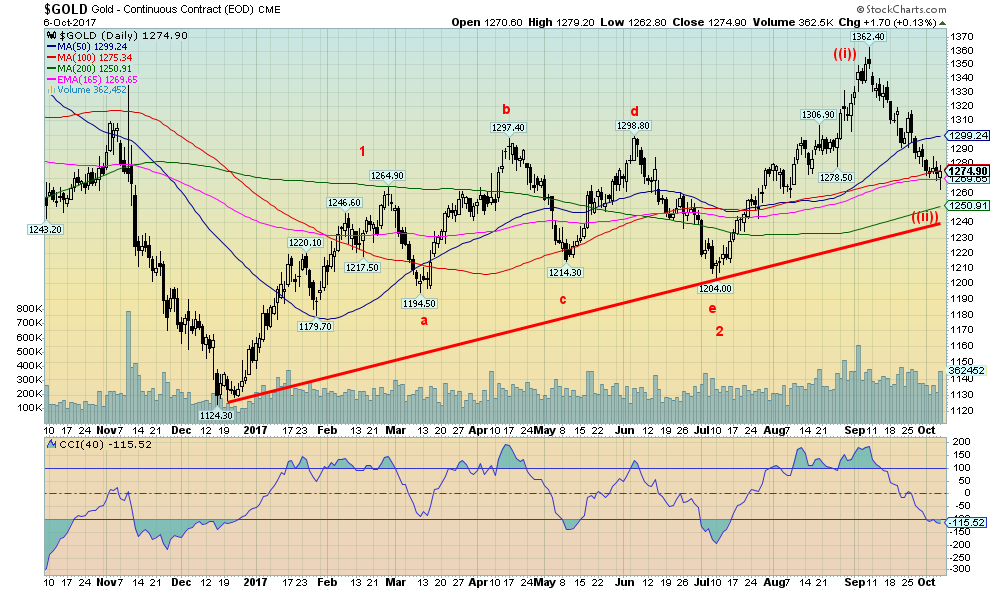
For the fourth consecutive week, gold prices slid this time losing 0.8%. Silver, however, did not join gold and gained 0.7%. This is a positive divergence, as we normally want to see silver leading. The gold stocks also enjoyed a positive week as the Gold Bugs Index (HUI) gained 2.8% and the TSX Gold Index (TGD) jumped 2.9%. Gold initially fell on Friday following the release of the monthly job numbers. The nonfarm payrolls were weak but then the unemployment rate (U3) fell, wages were up more than expected, the participation rate and actual employment jumped sharply. This helped solidify thoughts that the Fed would hike rates once again in the 4th quarter most likely in December.
It also raised thoughts that the Fed would hike in the first quarter of 2018, most likely in March. If there is a note of caution about that rate hike, we are reminded that Fed Chairman Janet Yellen’s term ends in February and in all likelihood she will not be reappointed. Given Trump’s penchant for disruption, the choices could be between former Fed Governor Kevin Warsh and Stanford economist John Taylor. Both are well-known hawks and fit Trump’s desire for less regulation. If Trump decides to maintain the status quo (and that is probably not the case), the choices would be to reappoint Yellen or pick current board governor Jerome Powell. Economic advisor Gary Cohn appears to be fading from contention. How would markets respond if the hawks are picked? Initially, at least, the markets might not take it well as markets like the stability that Yellen and Powell could bring.
Also, keep in mind the Fed is in the process of unwinding its balance sheet. Unwinding its balance sheet is considered to be a form of tightening not unlike hiking interest rates. That also helps strengthen the US$ and in turn, it weakens gold. If there is any consolation it is intriguing to notice that the US debt has exploded since the debt limit was hiked. The US debt now stands at $20.3 trillion. A higher debt limit and higher debt levels are positive for gold.
Gold’s recent fall coincides nicely with the recent rise in the US$. The US$ has been rising because of thoughts of Fed rate hikes, the stronger than expected US economy and tax reform. Gold has reached zones of support. The 200-day MA is at $1250 and the uptrend line from the December 2016 low comes in around $1,240. The latter zone could still be an ultimate target.
To the upside, resistance would be seen at $1,300 to $1,320. The reversal Friday could start a bump to the upside but at this time we don’t believe the corrective period is over. Once a final low is seen we should embark on a strong up move that should take us above $1,400.
Source: www.stockcharts.com
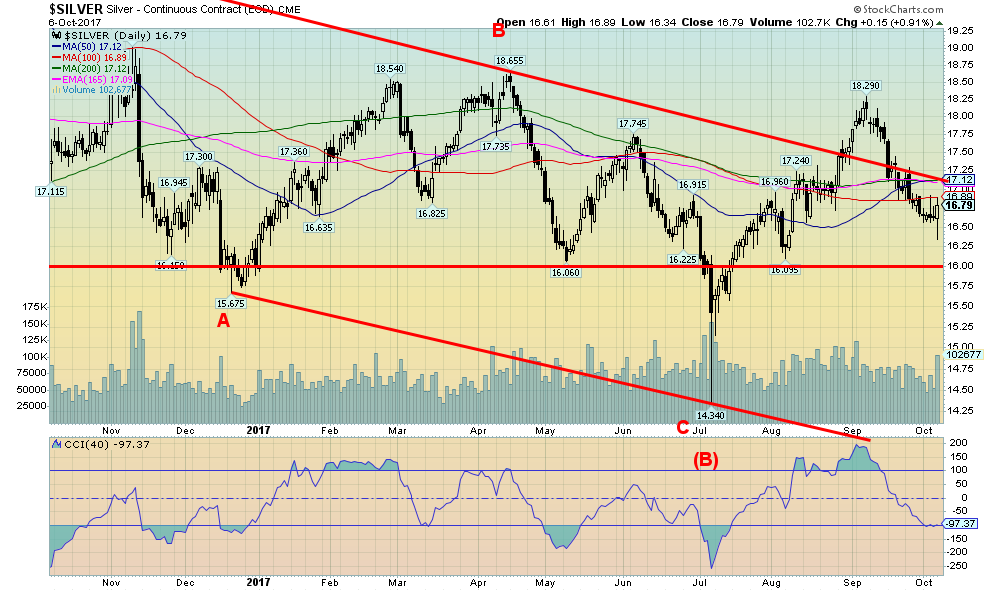
Silver is in a similar position as gold given its recent drop in the face of a stronger US$. Nonetheless, we are encouraged by the fact that silver finally outperformed gold on the week. In a bull market, we want to see silver leading. Silver tends to lead in both up and down markets. So a weak response from silver even as the market rises raises suspicions that the move is not sustainable.
Major support for silver is seen down around $16. The week’s low at $16.34 hit another support zone in the $16.35 to $16.50 area. Friday was an outside reversal day. This is normally a good bullish pattern (bearish if it was the opposite) but upside follow-through is important. If, however, as we suspect that this is merely a bounce-back following the decline from $18.29 silver should run into resistance in the $17.25 to $17.50 zone. If we do fail up there then we are likely to see new lows once silver reverts to the downside. However, as noted strong support should be seen in the $16 zone.
Source: www.stockcharts.com
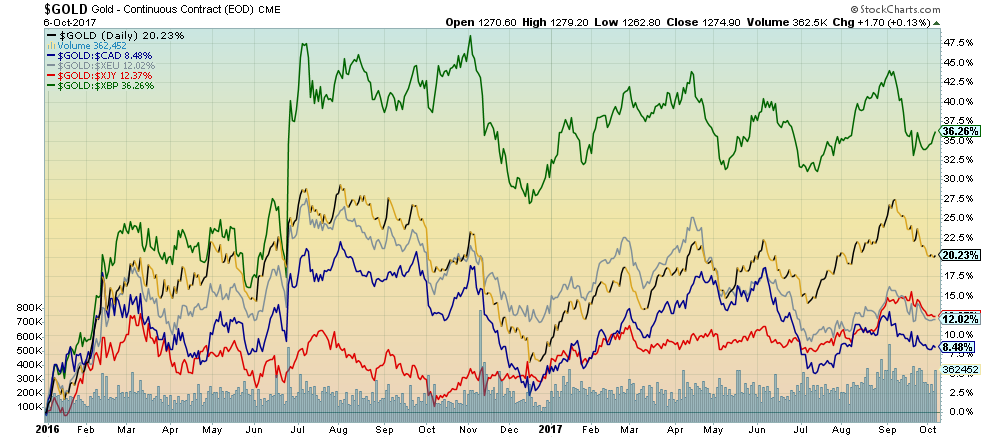
Since finding a significant low back in December 2015 gold has enjoyed a good run. But the rise has been uneven even as gold has been rising in all currencies. Here is a picture of gold’s rise in various currencies since 2016. Gold in US$ is up 20.2% but the strongest currency has been in Pound Sterling as it is up 36.3%. Of course, the Pound has been weak especially following Brexit. Gold in Euros is up 12% while gold in Japanese Yen is up 12.4%. The weak performer has been gold in Cdn$ up only 8.5%. But then consider the Cdn$ has been strong vs. the US$ during this period rising from 71 to 80 today.
Source: www.stockcharts.com
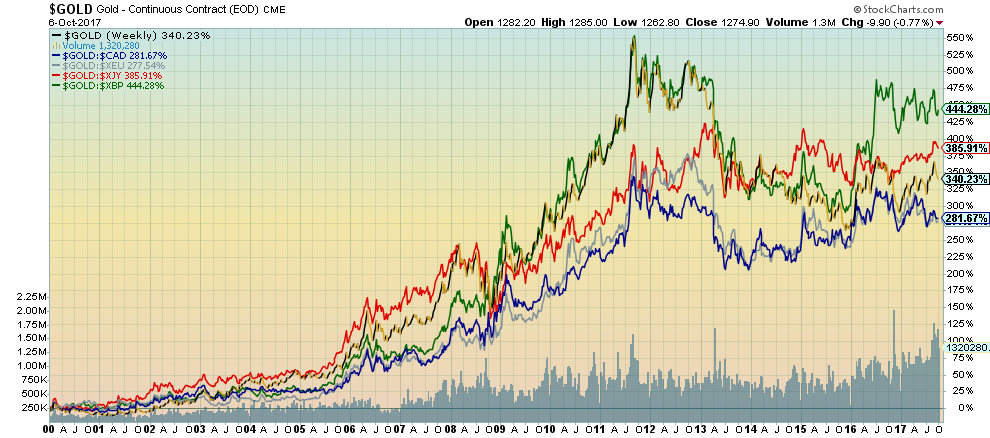
If gold has been strong in all currencies since 2016, they have been the stars since 2000. The leader is gold in Pound Sterling up a stellar 444%. Gold in Japanese Yen is up 386%, in Cdn$ up 282% and in Euros up 277%. Gold in US$ is up 340%. Gold rising in all currencies is a good sign that we are in a bull market not only from 2000 but also from 2016. Despite the difficulties of the past few years, gold has been the strongest currency.
Source: www.cotpricecharts.com
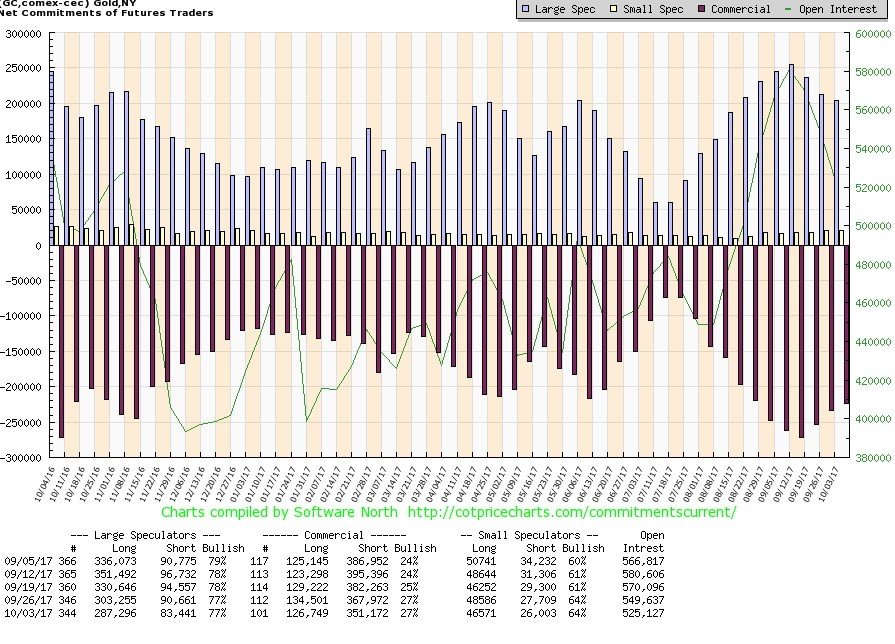
The commercial COT for gold was unchanged this past week at 27%. Short open interest fell roughly 17,000 contracts but long open interest was also down losing about 8,000 contracts. All this would seem to suggest the downward pressure on gold is probably not over. Friday’s upside reversal might soon peter out especially in the $1,300 to $1,320 range. We wouldn’t be surprised to see the commercial COT tick down once again next week. The large speculators COT was also unchanged at 77%. Not surprisingly, the silver commercial COT was also unchanged in the week at 29%. If the commercial COTs had improved, again we might have been more optimistic about a rebound. Given they were not we believe it is a note of caution, as a possible rebound gets underway.
Source: www.stockcharts.com
Gold Bugs Index (HUI)
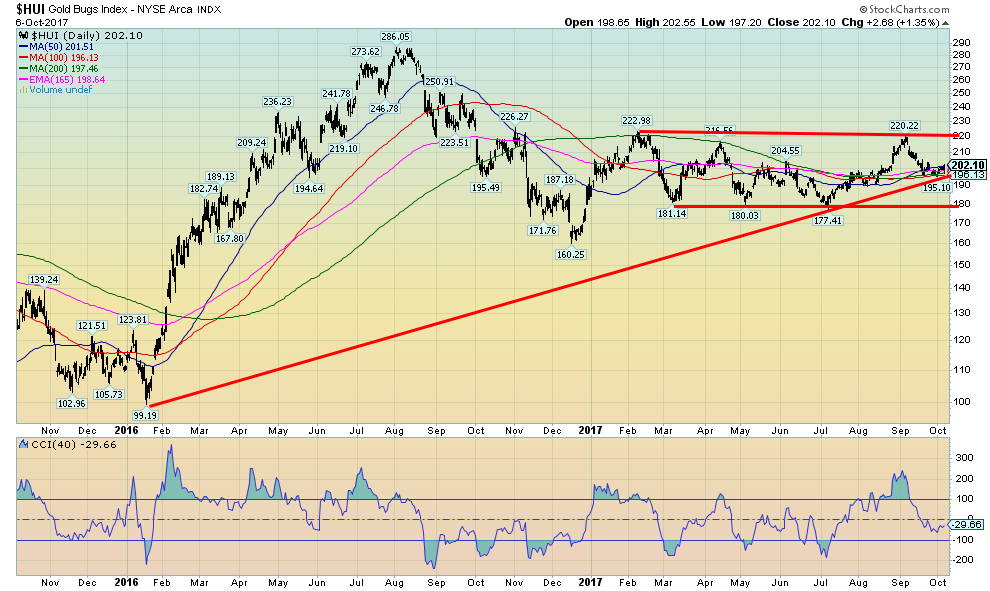
The HUI hit a depressing low back in early 2016 at 99.19 down almost 85% from its 2011 high. Since then the HUI is up just over 100% but remains depressingly down 68% from the September 2011 high. Sentiment towards the gold stocks is low but not rock bottom. The gold/HUI ratio continues to suggest gold is expensive while the gold stocks are cheap. From January 2016 to July 2016, the HUI enjoyed a strong run gaining 189%. Since then the HUI went into a corrective pattern and despite being up from the December 2016 low of 160 the HUI continues to struggle. Gold stocks are unloved and under-owned. For most of 2017, the HUI appears to be in a sideways trading pattern. This should be a bullish pattern with the potential to rise to at least 265 once it breaks out over 220. Sideways patterns can be very frustrating, but ultimately this pattern should resolve itself to the upside. Given how cheap gold stocks are along with being under-owned the likelihood of a breakdown under 180 is low but it must be noted. The consolidation is a period to accumulate.
Source: www.stockcharts.com
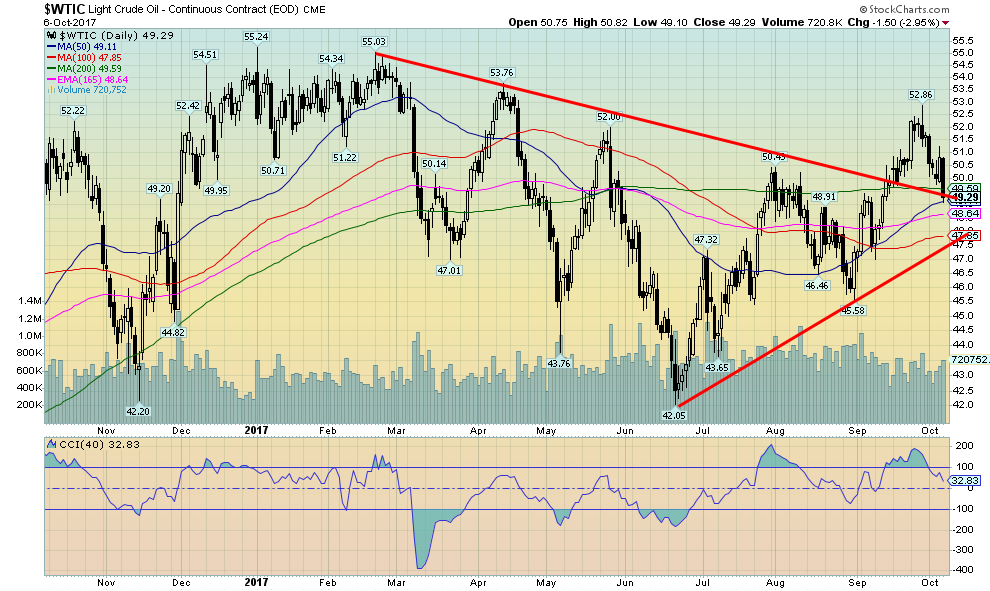
The hurricanes maketh and the hurricanes taketh. Seems the hurricanes were, on one hand, pushing up the price of oil as Hurricane Nate raised fears of substantial shut-ins and disruptions. But then the storm was proving not to be as bad as feared and oil prices reversed and fell sharply especially on Friday losing roughly 3%. That has helped push WTI oil back under its 200-day MA. It may be that the breakout that appeared to get underway back in mid-September will be all for naught and the downtrend will resume. WTI oil needs to fall a bit further to suggest that the downtrend might resume. A break under $48 would be a start but a breakdown under the 31-August-2017-low of $46.58 would seal it. We would then start looking at the June lows near $42 once again. A break back above $51.50 would suggest that there was still more upside potential.
GLOSSARYTrends Daily – Short-term trend (For swing traders) Weekly – Intermediate-term trend (For long-term trend followers) Monthly – Long-term secular trend (For long-term trend followers) Up – The trend is up. Down – The trend is down Neutral – Indicators are mostly neutral. A trend change might be in the offing. Weak – The trend is still up or down but it is weakening. It is also a sign that the trend might change. Topping – Indicators are suggesting that while the trend remains up there are considerable signs that suggest that the market is topping. Bottoming – Indicators are suggesting that while the trend is down there are considerable signs that suggest that the market is bottoming.
|
(Featured image by Núria via Wikimedia Commons. CC BY-SA 2.0)
—
DISCLAIMER: David Chapman is not a registered advisory service and is not an exempt market dealer (EMD). We do not and cannot give individualized market advice. The information in this newsletter is intended only for informational and educational purposes. It should not be considered a solicitation of an offer or sale of any security. The reader assumes all risk when trading in securities and David Chapman advises consulting a licensed professional financial advisor before proceeding with any trade or idea presented in this newsletter. We share our ideas and opinions for informational and educational purposes only and expect the reader to perform due diligence before considering a position in any security. That includes consulting with your own licensed professional financial advisor.

-

 Crowdfunding2 weeks ago
AWOL Vision’s Aetherion Projectors Raise Millions on Kickstarter
-

 Impact Investing6 days ago
Italy’s Listed Companies Reach Strong ESG Compliance, Led by Banks and Utilities
-
 Impact Investing2 weeks ago
BNP Paribas Delivers Record 2025 Results and Surpasses Sustainable Finance Targets
-

 Impact Investing3 days ago
CDP Approves €1.5 Billion Package to Boost Industry, Renewables, and International Development





You must be logged in to post a comment Login