Markets
Gold Dips as Stocks and Oil Surge Amid Inflation and Sanctions
Gold fell sharply this week, echoing 2013’s drop, though not as severely. Despite fears of a top, gold remains a safe haven amid global debt. Strong earnings lifted stocks to new highs as inflation met expectations, pressuring gold. Oil surged 7% on Russian sanctions, while markets stayed resilient, with the MAG7 climbing again.

We remember (painfully) April 12–15, 2013. Over those two days, gold fell $208 or 13.3%. It triggered a two-year bear market that didn’t bottom until December 2015, down another 23% from the April 12–15 crash. Silver and the gold stocks suffered even more. Before that, gold had already fallen roughly 19% from its high of $1,920 seen in September 2011.
Gold’s bear continued even after the December 2015 low, although the low was never taken out. Overall, gold didn’t begin a more sustained rise until 2018 and only really took off after a low in September 2022. After that low gold gained over $2,700 or 171% until the recent high.
Gold fell an astounding $232 on October 21, 2025, paling the dollar drop in 2013. However, it was only 5.3%. Again, silver and the gold stocks suffered even more. Before that gold had been up $1,757 in 2025 or 67%. Silver was up even more and numerous gold stocks were up over 100%. For almost three months we witnessed the most overbought conditions we had ever seen gold and the widest margin with the 200-day MA. Was it an accident waiting to happen?
So, what happened? After all, since that low in 2022 gold had soared over $2,700. What was driving it? Gold is the safe haven from geopolitical uncertainty (Israel/Hamas, Russia/Ukraine), domestic political uncertainty (Trump), and economic uncertainty (inflation, currency weakness, trade wars, sanctions). While gold pays no interest, central banks have been lowering interest rates, thus making gold more attractive. Central banks have been replacing their holdings of U.S. treasuries with gold. The U.S.’s $38.0 trillion in debt is making investors nervous. But it is not just the U.S. – the entire G7 carries too much debt, led by Japan.
Collectively, the G7 countries have $58.3 trillion of debt with an average debt/GDP ratio of 125%. There is considerable concern about the potential for a sovereign debt crisis. While that’s unlikely to happen with a G7 country, both France and the U.K. have been mentioned as needing IMF bailouts. The countries most frequently cited as needing IMF bailouts or being at risk of default are Pakistan, Ghana, Sri Lanka, Bangladesh, Venezuela, and Argentina.
Some countries such as Venezuela, Belarus, Lebanon, and Sri Lanka are already in default. Other high-risk countries include Russia, Ukraine, and Tunisia. The world is awash in debt. According to the International Institute of Finance’s (www.iif.com) Global Debt Monitor, total global debt is now $338 trillion, an incredible 297% of GDP. The U.S. alone has in total $105.0 trillion of debt (governments, corporations, households) with a debt/GDP ratio of 333%. Is that sustainable? The complaint might be about government debt but corporate and household debt are both also a problem.
But what of gold? The October 21, 2025 mini-crash saw gold, silver, and the gold stock indices (Gold Bugs Index (HUI), TSX Gold Index (TGD)) leave large bearish engulfing patterns on the charts. That normally suggests that, at minimum, a further decline should take place. But within 24 hours all were bouncing back, having found a zone of support for the gold stock indices near their 50-day MA while gold found support at $4,000/$4,100 and silver near $48. To overcome the bearish engulfing pattern, all must once again regroup and move to new highs. Otherwise, we would most likely fail the recent record highs (Gold – $4,382, Silver – $54.49, HUI – 693 and TGD – 821).
Irrespective of this, the longer outlook for gold and the precious metals remains the same. The expectation is that the reasons we climbed to record highs have not really gone away and could even intensify. The Israel/Hamas ceasefire is already on shaky ground, while the chance of any ceasefire between Russia/Ukraine is slim.
Adding to the uncertainty over Russia/Ukraine, the U.S. placed further sanctions on Russian oil companies Rosneft PJSC, and Lukoil PJSC. The fear is that India and China may be forced to cut back on buying Russian oil, thus increasing the demand for oil elsewhere. WTI oil has leaped over $5 as a result. And it has sparked a rebound for gold and the precious metals. Global oil supply may be plentiful, but it could spark some shifts in where China and India get their oil.
Nonetheless, the drop on October 21 for gold, silver, and the gold stocks came against the backdrop of the potential for the U.S. and China to resume trade talks and a severely overbought market that, when it started falling, triggered stops and momentum selling. But, for the longer term, there is nowhere to go but up. Yes, investors keep buying U.S. treasuries and other G7 countries’ bonds, but the reality is there is so much debt out there. Either it has to be debased or inflated away. As a result, interest rates should remain high. Some say the G7 bond markets are now uninvestible. So where to park cash? Gold.
Except gold still makes up only a small percentage of global assets, estimated for investors at under 1% (bars, coins, and ETFs). In 1960 it was supposedly upwards of 5%. Some put the percentage even lower, closer to 0.5%. As for the central banks, their share of gold in their reserves is around 23%. Central banks have been buying gold to shore up their reserves and to protect their currency. Major buyers have included Russia and China.
The following chart shows that China’s reserves have gone up from roughly 400 metric tonnes back in 2000 to over 2,300 metric tonnes today. Some believe it’s actually higher. On the other side, China has been reducing its holdings of U.S. treasuries, down $46 billion to $730 billion in the past year and down from a peak over $1 trillion. Central banks’ holdings of gold now exceed the value of their holdings of U.S. treasuries. The rise in the price of gold in 2025 has been a major contributor beyond their ongoing purchases.
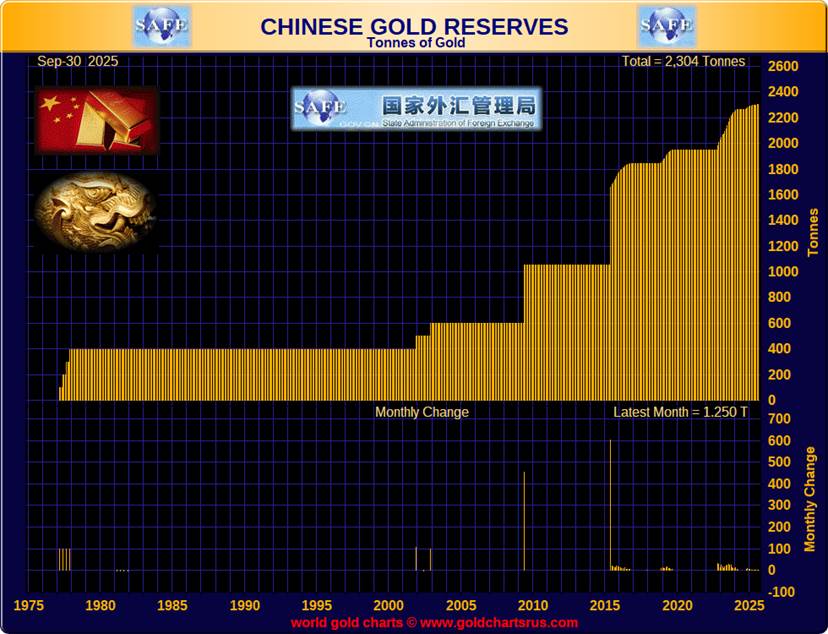
Source: www.goldchartsrus.com
With geopolitical concerns potentially pushing the price of oil higher, climate change negatively impacting crops, supply disruptions, trade wars, and sanctions, inflation is not likely to come down and, if anything, could start to rise again. This puts a lot of pressure on central banks, making it harder for them to lower interest rates in the event of further signs of a slowing global economy. Stagflation comes to mind. A reminder that inflation is a combination of rising demand (demand/pull), cost-push when costs keep rising and wages are fighting to keep up, government monetary and fiscal policies, and supply shocks.
Thus, it is no surprise that purchasing power keeps on falling. That is best seen by looking at the purchasing power of the U.S. dollar as measured by gold. In 1933, before the U.S. government revaluation of gold in 1934, US$1,000 purchased 48.4 ounces of gold. Today, US$1,000 purchases only 0.24 ounces of gold, a loss of 99.5% in purchasing power. We’ve shown this chart before, but it is worth showing again to emphasize how far purchasing power has fallen.
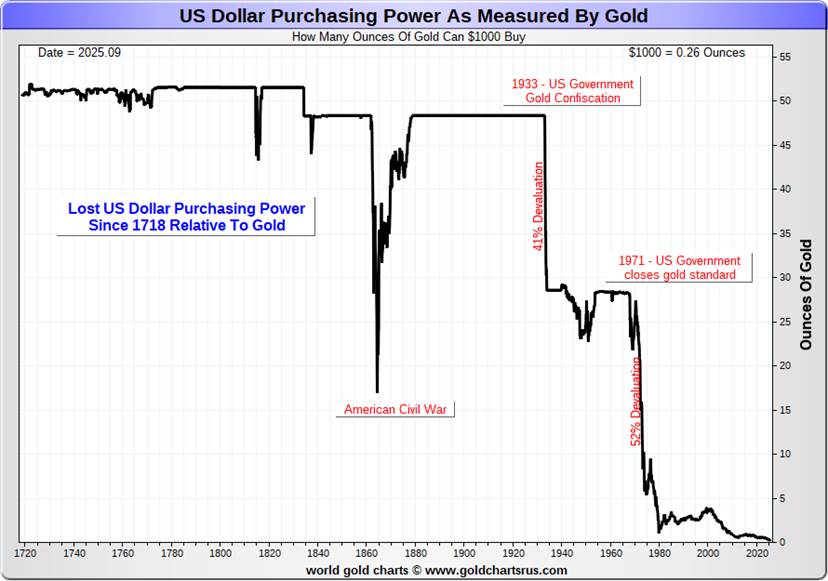
Source: www.goldchartsrus.com
Gold has been on a major tear since 2023 and has gone parabolic. Even the weekly and monthly charts are overbought. The overbought levels are not sustainable without a correction. Have we now entered a correction period? Our weekly chart below suggests that, since that low at $1,614 in 2022, we may have completed the third wave up with waves 4 and 5 to come. Since the 2022 low we have generally held the 13-week MA, currently near $3,700. That remains a potential target on any correction. Cycle-wise, we are due for the 31-month low (in a range of 28–34 months) although that is more likely next year.
The last 31-month cycle appears to be October 2023 at $1,809. From the major December 2015 low, we saw lows in August 2018 – 32 months, March 2021 – 31 months, and October 2023 – 31 months. The next 31-month cycle is not due until mid-2026, centred around May 2026 with a range of February to August. There is also the possibility of a low in November/December before we move to new highs once again. The current bearish patterns on gold, silver, and the gold stock indices suggest we should go to a correction at this point. New all-time highs will end that.
We are living in a destabilized world. Too much debt makes holding debt potentially dangerous. The stock market is grossly overvalued on a number of measures: PE ratios, price to sales, price to book value, and the Buffett Indicator (stock market valuation/GDP). It’s not too late to add some gold to your portfolio. Gold has been around for over 3,000 years as money and currency. It has no liability and it can’t be destroyed.
Gold Weekly Chart 2015–2025
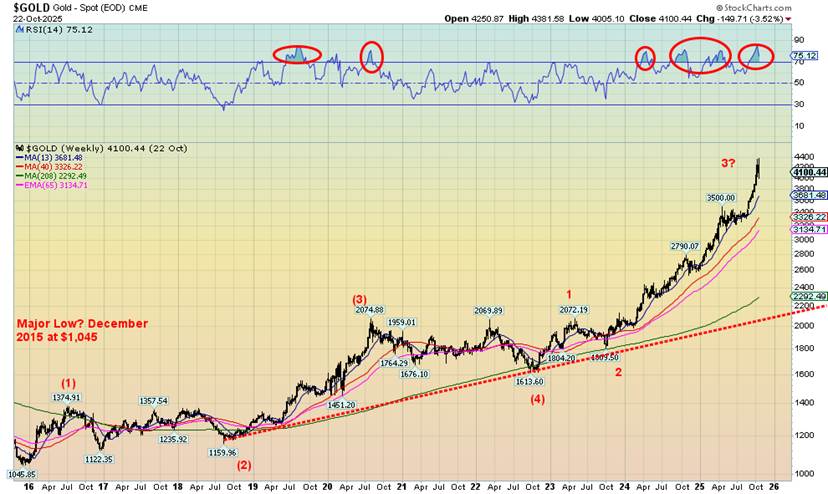
Source: www.stockcharts.com
Chart of the Week
Inflation
U.S. Inflation Rates 2015–2025
Source: www.tradingeconomics.com, www.bls.gov
Both the U.S. and Canada released the September inflation rates this week. The release of the U.S. inflation was a surprise, although delayed, given that the numbers come from the Bureau of Labour Statistics (BLS), the same department that releases the monthly job numbers. A surprise because the BLS is caught up in the government shutdown that has gone on now for more than three weeks or 26 days. The record is 35 days and many believe we will surpass that number.
Both Canada and the U.S. experienced a slight uptick in the rate of inflation. First, the U.S. CPI year over year (y-o-y) came in at 3%, up from 2.9% the month before. But it was below the forecast of 3.1%. Inflation increased for energy, including fuel oil and natural gas (NG). A slight downtick was noted for food prices and used cars and trucks. A slowdown was noted for the core inflation (ex-food and energy) rate y-o-y that came in at 3% when last months was 3.1% and the expectation was 3.1%. Maybe not surprisingly, the stock market loved it and rallied with the S&P 500, registering new all-time highs. U.S. treasuries were steady.
Because both the CPI and the Core CPI came in slightly below expectations, the market remained optimistic that the Fed will cut its key Fed rate to 4.00% from 4.25% at the FOMC meeting on October 28–29. Expectations are high the Fed will also cut at the December 17–18 meeting. The reaction was positive with the S&P 500 rising to new highs.
Our chart suggests that inflation could be bottoming in both Canada and the U.S. Normally we’d say wait until next month to see what it brings, but the White House has already announced that there will be no numbers next month. That suggests that the shutdown is already planned to continue into December. It also makes these numbers that much more important.
Canada Inflation Rates 2015–2025
Source: www.tradingeconomics.com, www.statcan.gc.ca
Canada’s y-o-y inflation jumped to 2.4% in September, up from 1.9% in August and above expectations of 2.3%. The core inflation (ex-food and energy) also rose to 2.8% up from 2.6% in August and above the expected 2.7%. Key to the rise was food prices, up 3.8% vs. 3.4% in August, and household operations, up 2.4%, along with recreation, up 1.6% vs. 0.5%. Key rises for food prices were in vegetables, sugar, and confectionery. Over 50% of vegetables and 75% of fruits eaten in Canada are imported.
Sugar and confectionery are almost exclusively imported. The TSX rallied but did not make new highs. The Bank of Canada (BofC) interest rate decision is also next week on October 29 and is expected to drop to 2.25% from 2.5%. Some believe the uptick in inflation will cause the BofC to hesitate.
In many respects it is not surprising to see what appears to be an uptick in inflation. We are reminded that during the 1970s inflation rose from 1972 to 1974 and then fell into 1976. Inflation then began to rise again into 1980. For both times, sharply rising energy prices played a major role. This time inflation rose from 2020 to 2022 and then began to fall again. It is only recently that inflation has leveled out and begun an uptick.
Will it explode as it did in the 1970s? Energy prices could be key. Severe weather sparking storms, droughts, and more are playing serious havoc with global food production.
Michigan Consumer Sentiment and Michigan 5-year Inflation Expectations 2015–2025
Source: www.tradingeconomics.com, www.umich.edu
Irrespective of the recent inflation numbers, consumers’ 5-year expectations of inflation rose to 3.9% following an estimate of 3.7%. Meanwhile, consumer sentiment sunk again, falling to 53.6 in October after early estimates put it at 55.0. That’s just above the May low of 52.2. and not far from the all-time low of 51.5 seen in July 2022. Consumer sentiment continues to drag along the lows seen during the 1980–1982 recession and the 2007–2009 Great Recession and financial crisis. And we are not even in an official recession, yet.
Inflation ticked higher but was softer than expected. The reasons for inflation are not going away. Wars, sanctions, trade wars, tariffs, severe weather, supply disruptions, and labour issues are all major contributors. Although surprisingly, in the U.S., companies are actually trying to hold off on raising prices. But for how long will that last? Add in monetary inflation from governments’ monetary and fiscal policies as they try to keep the economy’s head above water.
Keeping monetary policy too easy (i.e., quantitative easing or QE and low interest rates) contributes to inflation, seen especially in the stock market. Nonetheless, money supply growth has been slowing so that is less of a factor. Not so fiscal deficits, particularly in the U.S., as the deficit is expected to widen. In the U.S. it is already 6% of GDP. Canada’s deficit is also expected to rise, given the government’s move to fund defense. However, Canada’s budget deficit to GDP is a lot lower at 2%, although that might rise slightly. Fiscal policy of deficits does put upward pressure on inflation. It all might, however, be a losing game.
Markets & Trends
| % Gains (Losses) Trends | ||||||||
| Close Dec 31/24 | Close Oct 24/25 | Week | YTD | Daily (Short Term) | Weekly (Intermediate) | Monthly (Long Term) | ||
| S&P 500 | 5,881.63 | 6,791.69 (new highs) * | 1.9% | 15.5% | up | up | up | |
| Dow Jones Industrials | 42,544.22 | 47,207.12 (new highs) * | 2.2% | 11.0% | up | up | up | |
| Dow Jones Transport | 16,030.66 | 15,454.56 | (1.4)% | (2.8)% | down | neutral | up | |
| NASDAQ | 19,310.79 | 23,204.87 (new highs) * | 2.3% | 20.2% | up | up | up | |
| S&P/TSX Composite | 24,796.40 | 30,353.07 | 0.8% | 22.8% | up | up | up | |
| S&P/TSX Venture (CDNX) | 597.87 | 963.72 | (0.2)% | 61.2% | up | up | up | |
| S&P 600 (small) | 1,408.17 | 1,477.54 | 3.0% | 4.9% | up | up | up | |
| MSCI World | 2,304.50 | 2,784.54 | (1.6)% | 20.8% | down (weak) | up | up | |
| Bitcoin | 93,467.13 | 110,785.02 | 4.0% | 18.5% | up (weak) | up (weak) | up | |
| Gold Mining Stock Indices | ||||||||
| Gold Bugs Index (HUI) | 275.58 | 589.91 | (7.4)% | 114.1% | neutral | up | up | |
| TSX Gold Index (TGD) | 336.87 | 704.04 | (6.9)% | 109.0% | neutral | up | up | |
| % | ||||||||
| U.S. 10-Year Treasury Bond yield | 4.58% | 4.02% | 0.3% | (12.2)% | ||||
| Cdn. 10-Year Bond CGB yield | 3.25% | 3.09% | (0.3)% | (4.9)% | ||||
| Recession Watch Spreads | ||||||||
| U.S. 2-year 10-year Treasury spread | 0.33% | 0.53% | (1.9)% | 60.6% | ||||
| Cdn 2-year 10-year CGB spread | 0.30% | 0.71% | (1.4)% | 136.7% | ||||
| Currencies | ||||||||
| US$ Index | 108.44 | 98.87 | 0.5% | (8.8)% | up | down (weak) | down | |
| Canadian $ | 69.49 | 0.7146 | 0.2% | 2.8% | down | up | neutral | |
| Euro | 103.54 | 116.33 | (0.3)% | 12.4% | down | up | up | |
| Swiss Franc | 110.16 | 125.77 | (0.3)% | 14.2% | up (weak) | up | up | |
| British Pound | 125.11 | 133.14 | (0.9)% | 6.4% | down | up (weak) | up | |
| Japanese Yen | 63.57 | 65.45 | (1.5)% | 3.0% | down | down | down | |
| Precious Metals | ||||||||
| Gold | 2,641.00 | 4,110.63 (new highs) * | (2.9)% | 55.7% | up | up | up | |
| Silver | 29.24 | 48.58 | (6.1)% | 66.1% | up (weak) | up | up | |
| Platinum | 910.50 | 1,581.10 | (1.5)% | 73.7% | up (weak) | up | up | |
| Base Metals | ||||||||
| Palladium | 909.80 | 1,442.00 | (3.5)% | 58.5% | up | up | up (weak) | |
| Copper | 4.03 | 5.08 | 2.6% | 26.1% | up | up | up | |
| Energy | ||||||||
| WTI Oil | 71.72 | 61.47 | 6.8% | (14.3)% | neutral | down | down | |
| Nat Gas | 3.63 | 3.36 | 12.4% | (7.4)% | up | up (weak) | neutral | |
Source: www.stockcharts.com
Source: www.stockcharts.com
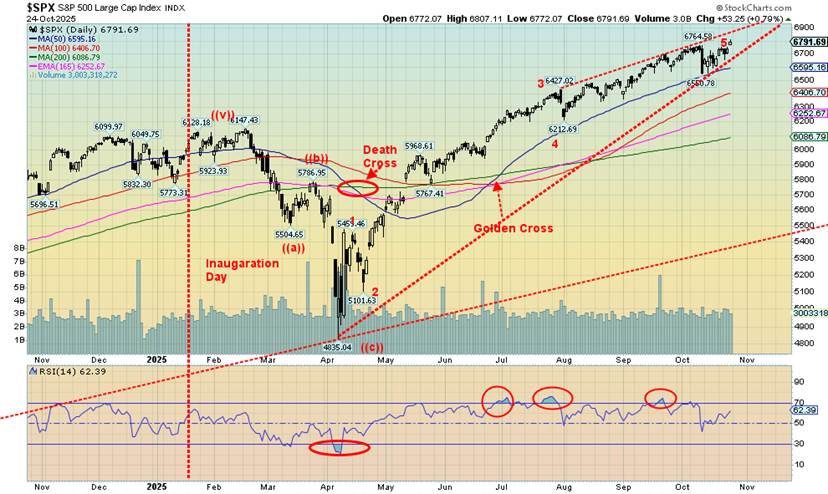
A stock market setback? Fuhgeddaboudit. Once again, the stock markets shook off a temporary down blip and have roared back to new all-time highs. Who cares about trade jitters. Corporations continue to post good earnings, oil prices are low, and inflation data came in somewhat benign this past week. The response? Buy, buy, buy. On the week, the S&P 500 rose 1.9%, yes, to new all-time highs again. The Dow Jones Industrials (DJI) joined the party also to new all-time highs up 2.2% and the NASDAQ joined as well, up 2.3%. Not so the Dow Jones Transportations (DJT).
Nope, it fell down 1.4%. Others that joined the all-time high parade were the Wilshire 5000, the S&P 100 (OEX), the NASDAQ 100, the Dow Jones Composite (DJC), and the Russell 1000 and 3000. The S&P 400 (Mid) rose 2.3%, the S&P 600 (Small) was up 3.0%, the S&P 500 Equal Weight was up 1.7% but no new highs, and the NY Fang Index was up 2.4% to new highs. Bitcoin bounced back, up 4.0%, but it remains shy of its all-time highs.
In Canada, the TSX rose 0.8% dampened by Materials, Golds, and Metals having a down week, while the TSX Venture Exchange (CDNX) fell 0.2%. In the EU, the London FTSE hit all-time highs, up 3.1%, as did the EuroNext, up 1.5%. The Paris CAC 40 did not hit all-time highs but was up 0.6% with the same for the German DAX, although it did gain 1.7%. In Asia, China’s Shanghai Index (SSEC) hit new 52-week highs, up 2.9%, the Tokyo Nikkei Dow (TKN) did make all-time highs, up 3.6%, but Hong Kong’s Hang Seng (HSI) fell short, although it did gain 3.6%. All in all, a good week for stocks and the stock indices.
Of the MAG7 stocks and the FAANGs, we note Apple made all-time highs, up 4.1%, Snowflake also made all-time highs, up 7.1% as did Advanced Micro (AMD), up 8.5%, and CrowdStrike was up 8.8%. MAGS, the MAG7 ETF, also made all-time highs, up 2.4%. The train just keeps on chugging and the records keep falling.
Here we are into late October and no high has been made. It turns out that may not be as unusual as we thought. We note the year high was made on the close of 2013, December for 2014, late November after the 2016 election, December 2019, and December 2020. Maybe the October period is not so magical after all for corrections. Nonetheless, the market is overvalued and numerous indicators are flashing caution, if not sell. However, strong earnings, no major fallout yet from the tariffs, and benign inflation all help the markets move higher. Until they don’t.
The MAG7 and some other high-tech stocks continue to lead the way. The top 10 stocks in the S&P 500 make up 40% of the index while just five make up 25% of the index. Nvidia alone makes up over 8% of the index. They will keep on rising, until they don’t. Then we suspect we’ll be in some trouble.
The break point now is under 6,700, although we’d hold out for 6,600. Otherwise, the records just keep on falling with no end yet in sight.
The Scorecard
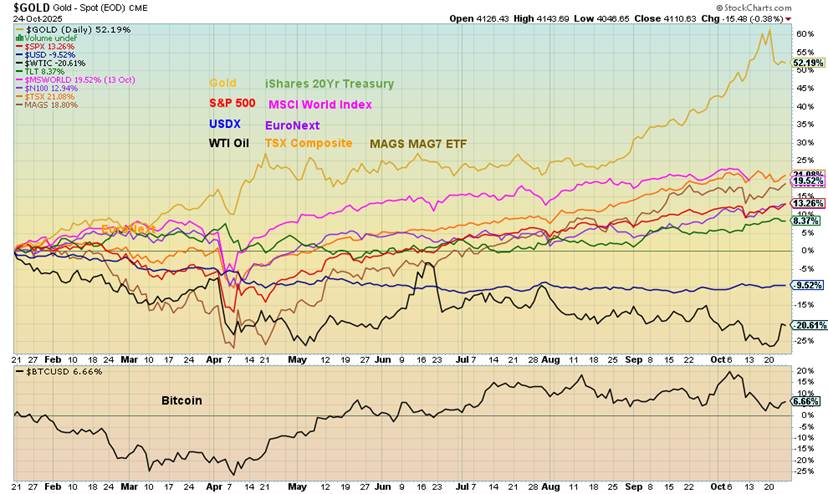
Selected Performance Since Inauguration Day 2025
Source: www.stockcharts.com
It has been useful tracking the performance of selected indices since the inauguration of Trump as it is somewhat of a poll on him. It’s no surprise that gold remains in the lead, up 52% despite the pullback this past week. We believed from the start that gold should do well under Trump, largely because of expected chaos both politically and economically. After all, one only has to look at the interior of Mar-a-Lago and the White House to see them brimming with gold. Of course, it is fake gold – gold leaf, gold paint, and gilded finishes. WTI oil brings up the rear, down 20.6%, and the US$ Index is down 9.5%. Trump wants a lower dollar and lower oil prices.
Source: www.stockcharts.com
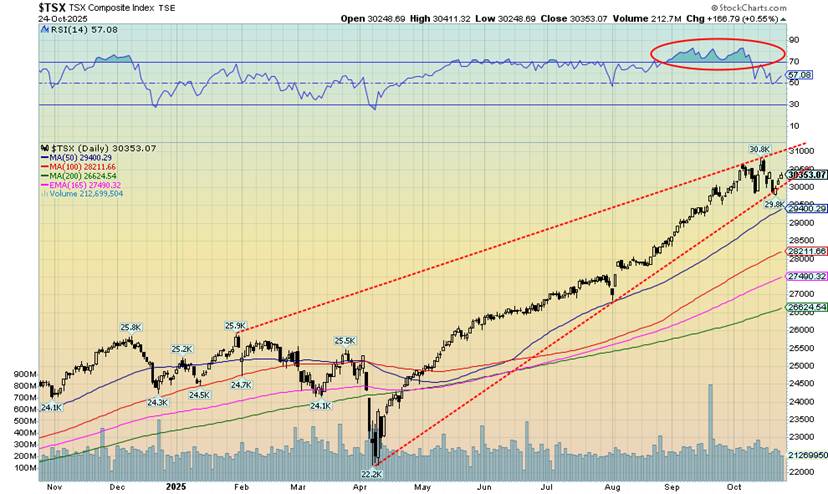
For a change the TSX did not make new all-time highs this past week. What led the market up helped stymie the big rise for the TSX. Materials, Metals, and Golds have been the big winners. This week they faltered with Golds (TGD) down 6.9%, Metals (TGM) off 4.0%, and Materials (TMT) down 4.9%. If there were any big winners on the week, it was Information Technology (TTK), up 4.0%, and Energy (TEN), up 3.5%. Oddly, the TSX Financials (TFS) was up almost 2.0% but failed to make new highs. On the week, the TSX Composite gained 0.8% while the TSX Venture Exchange (CDNX) wobbled, thanks to weakness with junior gold stocks, which fell 0.2%.
We wouldn’t be surprised if the TSX started a correction. We fell, then rose, then fell again, and now we are starting another rise. New highs above 30,800 would keep the party going but a breakdown under 29,800 could send us lower. We are on the cusp of breaking that uptrend line from April 2025. It looks a little like an ascending wedge which is bearish. If we break down, we could in theory fall back to 27,000, an 11% drop from current levels. We’re overdue for a correction.
U.S. 10-year Treasury Note, Canada 10-year Bond CGB
Source: www.tradingeconomics.com, www.home.treasury.gov, www.bankofcanada.ca
Thoughts are dancing in the bond bulls’ heads that the Fed cutting rates this coming week could help push bond yields even lower. Bond yields have been on a downward trend for the past five or six months. This past week the U.S. 10-year Treasury note was actually flat, ticking up to 4.02% from 4.01%. Canada went the other way with the Canadian 10-year Government of Canada bond (CGB) falling to 3.09% from 3.10%. Very small moves.
So not a lot to say here as the 10-year note continues to hold near 4.00%. We have to await news that could move the bond yields one way or another. A good move under 3.90% for the 10-year would signal lower yields. Above 4.20% could signal a further rise in yields. Hanging over this is the humungous U.S. debt of $38 trillion and counting. Surprisingly, bond demand at auctions has not shown signs of huge strain – yet.
Source: www.stockcharts.com
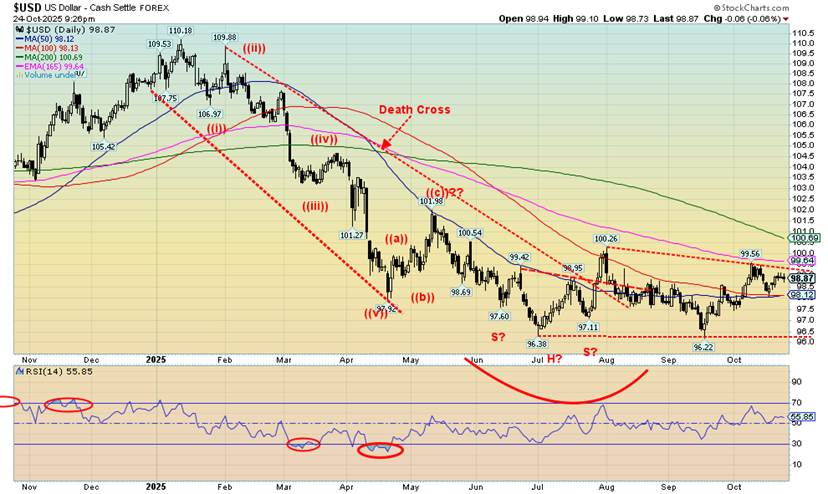
Another week, and little movement in the currencies. The US$ Index rose 0.5% this past week, the euro fell 0.3%, the Swiss franc was off 0.3%, the pound sterling was down 0.9%, and the Japanese yen, the biggest loser, was down 1.5%. Canada was spared as the Cdn$ gained 0.2%. We continue to trade in what looks like a consolidation pattern that could in theory be either a top or a bottom. If a bottom, the US$ Index breaks out above 99.50 and if a top, breaks down under 96.00. The US$ Index doesn’t know which way to go.
The Fed will probably cut rates this week, a negative for the dollar, but signs remain that the economy still might be stronger than expected and a stock market once again at record highs. Trade is still an issue with Trump supposedly to meet with Xi of China; however, all trade negotiations with Canada have been cut off due to a flap over an ad placed by Ontario Premier Doug Ford using an old Ronald Reagan clip where he slammed tariffs. Ontario is suffering the most during this trade war with the U.S. Trump called the ad fake and an interference with U.S. decisions. Trump then slapped an additional 10% tariff on Canada.
Source: www.stockcharts.com
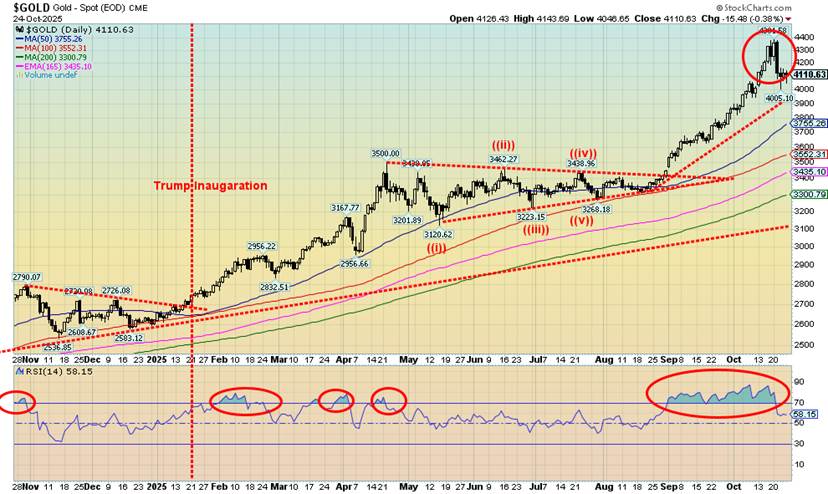
After a nine-week winning streak, gold could be excused for finally taking a break. The drop was overdue, as we had noted the prolonged period of gold being overbought. On the week, gold fell 3.2% and silver dropped 6.1%. Both remain well up on the year, with gold +55.2% and silver +66.1%. Elsewhere with the other metals, platinum fell 1.5%, palladium was down 3.5%, but copper jumped 2.6% as supply disruptions hit the metal. The collapse of a mine in the Dominican Republic, along with issues sparking closures in Indonesia and Chile, moved copper higher.
It’s been a remarkable year so far for both gold and silver and the gold stocks. The gold bugs might say it’s about time. Since last November 2024, gold is up almost 62%. On the year, gold is up 55.2% and silver even more, up 66%. The gold stocks, the Gold Bugs Index (HUI), and TSX Gold Index (TGD) are both up over 100% in 2025. Many individual stocks are up even more. However, a correction was overdue as the overbought conditions had persisted since August.
Gold turned lower, despite weaker than expected inflation data and consistent expectations that the Fed will cut rates this week. The US$ Index wasn’t much of a factor as we noted it was up only 0.5%. Gold did make a new all-time high on Monday but then fell some 6% from that level.
The last important low for gold was seen in October 2023. We are now 24 months from that low, well into the current 31-month cycle. That low is not due until next May, give or take a few months. This correction has the look of just that: a correction, given the steep rise since August when we broke out over that triangle. The triangle suggested a target of $3,815 which we surpassed. The next target was $4,050 which we have also surpassed. The next target above could be $4,430. The high so far? $4,381. Not achieving our target is another sign of the correction.
We remain optimistic going forward that despite the drawdown this past week it is just a pause that could last into November, even December. Then another up move should get underway before topping and falling into April/June 2026. Targets in theory could be as high as $4,800.
Source: www.stockcharts.com
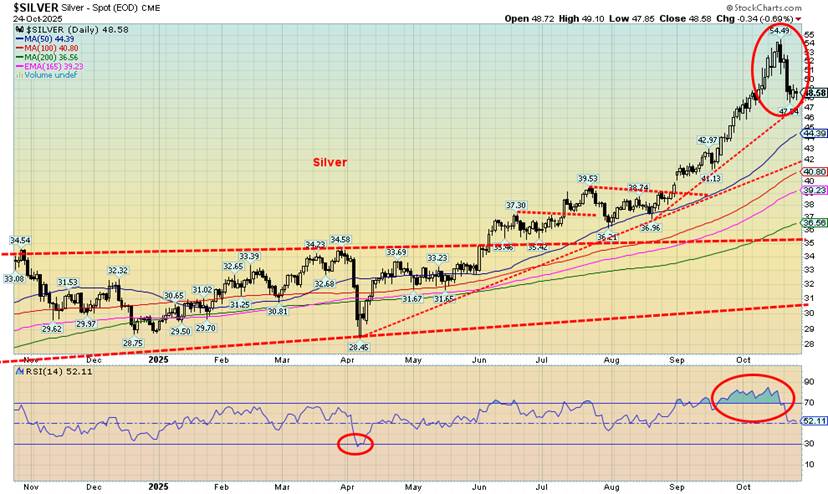
Silver has had a remarkable year, up 66% to date. Demand for silver far outpaces supply. But that didn’t stop a 6.1% decline this past week. Like gold, silver’s price rise has been dramatic and in need of a correction. A massive physical drain of silver from COMEX should have put upward pressure on silver prices. Silver remains in backwardation with the pressure on spot keeping cash prices above futures prices. Silver found support near that uptrend line from the April 2025 low at $28.45. Since that time silver rose a remarkable 91%, despite that hesitation in June through August.
Silver had been making all-time highs, finally taking out the $50 highs seen in 1980 and 2011. On an inflation-adjusted basis, we still have a way to go: $197 based on the 1980 high and $72 based on the 2011 high. The latter now seems to be within the range of possibility. A break of $47 could send silver tumbling further to stronger support at $42. That would be a healthy 22% correction from the highs. We remain friendly towards higher silver prices going forward, but first we need this pause to shake out the weak longs and ease the overbought conditions.
Source: www.stockcharts.com
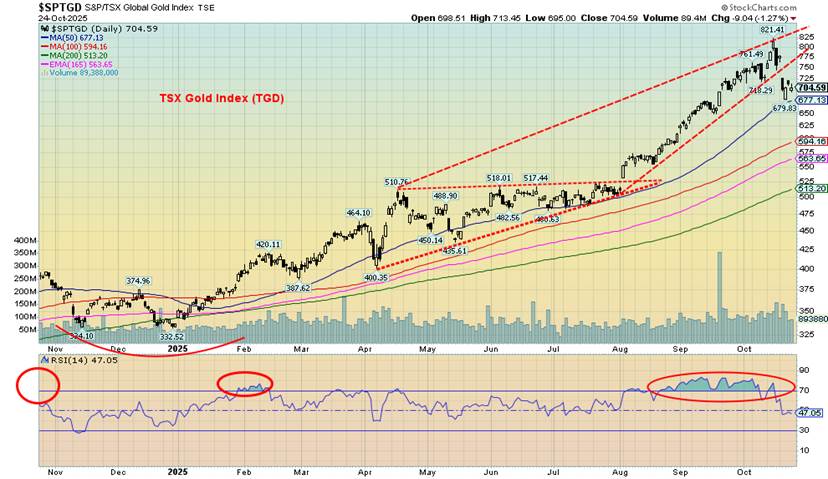
We know – it was overdue. Gold’s corrective decline leaned heavily on the gold stocks. The TSX Gold Index (TGD) fell 6.9% this past week while the Gold Bugs Index (HUI) dropped 7.4%. We note as well softness in the junior developers as a number of them saw profit-taking declines. The gold miners ETF GDX fell 7.5% while the junior gold miners ETF GDXJ was off 8.0%. Still, despite the declines, the TGD is still up 109% in 2025 and the HUI up 114%. It’s been a remarkable year so far for the gold bugs.
But a correction was overdue. The RSI remained in overbought zone for three months. It was an accident waiting to happen. Nonetheless, we don’t view the drop this past week as a disaster. After a long run-up, profit-taking was inevitable. There was no significant upswing in volume. The two indices tested their 50-day MA and the zone held. Any further break could send to the TGD to next support near 590/595 and the HUI near 500.
We’d become concerned if the TGD did break under 590 and the HUI under 500. That could signal a steeper and more prolonged correction. For a change during a record setting year, neither of the TGD or the HUI made new all-time highs this past week.
Source: www.stockcharts.com
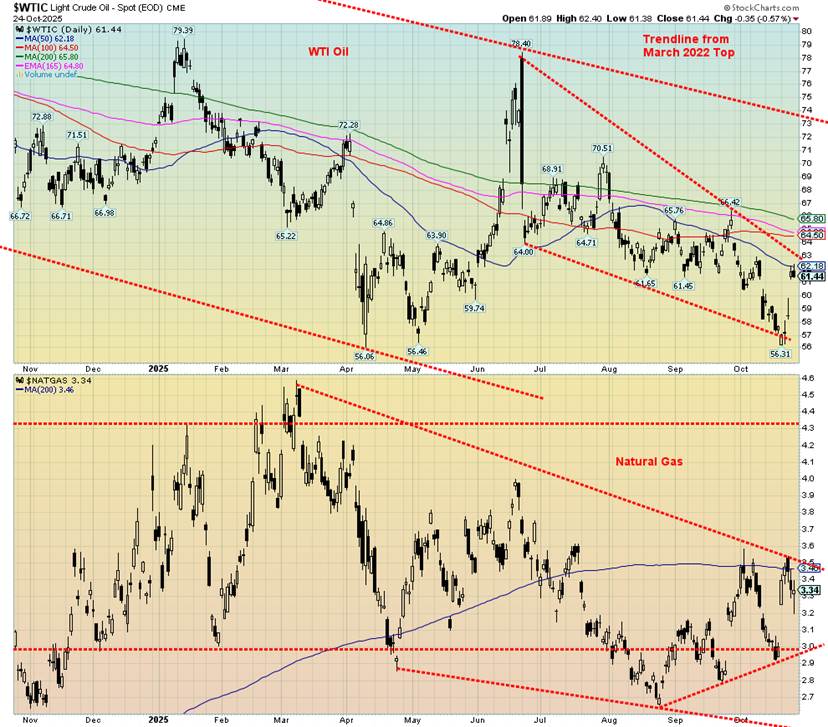
Is oil poised to break out? WTI oil gapped higher on Thursday following Trump’s sanctions against Russia’s two largest oil producers, Rosneft and Lukoil. That helped push WTI oil up to $62 and Brent crude up to $66. The question now Is, how will China and India respond, given they are the two largest purchasers of Russian oil? What the Trump sanctions place at risk are 3.1 million bpd of oil exports. While Thursday gapped higher, follow-through on Friday was muted. Lying above is resistance at $63, $66, $70, and $73. We have a way to go.
A reminder that Russia is the third-largest oil producer, behind the U.S. and Saudi Arabia. Russia also has the seventh-largest oil reserves in the world. Together with its production and reserves of natural gas Russia is an energy behemoth. Given military threats against Venezuela by the U.S. under the auspices of attacking drug cartels, we can’t help but note Venezuela’s role in the global energy market. A threatened attack on Venezuela by the U.S. would be against the world’s 21st largest oil producer. Venezuela produces about 960 thousand bpd.
Its production industry has been beaten down with years of sanctions, neglect, mismanagement, and economic collapse. Venezuela has the world’s largest oil reserves. Environmental and logistic issues also hurt Venezuela, given numerous oil spills and others, along with deteriorating ports, storage, and tankers. Any large-scale attack on Venezuela could help oil prices to soar again, regardless of Venezuela’s smaller output relative to its capabilities.
A gap up is often a sign that, in this case, a low is in. Busting over that downtrend line, currently near $63, would help confirm a low. On the week, WTI oil rose 6.8% while Brent crude was up 7.4%. Not to be left behind, natural gas (NG) finished up 12.4%, but that was down from the highs. Rising demand helped push it up; discovering storage tanks were quite filled helped push it back down. The joy didn’t spread to NG at the EU Dutch Hub, which fell 0.2%. EU storage tanks are quite full. As to the energy stocks, the ARCA Oil & Gas Index (XOI) fell 0.3% but Canada’s TSX Energy Index (TEN) rose 3.5%. Given everything that is going on, it looks like energy stocks are being accumulated.
It’s still early, but oils and NG seasonal strength usually gets underway in December and lasts until June. Any jump in unexpected hurricanes could also help energy prices, particularly NG.
Copyright David Chapman 2025
__
(Featured image by Scottsdale Mint via Unsplash)
DISCLAIMER: This article was written by a third party contributor and does not reflect the opinion of Born2Invest, its management, staff or its associates. Please review our disclaimer for more information.
This article may include forward-looking statements. These forward-looking statements generally are identified by the words “believe,” “project,” “estimate,” “become,” “plan,” “will,” and similar expressions, including with regards to potential earnings in the Empire Flippers affiliate program. These forward-looking statements involve known and unknown risks as well as uncertainties, including those discussed in the following cautionary statements and elsewhere in this article and on this site. Although the Company may believe that its expectations are based on reasonable assumptions, the actual results that the Company may achieve may differ materially from any forward-looking statements, which reflect the opinions of the management of the Company only as of the date hereof. Additionally, please make sure to read these important disclosures.
David Chapman is not a registered advisory service and is not an exempt market dealer (EMD) nor a licensed financial advisor. He does not and cannot give individualised market advice. David Chapman has worked in the financial industry for over 40 years including large financial corporations, banks, and investment dealers. The information in this newsletter is intended only for informational and educational purposes. It should not be construed as an offer, a solicitation of an offer or sale of any security. Every effort is made to provide accurate and complete information.
However, we cannot guarantee that there will be no errors. We make no claims, promises or guarantees about the accuracy, completeness, or adequacy of the contents of this commentary and expressly disclaim liability for errors and omissions in the contents of this commentary. David Chapman will always use his best efforts to ensure the accuracy and timeliness of all information. The reader assumes all risk when trading in securities and David Chapman advises consulting a licensed professional financial advisor or portfolio manager such as Enriched Investing Incorporated before proceeding with any trade or idea presented in this newsletter.
David Chapman may own shares in companies mentioned in this newsletter. Before making an investment, prospective investors should review each security’s offering documents which summarize the objectives, fees, expenses and associated risks. David Chapman shares his ideas and opinions for informational and educational purposes only and expects the reader to perform due diligence before considering a position in any security. That includes consulting with your own licensed professional financial advisor such as Enriched Investing Incorporated. Performance is not guaranteed, values change frequently, and past performance may not be repeated.


The TopRanked.io Weekly Digest: What’s Hot in Affiliate Marketing [++ KuCoin Affiliate Program Review]
X now allows people to block certain topics from their feed. This week, we're going to tell you how to...


Hotel Stay Project Supports Wildlife Conservation in Japan
Iwate Prefecture launched a project linking hotel stays to conservation through Morioka Zoological Park Zoomo. A themed room at Yunomori...


Bitcoin Leads Modest Crypto Rebound Amid Mixed Signals
Bitcoin rose 2 percent to above 77000 as ETFs saw 15 million inflows and April gains of 12.2 percent. Ethereum...


Major Pharma Advances: EU Approvals, Vaccine Progress, and Breakthrough Clinical Results
Johnson & Johnson has EU approval for nipocalimab for generalized myasthenia gravis, showing superior control and sustained benefits. Sanofi reported...


Agential Cannabis 2026 to Drive APAC Market Growth and Global Industry Collaboration
Agential Cannabis 2026 will take place September 23–24 in Bangkok, bringing global experts together to advance the APAC medical cannabis...
 |
|
 |  |
 |
|
-

 Markets4 days ago
Sugar Markets Rise as Global Supply Outlook Strengthens
-
 Crypto2 weeks ago
Bitcoin Holds Steady as Institutions Move In and Crypto Markets Stay Neutral
-
 Crowdfunding1 day ago
Hotel Stay Project Supports Wildlife Conservation in Japan
-

 Impact Investing1 week ago
Closing the Gap: From Climate Commitments to Urgent Action