Markets
Gold, Inflation, and Market Trends: Key Insights This Week
This week, we examine gold depletion at the LBMA, speculation on U.S. gold revaluation to offset debt, and inflation’s impact on insurers like Great-West Lifeco. We also compare gold’s trajectory to 1966-1982. Markets remain optimistic, but signs of a top persist. Despite Friday’s drop, gold still trends higher, while oil struggles.

Is the collapse of the London Gold Pool in 1968 repeating itself? First off, what was the London Gold Pool? It involved eight central banks in the U.S. and Europe that agreed in 1961 to cooperate to maintain the Bretton Woods system of fixed-rate convertible currencies and defend the official gold price of $35/ounce through interventions in the London gold market.
The U.S. provided half of the gold since they also held the world’s largest central bank reserves of gold. Things did stabilize, but then soon became unglued. The price of gold was too low to sustain runs on the British pound and the U.S. dollar. France pulled out and the pool collapsed. A two-tiered system was put in the place with the official price still pegged at $35.
However, that too fell apart as central banks rushed to the U.S. to unload their U.S. dollars for gold. The two-tiered system failed, due to the failure in trying to maintain a fixed rate alongside an open market transactional rate. In August 1971, President Richard Nixon took the world off the gold standard and we entered a period of floating exchange rates and fiat money backed by nothing but the government’s promise to pay. Gold, now free-trading, soared from $35 to $875 by early 1980.
The U.S. dollar collapsed against the European currencies; i.e. deutsche mark, pound sterling, French franc. Interest rates that had been suppressed in the 1970s soared to unbearable levels in order to bring down the high rate of inflation that had dominated the 1970s. After hiking rates to unbearable levels the U.S. dollar began to ascend quickly before peaking once again in 1985 following the Plaza Accords designed to bring down the high U.S. dollar.
So, what’s happening today? Gold has been free-floating now for nearly 54 years. Today it is setting records as we approach US$3,000. That’s a long way from $35. The London gold market is experiencing shortages. Why?
The answer is economic anxiety and sharply increased demand, particularly from Asia. Futures contracts that are normally rolled over or cashed out are instead demanding delivery of the gold. Each futures contract represents 100 ounces of gold. Fearing tariffs and more, traders are rushing to convert to gold and get it out of the U.K. before tariffs hit it. With supplies dwindling in London, there is also a rush for central banks to borrow gold. Apparently, it now takes up to four weeks to get gold out of the Bank of England (BOE) vs. the normal few days or up to a week. Traders want to hedge their position in the NY COMEX market where futures now trade above the London spot market. The pressure is causing gold prices to rise.
Don’t expect this to end any time soon. The following chart shows the LBMA London Gold Holdings. The one to focus on is the available stocks (green). None of the other categories are available for delivery. That includes ETF holdings, BOE holdings, and reserves.
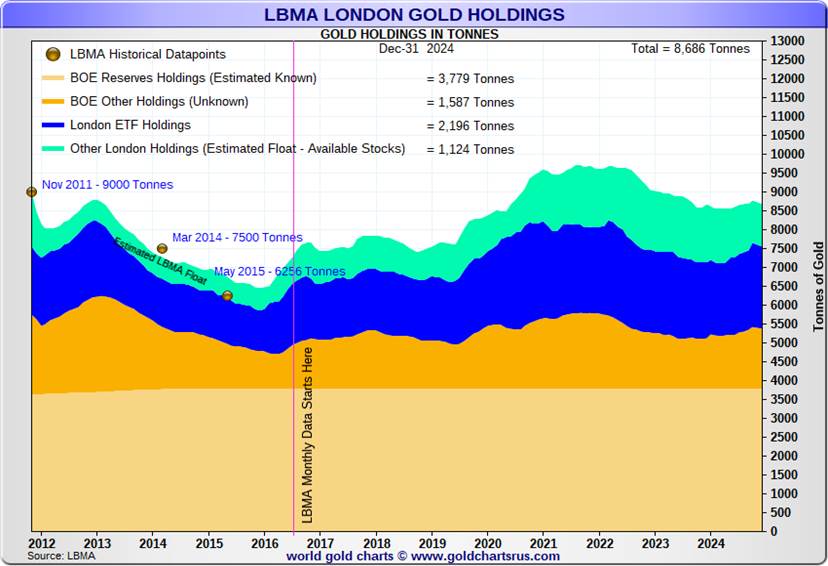
Silver stocks are also being depleted. Again, only the green area is available for delivery. The rest is held in ETFs.

A better picture of the declining gold and silver stocks at the LBMA.
Revaluation of Gold Upward?
There has been talk of late of revaluing gold. With geopolitical tensions rising, domestic political tensions also rising with the surge of right-wing groups, including neo-Nazis, and the U.S. dollar’s dominance under attack, central banks have been stockpiling gold. Many believe it is not a question of if but when gold is revalued in order to monetize the debt. Fiat currencies are under attack. Russia and China and India have been stockpiling gold in order to back their currencies and make a move away from the U.S. dollar. All this has led to talks about a monetary reset and even a new global financial system. Bretton Woods 2? Or is it 3?
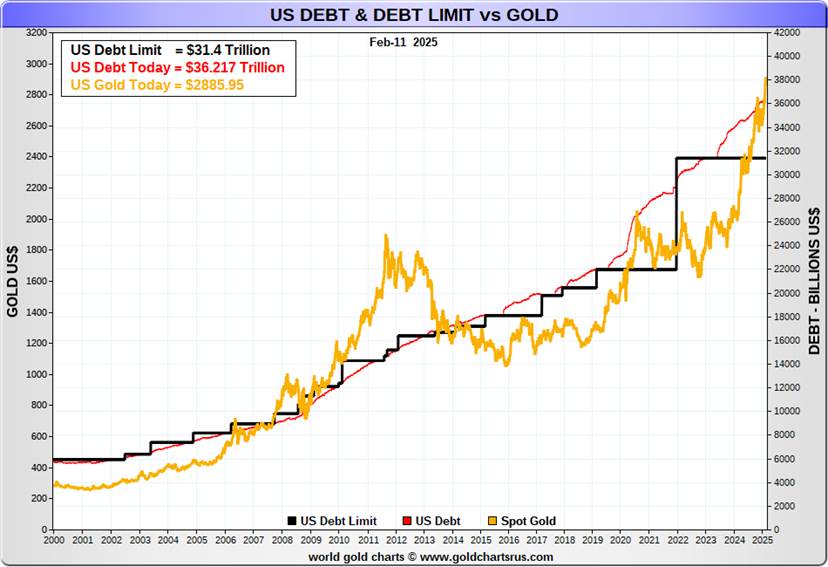
The U.S. has the world’s largest reserves of gold: 8,133.5 metric tonnes or 261,498,926.2 troy ounces. Many would be surprised to learn that the U.S. still carries this gold on its books at $42.20/ounce. That means it has a valuation of $11,041,059,957.90 or $11.0 billion. Based on today’s price of roughly $2,900/ounce, it should be worth $758,346,886,098.90 or $758.3 billion. That’s a long way from the U.S. federal debt of $36.5 trillion.
It is highly unlikely the entire amount would be covered in any revaluation. That would require gold to be priced at over $139,000/ounce (effectively $36.5 trillion/261,498 thousand). More realistic would be to revalue it at 10% of the debt outstanding or $13,950/ounce. That’s a long distance from today’s $2,900.
It is not as if this hasn’t been done before. It happened in the 1930s when gold was revalued up to $35/ounce from $20.67. The gold standard had been abandoned and the world was in the midst of a depression. The Gold Reserve Act of 1934 revalued gold and made it illegal for private citizens, including businesses and banks, to hold gold. Coins were largely exempt. What it did was to devalue the U.S. dollar by increasing inflation.
It also helped set off a mining boom of exploration and increasing production. A reminder that while the Dow Jones Industrials (DJI) was falling 89% from 1929–1932, Homestake Mining (later Barrick Gold) rose 400%. The $35/ounce was later used to peg the conversion of U.S. dollars to gold under Bretton Woods.
We can’t speculate as to whether this will happen. But in a world with growing inflation (stagflation?), tariffs, supply chain issues, currency wars, mining deficits, and central banks accumulating gold, particularly Russia and China, it is all a hedge against growing instability and potential economic chaos.
Is there any problem with this? Backing the U.S. dollar with gold has been done before. It’s the old gold standard. The trouble with that, however, is it makes it difficult to print more U.S. dollars when needed. That was always a constraint under the gold standard. Commercial banks and even central banks recognized its limitations and fought to end the constraints, thus ending the gold standard. Backing the debt could work as long as the price of gold rises with the debt. Since 2000 when that chart gets underway, gold is up 911%. The U.S. federal debt has leaped 538%. It seems that the gold community is already on the case. Too bad the U.S. GDP has gone up only 216% in the same time period.
Inflation Reports
The January inflation reports (CPI, PPI) were out this past week and, in many ways, it was no surprise that they were somewhat worse than expected. January CPI rose 0.5% above the projected 0.3%, with some even calling for it to rise only 0.2%. The core inflation rate also rose up 0.4% vs. the expected 0.3%. How are those prices of eggs? Year over year (y-o-y), the CPI was up 3% above the expected 2.9% while the core rate rose 3.3% above the expected 3.1%.
Then the next day came the PPI, which didn’t disappoint, either. The January PPI rose 0.4% vs. the expected 0.3% while y-o-y it was up 3.5% vs. the expected 3.2%. The core inflation rose 0.3% vs. expected 0.1% while y-o-y the core PPI was up 3.6% vs. the expected 3.3%.
CPI, CPI Core, PPI, Fed Funds (2000–2025)
One of the biggest things that strikes us is that, for most of this period, the Fed funds rate remained below the rate of inflation. It’s only recently that the Fed funds rate has steadily exceeded the rate of inflation. Can that last? It’s hard to say. We are reminded that, throughout the 1970s, the Fed funds rate was also below the rate of inflation; that is, until Fed Chair Paul Volcker hiked rates to 21% in 1980. A severe recession followed from 1980–1982.
President Trump was immediately attacking former President Joe Biden for causing the rate of inflation to jump. Of course, any economist knows that is absurd as inflation is caused by events beyond the president’s control. Fed Chair Jerome Powell was also attacked. But the Fed reacts to events; it does not create them. Raising the debt level is the U.S. Treasury as they move to cover expenditures by Congress by issuing more debt. It’s not the Fed per se that sparks a huge increase in debt spending. It’s the U.S. Treasury in conjunction with Congress approving expenditures that may also have been recommended and approved by the White House administration.
Nonetheless, the uptick in inflation almost guarantees the Fed will remain on hold going forward, regardless of the wishes of the president. The question is, could they raise rates? That’s possible, but only to a further rise in the rate of inflation. Events that could cause inflation to rise are tariffs, the expulsion of illegal immigrants who work in factories, fields, and elsewhere, disease (such as bird flu that sparked a culling of chickens, resulting in higher egg prices), and supply disruptions. Inflation in the developed world also tends to be global. Venezuela, for example, could have very high inflation but it would have little impact on the rest of the world. But inflation in the developed world tends to spread amongst its members.
President Trump wants lower interest rates. But the Fed is an independent body with some political pressure. It does not answer to the president or congress. It is subject to congressional oversight. The shareholders are the large money center banks. But that might not stop an outbreak of hostilities between Jerome Powell and President Trump. Depending on how that plays out, nervous investors in U.S. treasuries could decide to dump treasuries, putting downward pressure on the U.S. dollar and upward pressure on interest rates.
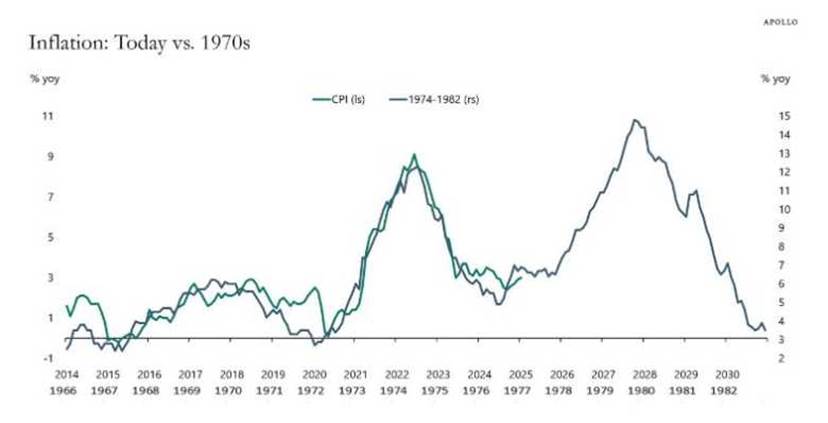
An interesting comparison that we have made before is how today’s inflation seems to be generally following the path of inflation from 1966 to 1982. A chart we found from the Chief Economist of Apollo Global Management (www.apollo.com) compares inflation in the 1970s with today’s inflation. Right now, it looks like today’s inflation has been following the path of that in the 1970s. As noted, will that second spike in inflation occur? So far, that seems to be the case. If so, expect higher, not lower inflation, which in turn could cause the Fed to react by hiking interest rates.
Battles between a president and a Fed Chair tend to not end well. The last one was between President Nixon and Fed Chair Arthur Burns. It occurred in the 1970s, and helped lay the groundwork for higher inflation. Does history repeat itself?
Everyone thought that inflation was subsiding and the economy was weakening. So far, neither seems to be happening. Trump’s victory is raising concerns about inflationary tariffs and tax cuts. If tax cuts are not offset, then that also could keep inflation at current levels. But will DOGE prevail and actually cut expenditures when 70% + of the budget is almost unassailable while the rest is authorized by Congress? Many benefits go to Red States. Would they be cut? That could spark a slowdown. Lawsuits have now become prevalent.
Trump has threatened to ignore the courts, but can he? The word that keeps popping into our heads is stagflation—low growth and rising inflation. In the 1970s, stagflation was generally bad for the stock market but quite positive for gold and commodities.
Below is a chart comparing inflation during 1966–1982 with inflation today from 2014–present. It seems almost on cue that inflation is picking up, just like it did in 1976.
Today’s Inflation (2014–2025) vs. 1970s Inflation (1966–1982)
A Quicky Summary of the Week
Despite all the goings on stock markets were mostly up on they week. Are they still awaiting tax cuts and more to propel things higher? The S&P 500 gained 1.5%, the Dow Jones Industrials (DJI) up 0.6%, the Dow Jones Transportations (DJT) up 2.8% and the NASDAQ gained 2.6%. The S&P 400 (Mid), however, fell off 0.3% while the S&P 600 (Small) fell 0.1%. The S&P 500 Equal Weight Index gained 0.5% while the NY FANG Index spurred on by new all-time highs for Meta, Netflix, and Alibaba also jumped to new all-time highs up 3.1%.
Apple was a big gainer up 7.4%. As to the gold indices the Gold Bugs Index (HUI) was off a small 0.4% as was the TSX Gold Index (TGD). The oil indices gained with the ARCA Oil & Gas Index (XOI) up 1.8% and the TSX Energy Index (TEN) up 0.4%
In Canada the TSX gained a small 0.2% as did the TSX Venture Exchange (CDNX). In the EU the London FTSE hit all-time highs up 0.4%, the EuroNext gained 2.8%, the Paris CAC 40 gained 2.6% and the German DAX made all-time highs up 3.3%. In Asia China’s Shanghai Index (SSEC) was up 1.3%, the Tokyo Nikkei Dow (TKN) gained 1.1% and Hong Kong’s Hang Seng (HSI) jumped 7.0%.
For currencies the US$ Index fell 1.3% continuing its recent weakness. The euro jumped 1.6%, the Swiss franc was up 1.1%, the pound sterling up 1.4% and the Cdn$ gained 0.7%. Only the Japanese yen fell off 0.7%. Gold made all-time highs again up 0.5% despite Friday’s wipeout, silver led up 1.3%, while platinum fell down 0.2%. Palladium gained 2.7% while copper continued upward gaining 1.5%. WTI oil fell 0.4% while Brent crude was up a small 0.1%. Natural gas (NG) was up 12.7% thanks to snowy cold weather while NG at the Dutch Hub fell 10.2%.
Friday was a bit of wipeout for gold, gold stocks and silver. But it appeared to be driven by profit taking that snowballed. Is the gold upswing over? We don’t believe so but recovery this week would help. The stock markets still look iffy and topping but if new highs happen then we’d have to say we are headed higher.
Markets Continue
Selected Performance November 5, 2024–February 13, 2025
Markets continue to be positive with stocks up, gold up, and Bitcoin up. Not doing as well are oil and bonds. The stock market continues to form what we believe is a distribution top pattern. A breakdown for the S&P 500 under 6,000 could prove fatal. But the real points to watch are under 5,700 and especially 5,400. Under 4,900 we officially enter a bear market. Naturally new highs will keep this market alive. The MAG7 are mixed, with some, including Meta and Netflix, doing well others, especially Tesla, not doing so well. Tesla is already in an official bear market.
Bonds are generally languishing with a slight downward bias (yield). The Friday, February 14 release of January’s retail sales was a bit of a shock as sales fell 0.9% when only a 0.1% drop was expected. That helped long bonds. But rising inflation keeps pressure on the Fed to not lower interest rates. Gold is continuing its upward march and we see no signs of a top forming. However, pullbacks, even steep ones, can occasionally be expected.
That’s a sign of strength, not weakness. $2,900 is support, but under $2,700 we’d be concerned. $3,000 is in sight. Silver still languishes, as do gold stocks. However, we are seeing some buying coming into the junior gold mining market. That’s a potentially positive development. Oil prices are trying to find support in the $70 range. There remains the risk of accelerated tensions in the Middle East, particularly surrounding Iran.
Conclusion
Economic instability will continue as the Trump administration appears to wage war on everybody. Tariffs against everybody, followed by retaliatory tariffs (remember the 1930s where trade wars exacerbated the Great Depression), threats against Panama, Greenland, and Canada, deportation of thousands of workers (illegals) which is already causing pain in the agriculture sector and selected factories, firing of thousands of government workers that could cause chaos in delivery of government services and send unemployment up sharply, and nervous business concerning all the economic chaos being inflicted.
Announcements of layoffs at companies are already rising. As well, there is growing concern in the commercial and consumer real estate markets where delinquencies and defaults are rising. Could a banking crisis ensue? Unemployment is a lagging indicator but all signs are now pointing towards rising unemployment.
But so far none of this is negatively impacting stock markets that continue to be overvalued and ignoring the growing reality.
Chaos and volatility, our themes for 2025 continue.
Markets & Trends
| % Gains (Losses) Trends | ||||||||
| Close Dec 31/24 | Close Feb 14/25 | Week | YTD | Daily (Short Term) | Weekly (Intermediate) | Monthly (Long Term) | ||
| Stock Market Indices | ||||||||
| S&P 500 | 5,881.63 | 6,114.63 | 1.5% | 4.0% | up | up | up | |
| Dow Jones Industrials | 42,544.22 | 44,546.08 | 0.6% | 4.7% | up | up | up | |
| Dow Jones Transport | 16,030.66 | 16,606.53 | 2.8% | 4.5% | up | up | up | |
| NASDAQ | 19,310.79 | 20,026.77 | 2.6% | 3.7% | up | up | up | |
| S&P/TSX Composite | 24,796.40 | 25,483.23 | 0.2% | 3.1% | up | up | up | |
| S&P/TSX Venture (CDNX) | 597.87 | 640.26 (new highs) | 0.2% | 7.1% | up | up | neutral | |
| S&P 600 (small) | 1,408.17 | 1,429.84 | (0.1)% | 1.5% | neutral | up | up | |
| MSCI World | 2,304.50 | 2,472.57 | 1.6% | 7.3% | up | up | up | |
| Bitcoin | 93,467.13 | 97,014.64 | 1.0% | 3.8% | down (weak) | up | up | |
| Gold Mining Stock Indices | ||||||||
| Gold Bugs Index (HUI) | 275.58 | 325.89 | (0.4)% | 18.3% | up | up | up | |
| TSX Gold Index (TGD) | 336.87 | 404.26 | (0.4)% | 20.0% | up | up | up | |
| % | ||||||||
| U.S. 10-Year Treasury Bond yield | 4.58% | 4.48% | (0.2)% | (2.2)% | ||||
| Cdn. 10-Year Bond CGB yield | 3.25% | 3.10% | flat | (4.6)% | ||||
| Recession Watch Spreads | ||||||||
| U.S. 2-year 10-year Treasury spread | 0.33% | 0.21% | 5.0% | (36.6)% | ||||
| Cdn 2-year 10-year CGB spread | 0.30% | 0.37% | (5.1)% | 33.3% | ||||
| Currencies | ||||||||
| US$ Index | 108.44 | 106.57 | (1.3)% | (1.7)% | down | up | up | |
| Canadian $ | 69.49 | .7050 | 0.7% | 1.5% | up | down | down | |
| Euro | 103.54 | 104.93 | 1.6% | 1.3% | up | down | down | |
| Swiss Franc | 110.16 | 111.14 | 1.1% | 0.9% | up | down | neutral | |
| British Pound | 125.11 | 125.87 | 1.4% | 0.6% | up | down | neutral | |
| Japanese Yen | 63.57 | 65.64 | (0.7)% | 3.3% | up | neutral | down | |
| Precious Metals | ||||||||
| Gold | 2,641.00 | 2,900.70 (new highs)* | 0.5% | 9.8% | up | up | up | |
| Silver | 29.24 | 32.85 | 1.3% | 12.4% | up | up | up | |
| Platinum | 910.50 | 1,019.20 | (0.2)% | 11.9% | up | up | up (weak) | |
| Base Metals | ||||||||
| Palladium | 909.80 | 1,009.30 | 2.7% | 10.9% | up | up (weak) | down | |
| Copper | 4.03 | 4.66 | 1.5% | 15.6% | up | up | up (weak) | |
| Energy | ||||||||
| WTI Oil | 71.72 | 70.71 | (0.4)% | (1.4)% | down | down (weak) | down | |
| Nat Gas | 3.63 | 3.73 | 12.7% | 2.8% | up (weak) | up | neutral | |
__
(Featured image by PublicDomainPictures via Pixabay)
DISCLAIMER: This article was written by a third party contributor and does not reflect the opinion of Born2Invest, its management, staff or its associates. Please review our disclaimer for more information.
This article may include forward-looking statements. These forward-looking statements generally are identified by the words “believe,” “project,” “estimate,” “become,” “plan,” “will,” and similar expressions, including with regards to potential earnings in the Empire Flippers affiliate program. These forward-looking statements involve known and unknown risks as well as uncertainties, including those discussed in the following cautionary statements and elsewhere in this article and on this site. Although the Company may believe that its expectations are based on reasonable assumptions, the actual results that the Company may achieve may differ materially from any forward-looking statements, which reflect the opinions of the management of the Company only as of the date hereof. Additionally, please make sure to read these important disclosures.
David Chapman is not a registered advisory service and is not an exempt market dealer (EMD) nor a licensed financial advisor. He does not and cannot give individualised market advice. David Chapman has worked in the financial industry for over 40 years including large financial corporations, banks, and investment dealers. The information in this newsletter is intended only for informational and educational purposes. It should not be construed as an offer, a solicitation of an offer or sale of any security. Every effort is made to provide accurate and complete information.
However, we cannot guarantee that there will be no errors. We make no claims, promises or guarantees about the accuracy, completeness, or adequacy of the contents of this commentary and expressly disclaim liability for errors and omissions in the contents of this commentary. David Chapman will always use his best efforts to ensure the accuracy and timeliness of all information. The reader assumes all risk when trading in securities and David Chapman advises consulting a licensed professional financial advisor or portfolio manager such as Enriched Investing Incorporated before proceeding with any trade or idea presented in this newsletter.
David Chapman may own shares in companies mentioned in this newsletter. Before making an investment, prospective investors should review each security’s offering documents which summarize the objectives, fees, expenses and associated risks. David Chapman shares his ideas and opinions for informational and educational purposes only and expects the reader to perform due diligence before considering a position in any security. That includes consulting with your own licensed professional financial advisor such as Enriched Investing Incorporated. Performance is not guaranteed, values change frequently, and past performance may not be repeated.


TopRanked.io Weekly Affiliate Digest: What’s Hot in Affiliate Marketing [1xBet Affiliate Program]
If you thought nobody liked cricket, then this week, we're proving you wrong. And by the time we're done, you'll...


Tether Seeks Big Four Audit to Boost USDT Transparency
Tether, issuer of USDT, plans a full audit by a Big Four firm to address transparency concerns over its $184...


H&M Advances Sustainability and Cuts Emissions by 2025
H&M Group reported that by 2025, 91% of materials were recycled or sustainably sourced, with recycled content reaching 32%. Emissions...


NHS Funds Breakthrough CAR-T Therapy Breyanzi for Lymphoma Treatment in Spain
Bristol Myers Squibb announced NHS funding for CAR-T therapy Breyanzi, enabling its use from April 1st in Spain for lymphoma...


Crypto Markets Volatile as Bitcoin Hovers, Solana Eyes AI Integration
Crypto markets remain volatile amid the Iran war, with Bitcoin near $70,000 and ETF inflows improving outlook. Ethereum faces declines...
 |
|
 |  |
 |
|
-

 Crypto1 week ago
Crypto Markets Now Steady as Fed Decision Looms
-

 Biotech4 days ago
Italy’s Pharmaceutical Sector Drives Innovation, Sustainability, and European Leadership
-

 Markets2 weeks ago
Oil Surge Sparks Market Turmoil and Shadow Banking Fears
-

 Crowdfunding1 day ago
Crowdfunding Evolves into Core Financial Infrastructure in Europe