Markets
Gold, Liquidity, and Market Complacency Heading Into 2026
Precious metals shone as the Santa Claus rally fizzled, a weak signal that hasn’t always mattered. In 2025, stocks rose while the K-shaped economy worsened. Liquidity surged as QE replaced QT, breeding complacency. Gold proved its haven. Energy lagged, yet divergences hint 2026 upside. VIX complacency and rising unemployment challenge markets despite odds against them.

If we were to describe the world of 2025 in one word, it would be “divided.” Divided – economically, financially, politically, geopolitically, and socially. At the center there would be climate change as it fits into all the categories.
Economic – supply chain interruptions, reshoring, formation of economic blocs, growth and inflation, control of critical minerals and AI
Financial – humungous debt, tightening liquidity, different asset performance, declining sentiment, rising costs of climate change
Political – polarization, the rise of authoritarian governments, decline of democracy, lack of consensus, unstable coalitions
Geopolitical – a multipolar world, breakdown of the global world order, sanctions, trade barriers, rich countries vs. poor countries, risk of global war
Social – generational divides, urban-rural divides, massive information overload, misleading information and disinformation, inequality (i.e., the richest 1% hold 45% of global assets). One man, Elon Musk, is now listed as having a net worth of $744.6 billion (according to Forbes Billionaires List), making him effectively the 22nd largest country in the world. The top five wealthiest men (yes, they’re all men) are collectively worth $1.7 trillion, making them equivalent to the 16th largest country in the world. The bottom 50% hold less than 2% of global assets.
Global Debt vs. Global GDP
| Year | Global debt $trillions | Global GDP $trillions | Debt/GDP % |
| 2000 | $90 | $33.9 | 265% |
| 2020 | $275 | $85.9 | 320% |
| 2025 (est.) | $335 | $114.0 | 294% |
| U.S. only – 2025 | $106 | $31.7 | 334% |
Source: www.imf.org, www.worldbank.org, www.iif.com, www.stlouisfed.org, www.usdebtclock.org
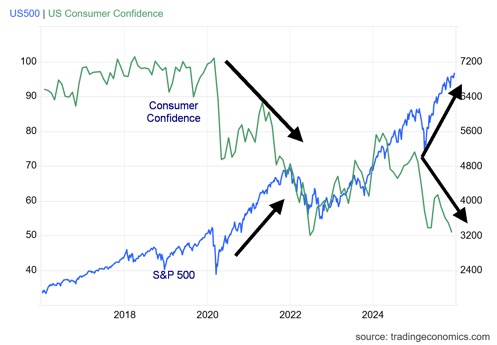
Against this background, it seems crazy that global stock markets continued to rise in 2025. But then it is the picture of the K economy: the stock market rises while consumer sentiment falls. Adding to this is job growth that has flatlined, even as the economy continues to exhibit growth thanks to consumer spending. Then there is the canary in the coal mine: precious metals (gold, silver, and platinum), the ultimate haven in times of economic stress, political polarization, fragmentation of the global world order, and massive debt.
Precious metals have no liability, unlike paper assets such as stocks and bonds. Precious metals are a store of value against inflation/deflation, declining currencies, market volatility, and rising debt. Today, precious metals make up only about 3–4% of global assets. They are under-owned even today, despite the sharp rise in prices.
Performance 2025
| Exchange, currency, bond, commodity, stock | % gain/loss 2025 | Exchange, currency, bond, commodity, stock | % gain/loss 2025 | ||
| North American exchanges | European exchanges | ||||
| S&P 500 | 16.4% | London FTSE | 21.9% | ||
| Dow Jones Industrials (DJI) | 13.0% | EuroNext | 19.2% | ||
| Dow Jones Transportations (DJT) | 9.2% | Paris CAC 40 | 11.4% | ||
| NASDAQ | 20.4% | German DAX | 23.0% | ||
| S&P 400 (Mid) | 5.9% | ||||
| S&P 600 (Small) | 4.2% | Asian exchanges | |||
| NY FANG Index | 20.5% | Shanghai Stock Exchange (SSEC) | 18.4% | ||
| S&P 500 Equal Weight | 9.3% | Nifty Fifty India (NSE) | 10.5% | ||
| Toronto Stock Exchange (TSX) | 28.3% | Tokyo Nikkei Dow (TKN) | 26.2% | ||
| TSX Venture Exchange (CDNX) | 65.2% | Hong Kong Hang Seng (HSI) | 27.8% | ||
| Bitcoin | (6.3)% | MSCI World Index (ex US) | 30.6% | ||
| Bonds | Currencies | ||||
| U.S. 10-year Treasury note | (9.0)% – 4.17% | US$ Index | (9.4)% | ||
| Canada 10-year Government of Canada bond (CGB) | 5.9% – 3.44% | Euro | 13.5% | ||
| Bank of Canada rate (BofC) | 100 bp or 31% 2.25% | Swiss franc | 14.6% | ||
| Fed funds rate | 75 bp or 17% 3.75% | Pound sterling | 7.7% | ||
| Japanese yen | 0.4% | ||||
| Precious metals | Chinese renminbi | 4.4% | |||
| Gold | 63.3% | Canadian $ | 4.9% | ||
| Silver | 143.4% | ||||
| Platinum | 124.8% | Commodity exchanges | |||
| Gold Bugs Index (HUI) | 154.6% | ||||
| Metals and energy | TSX Gold Index (TGD) | 142.8% | |||
| Palladium | 78.0% | Arca Oil & Gas Index (XOI) | 5.3% | ||
| Copper | 40.0% | TSX Energy Index (TEN) | 12.5% | ||
| WTI Oil | (19.9)% | CRB Index (CRB) | 0.7% | ||
| Brent Crude | (18.6)% | ||||
| Natural gas (Henry Hub) | 2.2% | MAG7 + | |||
| Amazon (AMZN) | 5.2% | ||||
| Key TSX indices | Apple (APPL) | 8.6% | |||
| Financials (TFS) | 30.8% | Google (GOOG) | 64.8% | ||
| Industrials (TIN) | 1.9% | Meta (META) | 12.7% | ||
| Information technology (TTK) | 15.9% | Microsoft (MSFT) | 14.7% | ||
| Materials (TMT) | 98.2% | Nvidia (NVDA) | 39.0% | ||
| Consumer discretionary (TCD) | 28.2% | Tesla (TSLA) | 11.4% | ||
| Berkshire Hathaway (BRK.A) | 10.7% |
Source: www.stockcharts.com, www.tradingeconomics.com
Stock Market vs. Consumer Confidence – The K Economy 2015–2025
The Rich get Richer, Everyone else – Meh!
Source: www.tradingeconomics.com, www.umich.edu
The Economy
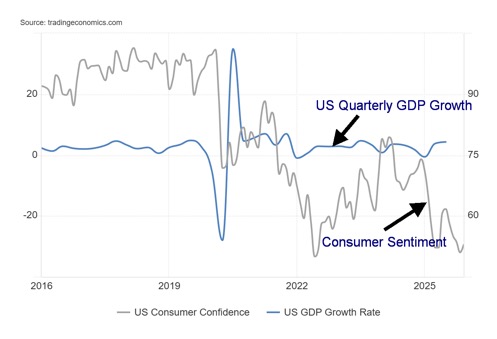
U.S. GDP Growth vs. Consumer Sentiment 2015–2025
Source: www.tradingeconomics.com, www.umich.edu, www.bea.gov
Is the K economy alive and well in the real economy as well? The preceding chart seems to suggest that. We have an improving or at least steady GDP growth. Q3 expanded, surprisingly, by 4.3%, annualized. They expected 3.3%. So far for 2025, the U.S. economy is expanding at 2.5% which is about as expected, given the negative Q1. The year is still only expected to be at +1.9% growth, given we await Q4 and the more negative impact of the government shutdown and rising layoffs. None of those have hit yet.
Advanced estimates of GDP growth were never released because of the shutdown. Nonetheless, the expected 2.5% annual growth today is about how the economy has performed since the Great Recession of 2007–2009.
We have the conflict of an expanding economy, coupled with very negative consumer sentiment. What gives? So, what happened to give the kick to Q3 GDP growth? Imports fell; exports rose. That’s positive for GDP. But the real kicker was consumer spending. Consumer spending adjusted for inflation rose 3.5%. Shop till you drop? That’s the highest since 2024. Government spending also rose, particularly for defense, while investment spending fell even as AI spending rose, but residential spending fell. Consumer spending spanned all categories – services, durable and non-durable goods.
All this leaves the divided Fed in a quandary. The economy is hot (or, okay, at least quite warm), inflation is sticky, unemployment is rising, the consumer is still spending, but sentiment is in the cellar. What do they do? They have already stopped any quantitative tightening (QT). There has been quite a spate of repos of late (repos, or repurchase agreements, put money into the financial system as the Fed buys U.S. treasuries from banks, giving them cash).
Expanding money supply, a rise in the Fed balance sheet, and talk of rate cuts in 2026 (some are calling for four) are inflationary. Do you cut when inflation is rising and the economy is still showing strength?
With many struggling to put food on the table (and making sure they don’t get sick) and consumer debt rising along with delinquencies, the well-off are the main drivers behind consumer spending. They are less sensitive to inflation, and they are the ones becoming wealthier, thanks to the roaring stock market. The rich get richer; everyone else – meh!
President Trump has been putting considerable pressure on Fed Chairman Jerome Powell. He’s announced that he will name a successor in January (Powell’s term ends in May). Will the new Fed Chairman be the president’s toady or remain independent as he is supposed to? If the appointee is perceived as following too closely to Trump’s wishes, that’s bad for the economy, bad for confidence in the U.S. and the U.S. dollar, and ultimately bad for the world and the stock market. The Fed’s independence is paramount.
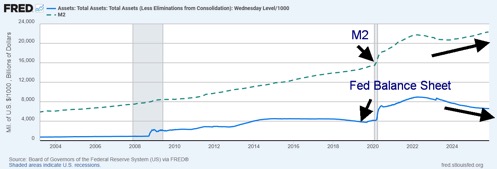
M2 and Fed Balance Sheet 2003–2025 $billions
Source: www.stlouisfed.org
Money Supply (M2) is already expanding. The Fed’s balance sheet is also starting to expand once again. All this is ultimately inflationary, putting the Fed in a quandary.
The Stock Market
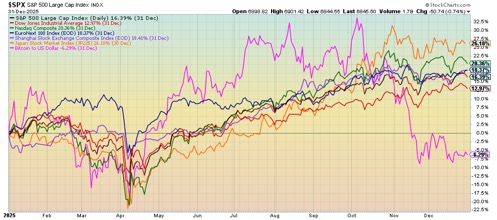
Price Performance for Selected Indices 2025
Source: www.stockcharts.com
It was difficult finding any stock markets that were down in 2025. New all-time highs prevailed throughout the year. The major U.S. indices consistently made new all-time highs. Okay, except for the Dow Jones Transportations (DJT), which today is still down roughly 5% from its all-time high seen in November 2021. It is a lingering, unresolved divergence with the Dow Jones Industrials (DJI). (Dow theory says the indices must confirm each other.)
One stock market index that did put in a negative performance in 2025 was the OMX Copenhagen 20 Index of Denmark. It fell roughly 25%, largely because of one heavily-weighted stock, Novo Nordisk, which accounts for over 40% of its market. Novo fell some 48% in 2025.
Otherwise, it was green all around. Hordes of liquidity, falling interest rates, and government deficits were major contributors. The “Liberation Day” April 2025 mini-crash was the only significant blight on the year. After that, it was on to higher levels. As we close out the year, the Fed is once again pumping the financial system with a series of repos (not seen since 2019/2020 before the pandemic crash – see chart) and clear signs that quantitative easing (QE) is once again becoming popular. Add in the odds of further rate cuts and government deficits plus insatiable borrowing, and even in 2026, markets could just keep going up. Until they don’t.
Apparently, a big winner was Palantir (PLTR), which was up some 136%. But then we ignored the mining stocks. Another big winner was Warner Bros. Discovery (WBD), up some 175%. All that was thanks to the bidding war for the company. In Canada, Celestica (CLS/TSX) gained over 190%. Of the mining and materials stocks, Orvana Minerals (ORV/TSX) stood out, up a whopping 723% in 2025. The TSX Materials Index (TMT) was up 98.2%, Metals & Mining (TGM) was up 82.5%, and Golds (TGD) were up 142.7%. Happiness all around.
Did any loser stand out for us? Yes, Trump Media (DJT) fell 61.2%, down like Trump’s approval ratings. We are sure there are others whose performances were sub-par. Otherwise it was a stellar year. The 10% who own some 90% of the stock market made out like bandits. As for everyone else? Meh! Inequality grows.
Return of the Repos 2020–2025
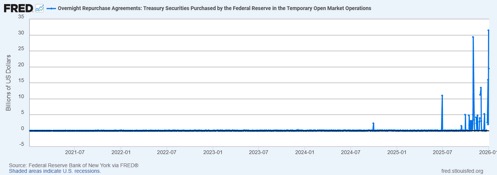
Source: www.stlouisfed.org
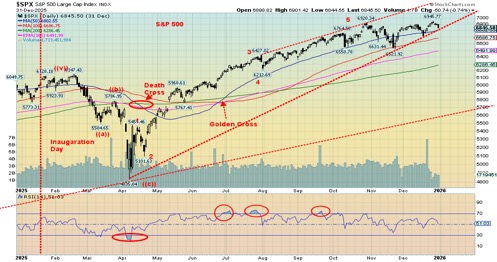
Source: www.stockcharts.com
The one big thing we notice with our chart for the S&P 500 is that it, along with Dow Jones Industrials (DJI), recently saw new all-time highs, but NASDAQ did not. A divergence? Naturally, time will tell. Notably, stocks have been turning down this past week. The so-called Santa Claus rally lasts the last five days of the old year and the first two days of the new year. So far, the S&P 500 is down 1.1%. When Santa Claus fails to call, the bears may come to Broad and Wall. Except the last three years saw a mildly negative Santa Claus rally. Certainly didn’t impact 2025.
No, the indicator is not fail-safe as a predictor for the stock market in 2026. There also comes the first five days of the new year and the January effect. As January goes, so goes the market for the year, according to the saying.
Our chart of the S&P 500 shows that it’s potentially on the edge of a breakdown of what appears to be an ascending wedge triangle. It’s got room to rebound and once again see new highs. If we do break down, we need to first take out that December low at 6,720 and the November low of 6,521. The 200-day MA is near 6,300 so that could be a logical target. Under 6,200, a more pronounced breakdown could get underway. For followers of the TSX, the breakdown points are under 30,000. The 200-day MA is near 28,000. Under 27,000, a more serious decline could get underway.
Source: www.cnn.com– fear and greed indices.
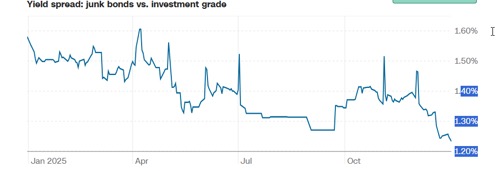
There are numerous signs of excess in the market. One overlooked one is the spread between junk bonds and investment grade bonds. Currently at around 1.23%, it’s a clear sign that investors are willing to accept more risk. The most closely followed indicator is the Fear and Greed Index / VIX Volatility Index. It is currently showing some complacency, even though at these levels the indicator is neutral.
The VIX rises as the stock market falls and vice versa. It’s best to look at the VIX over time rather than on any one day. The recent rise in the stock market has had the VIX falling. Note that it was lower during 2023–2024. Under 15 indicates complacency. The VIX was last at 14.74.
Chart of the Week – VIX Volatility Indicator
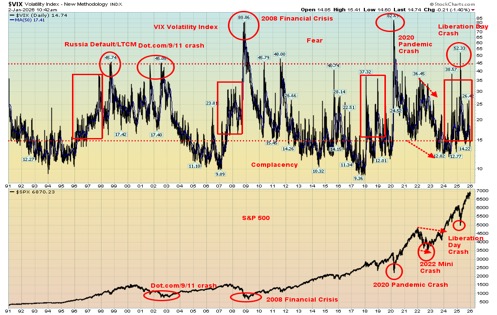
Source: www.stockcharts.com
We are not going to argue against the stock market going higher into 2026. With the Fed cutting interest rates, pumping liquidity into the system (QE), and continuing to borrow, the liquidity is there and all that money has to go somewhere. The wealthy 10% and the institutions are the biggest beneficiaries.
However, the warning signs are there. Valuations are too high. Complacency reigns. The economy, which should be faltering, is instead still showing signs of life. But as the effects of the U.S. government shutdown dissipate, we may soon see numbers reflecting a sinking economy. On January 9, we get the December job numbers for both the U.S. and Canada. Markets do not announce turning points, but they do leave traces. Are we paying attention?
Source: www.advisorperspectives.com, www.globalinvestorletter.com
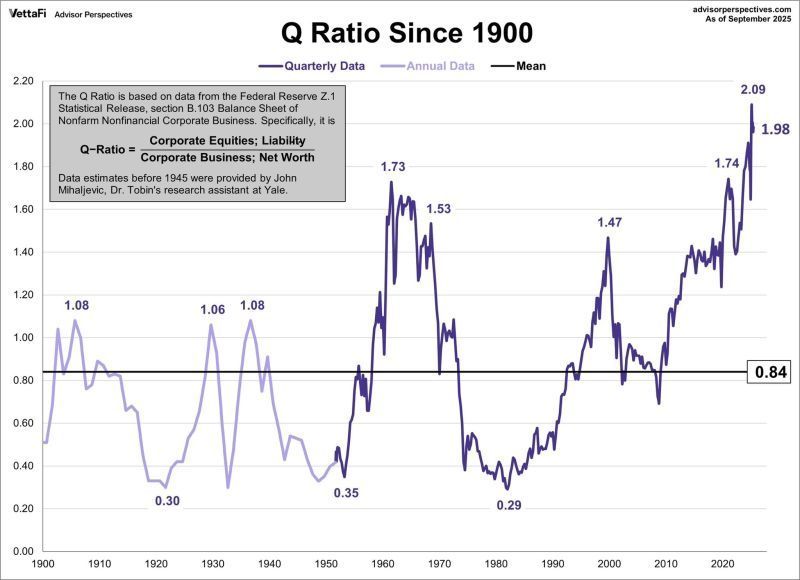
Tobin’s Q ratio stands at a lofty 1.98, the highest in a century (corporate equities, liability/corporate business, net worth). That’s 2.4 times the long-term average of 0.84. Notably high levels of the Q ratio appeared in the mid-1960s and in 2000. What followed was the 1970s’ decade of back-and-forth markets going nowhere and the 1973–1974 bear. The 2000 peak was followed by the dot.com crash and the financial crash/Great Recession. Heed the warnings.
Gold and Precious Metals (Energy too)
Gold plus other Selected Commodities Price Performance 2025
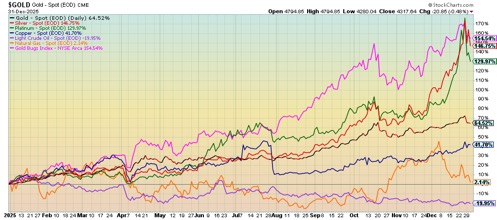
Source: www.stockcharts.com
2025 was a golden year. Or, more specifically, it was a silver year. Gold rose an impressive 64.5% in 2025. But silver was up 146.8%. Platinum was no slouch, up 130.0%. For the precious metals it was the best year since 1979. And, less we forget, the precious metals stocks benefited with the Gold Bugs Index (HUI) up 154.6% and the TSX Gold Index (TGD) up 142.8%. Apparently, the big winner was Orvana Minerals (ORV/TSX), up 758% in 2025. Can they do it again in 2026?
Certainly, the conditions remain that propelled the precious metals to a record year. Global geopolitical tensions, domestic political tensions, the rise of right-wing populist parties and the decline in democracy, uncertain economics, and growing debt are everywhere. Gold is the safe-haven. Increasing safe-haven demand is a sign of stress in the global economy and financial system.
The real story of 2025 is silver. Some are saying that precious metal stocks, particularly silver, are acting like meme stocks. Silver as GameStop (GME)? Hardly. Silver is a metal in high demand for solar panels, EVs, electronics, medical tech, AI, and more. The trouble is that physical silver is in short supply. Now China has placed export controls on silver, tightening supply chains even further. China is the world’s second largest silver producer, behind Mexico. But China only produces a bit over half of what Mexico produces. Peru is just behind China.
While physical silver is in short supply, paper silver (i.e., silver futures and other derivatives) is a humungous market. There are 356 ounces of paper silver to one ounce of physical silver. There are those who are short silver futures, thus providing a potential source of buying to cover offside shorts.
Then along came the Chicago Mercantile Exchange (CME) and, amidst concern over the growing frothiness in the precious metals markets, they raised margin requirements. That helped cause the huge hiccup decline on December 29. An outside day reversal from record highs. Silver fell nearly 9% that day. Forced liquidation. Rumours that a financial institution (unknown at this time) was going under as the result of failure to meet the margin call.
But that’s the paper market. Over in the physical market there are growing shortages. They are paying upwards of $80/ounce in Shanghai, a significant premium, to New York. Companies are seeking deals with silver producers at $80/ounce. Silver is trading at $80/ounce at SilverGoldBull (www.silvergoldbull.com, www.silvergoldbull.ca). Spot silver is above futures silver. That’s called backwardation. Silver is trading at $130/ounce in Japan, $106 in Kuwait, and $97 in Korea, reflecting this divergence in the paper market vs. the physical market.
These levels are based somewhat on hearsay. But is a bank about to implode? Banks face a possible liquidity risk on silver, but is bankruptcy imminent? Not necessarily. Futures traders are demanding physical silver as settlement rather than cash or rolling contracts, adding to the supply woes. An excellent article in much more detail and depth than we can provide is found on the CCN site (https://www.ccn.com/education/crypto/silver-130-vs-71-physical-repricing-banks-collapse-bitcoin-crash/).
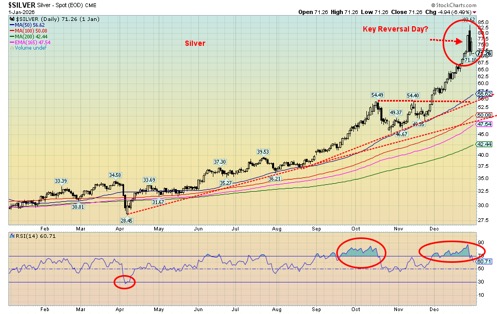
Source: www.stockcharts.com
If there was an outside day reversal in silver (note: gold did not do the same thing), then we could have a bit more correction time ahead of us. Maybe this shouldn’t be a surprise. The 2011 high near $50 (inflation-adjusted) is $72 today. A huge cup and handle formation, formed from 1980 to 2022 suggested $71 as the initial target.
That we have exceeded that level but are currently correcting near it suggests to us that once this correction is over, we should move to the next target near $100. The inflation-adjusted high of 1980, also near $50, is $197 today. Could we do it? Many believe we can.
Gold/Silver Ratio 2000–2025
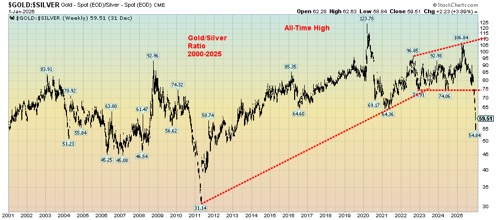
Source: www.stockcharts.com
The system is broken. The rush into physical silver and gold reflects a growing malaise. Distrust is everywhere: in the economy (trade wars, rising unemployment, sticky inflation, sliding GDP), in the political realm (geopolitical and domestic), and in paper assets (bonds, stocks, derivatives). The result is a move out of paper assets and fiat currencies into physical assets: i.e., gold and silver. The debt is not a cyclical problem – it’s structural. Examples of debt blow-ups litter history.
Banking crises, debt crises, and political crises resulting in revolution, civil war, or global war are not accidents. They happen with regularity. The Great Depression, followed by World War II but preceded by the Roaring Twenties – a period of excess, inequality, and transformational technological advances – was not an accident. This time is not different. It will happen again. Are we on the cusp of something similar?
The gold/silver ratio has broken down sharply in favour of silver. Last at 54.84, the 2011 low near 31 is within sight. The pattern suggests a fall to at least 42.
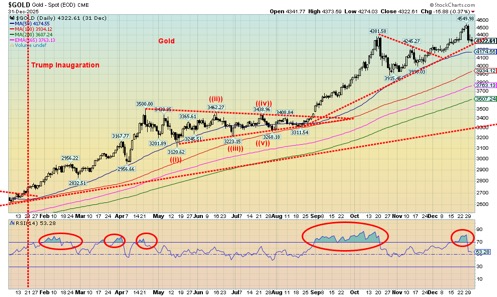
The bull market for both gold and silver is not over – it’s just on pause. Last week’s hiccup was not fundamental. It was manipulated. We could be sitting on the cusp of a further breakdown for gold. Nonetheless, only a breakdown under $3,900 would be of major concern.
Source: www.stockcharts.com
Energy, Oil, and Gas
Source: www.stockcharts.com
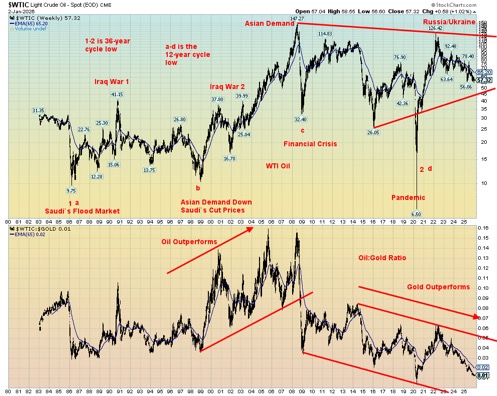
Is oil once again poised to outperform? The U.S. attack on Venezuela on the weekend may change the narrative. Up until now the world has been plagued with excess oil supply as supply exceeds demand. Neither the Russia/Ukraine war nor threats against Venezuela, including seizing alleged sanctioned ships, have stirred oil prices. But will the attack on Venezuela change the scenario? President Maduro was seized. Meanwhile, the regime remains in power, even if Maduro isn’t. Venezuela holds the world’s largest reserves of oil, some 303 billion barrels. However, their facilities are underused and lacking in parts, resulting in Venezuela being only the world’s 12th largest producer. China is the main recipient of Venezuelan oil.
Adding to the uncertainty are threats against Iran. Iran remains the world’s seventh largest oil producer and holds the world’s fourth largest reserves. Iran is also the world’s third largest producer of natural gas, holding the world’s second largest reserves. The U.S. has threatened further attacks on Iran. Iran borders the Straits of Hormuz where between 25% and 30% of the world’s oil flow through. Iran does not have the capability to block the straits, but it can seriously disrupt them. Again, China is the main importer of Iranian oil.
Where all this is going is unknown. Cyclically, oil prices made their last significant low during the pandemic of 2020. Oil has shown a fairly consistent cycle of 36 years and 12 years. Thus, 18 and 6 years also become potential periods for lows. The last major low in 2020 was both a 36-year and a 12-year cycle low. Six years hence would lead us to 2026 where we are now. The events are unfolding. Will it be a low?
The oil/gold ratio has been favouring gold since a peak in 2008. That ratio is also at a level that could suggest a forthcoming low for oil. The events going forward will prove whether the cycles and signals are working in favour of oil. Wars in oil-producing nations are often the prime catalyst for rising prices. Iran and Venezuela fit the bill. And China is the main recipient of their oil exports. Add to this China’s export controls on a wide range of rare earths and now silver, all essential to U.S. industry. Tensions are growing between the U.S. and China. Is the target of the U.S.’s attacks on Venezuela and threats against Iran really China?
__
(Featured image by Scottsdale Mint via Unsplash)
DISCLAIMER: This article was written by a third party contributor and does not reflect the opinion of Born2Invest, its management, staff or its associates. Please review our disclaimer for more information.
This article may include forward-looking statements. These forward-looking statements generally are identified by the words “believe,” “project,” “estimate,” “become,” “plan,” “will,” and similar expressions, including with regards to potential earnings in the Empire Flippers affiliate program. These forward-looking statements involve known and unknown risks as well as uncertainties, including those discussed in the following cautionary statements and elsewhere in this article and on this site. Although the Company may believe that its expectations are based on reasonable assumptions, the actual results that the Company may achieve may differ materially from any forward-looking statements, which reflect the opinions of the management of the Company only as of the date hereof. Additionally, please make sure to read these important disclosures.
David Chapman is not a registered advisory service and is not an exempt market dealer (EMD) nor a licensed financial advisor. He does not and cannot give individualised market advice. David Chapman has worked in the financial industry for over 40 years including large financial corporations, banks, and investment dealers. The information in this newsletter is intended only for informational and educational purposes. It should not be construed as an offer, a solicitation of an offer or sale of any security. Every effort is made to provide accurate and complete information.
However, we cannot guarantee that there will be no errors. We make no claims, promises or guarantees about the accuracy, completeness, or adequacy of the contents of this commentary and expressly disclaim liability for errors and omissions in the contents of this commentary. David Chapman will always use his best efforts to ensure the accuracy and timeliness of all information. The reader assumes all risk when trading in securities and David Chapman advises consulting a licensed professional financial advisor or portfolio manager such as Enriched Investing Incorporated before proceeding with any trade or idea presented in this newsletter.
David Chapman may own shares in companies mentioned in this newsletter. Before making an investment, prospective investors should review each security’s offering documents which summarize the objectives, fees, expenses and associated risks. David Chapman shares his ideas and opinions for informational and educational purposes only and expects the reader to perform due diligence before considering a position in any security. That includes consulting with your own licensed professional financial advisor such as Enriched Investing Incorporated. Performance is not guaranteed, values change frequently, and past performance may not be repeated.


Global Markets on Edge as Iran Conflict, Inflation Pressures, and Financial Risks Intensify
Iran conflict threatens economy disruptions beyond energy to agriculture and goods. Rising PPI signals persistent inflation, risking stagflation reminiscent of...

The Iran War Tests Bitcoin and Crypto Market Resilience
The Iran war has driven oil prices higher and disrupted crypto markets. Bitcoin rose despite volatility, while mining activity declined....


Italy’s Pharmaceutical Sector Drives Innovation, Sustainability, and European Leadership
Italy’s pharmaceutical sector invests €4 billion annually, including €2.3 billion in R&D and €1.7 billion in industrial technologies, up 21%...


Anemic Labor Market and the End of Passive Money Flows
Weakened labor market is reducing passive inflows to stocks as supply and demand fall together. Immigration declines, aging population, and...


The TopRanked.io Weekly Digest: What’s Hot in Affiliate Marketing [NiftyPM Affiliate Program Review]
As any marketer (affiliate or not) can tell you, the old "it's AI-powered" line has been a real champ when...
 |
|
 |  |
 |
|
-

 Fintech2 weeks ago
Blockchain and AI Converge: Strategic Alliances, Industry Shifts, and Strong Bitcoin Demand
-

 Cannabis1 week ago
Canada’s Cannabis Boom Grows as Alcohol Consumption Declines
-
 Crypto5 days ago
BlackRock’s $94M Crypto Move Signals Rising Institutional Momentum
-

 Crypto2 weeks ago
Ultimate Convenience: Why Consumers Expect Instant, Secure, and Borderless Payments