Markets
Gold Soars Amid Rising Debt, Weak Jobs, and Central Bank Strains
Debt and deficits surge across G7, with U.S. worst and Canada lowest. Rising bond yields, U.K. and France instability, and weak job data fuel concern. Inflation lingers as central banks near limits ahead of key rate decisions. Gold surges to record highs on safe-haven demand, outpacing stocks and central banks now prefer gold over treasuries.

Even as central banks are cutting the central bank interest rate, long-term interest rates have generally been rising, thus widening the yield curve. Can both be true? They are. Short-term rates, as we’ve noted before, are generally controlled by the central bank. All countries in the G7 have a central bank and many others do as well.
But the bond market is generally beholden to nobody. Many participate in the bond market—governments, central banks, banks, institutions such as mutual funds, pension funds, and insurance companies, foreign entities (who participate heavily in the bond market), and finally hedge funds and speculators.
The global bond market is huge, roughly $130 trillion. Countries, corporations, and more issue bonds, even as other participants are buyers. Factors that can impact the bond markets are, inflation expectations, global outlook, fiscal policy of governments, and—issuance of debt, debt, debt.
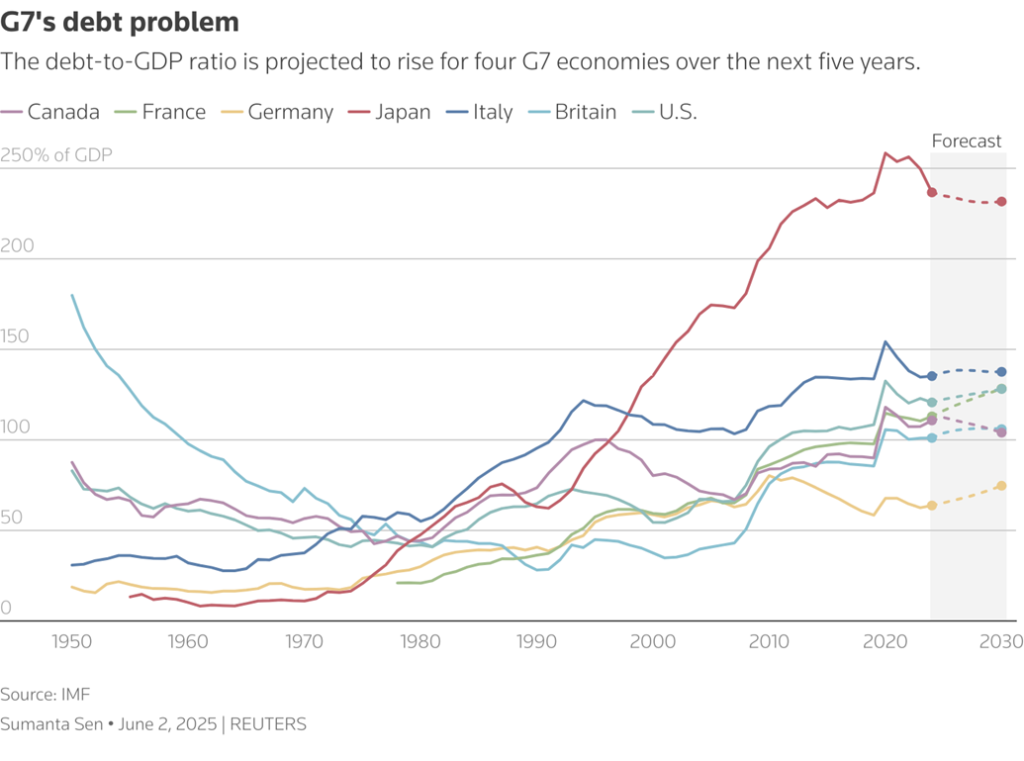
We live in a world where there is too much debt. The debt/GDP for most of the G7 participants is over 100%. That means their debt outstanding is more than their GDP. The exception is Germany, the only one under 100%. The following table summarizes this:
| Country (G7 only) | Debt/GDP % | Total national debt (US$) (billions) | Current 10-year rate % ** | Budget (surplus/deficit) balance as a % of GDP | Change in 10-year from one year ago | Inflation rate % |
| United States | 123% | $37,314.8 | 4.22% | 5.9% | +49 bp | 2.7% |
| United Kingdom | 101.2% | $4,347.7 | 4.75% | 4.9% | +84 bp | 3.8% |
| Germany | 62.7% | $3,608.2 | 2.75% | 2.7% | +53 bp | 1.8% |
| France | 110.6% | $4,089.8 | 3.54% | 5.7% | +63 bp | 0.9% |
| Italy | 134.8% | $3,971.3 | 3.64% | 3.6% | +7 bp | 1.7% |
| Japan | 249.7% | $12,329.8 | 1.64% | 3.4% | +75 bp | 3.0% |
| Canada | 107.5% * | $2,724.0 * | 3.41% | 2.0% | +41 bp | 1.7% |
- *Canada’s widely-quoted debt/GDP includes both federal, provincial, and territorial debt. Canada’s debt/GDP for the federal government only is estimated at 56.8%. Canada’s national debt only is US$ 1,272.3 billion.
- **Countries have different names for the longer-dated instruments. These names are used by the G7 countries: U.S. – Treasury notes and bonds; U.K. – gilts; Germany – Bundesanleihe (bunds); France – Obligations assimilables du Trésor (OATs); Italy – Buoni del Tesoro Poliannuali (BTPs): Japan – Japanese Government Bonds; (JGBs), Canada – Government of Canada bonds (CGBs)
- Bold – highest; italicized – lowest
We’ve highlighted who has the highest in each category. In looking at yields today we discover that the U.S. note yields are in a consolidation with a small downward tilt, U.K. gilts are threatening to break higher, German bunds are in a rising consolidation, France has been rising, Italy is in a steady consolidation, Japan is rising, and Canada has recently been falling following a sharp rise.
So, what’s going on besides too much debt? All are running large deficits, with the biggest in the U.S. and France right behind. It’s a common problem as all continue to experience a post-COVID hangover when they all borrowed too much to keep things afloat. Add in increased spending for defense and green investments, and an aging population sparking a rise in pensions and health care.
Despite inflation coming down, thanks to the high interest rates of the past few years, inflation remains a sticky problem and inflation expectations remain elevated. Investors, particularly institutions, are demanding higher yields for the risks associated with too much debt and too-high deficits. Central banks for the most part have been reluctant to cut rates for fear of unleashing inflation once again. For too long, central banks kept interest rates low below the rate of inflation, particularly through the 2008 financial crisis, the EU debt crisis in the 2010s, and the COVID crisis. There was also heavy bond buying as a result of quantitative easing (QE). All practiced that during the various crises. One thing just piles on to another.
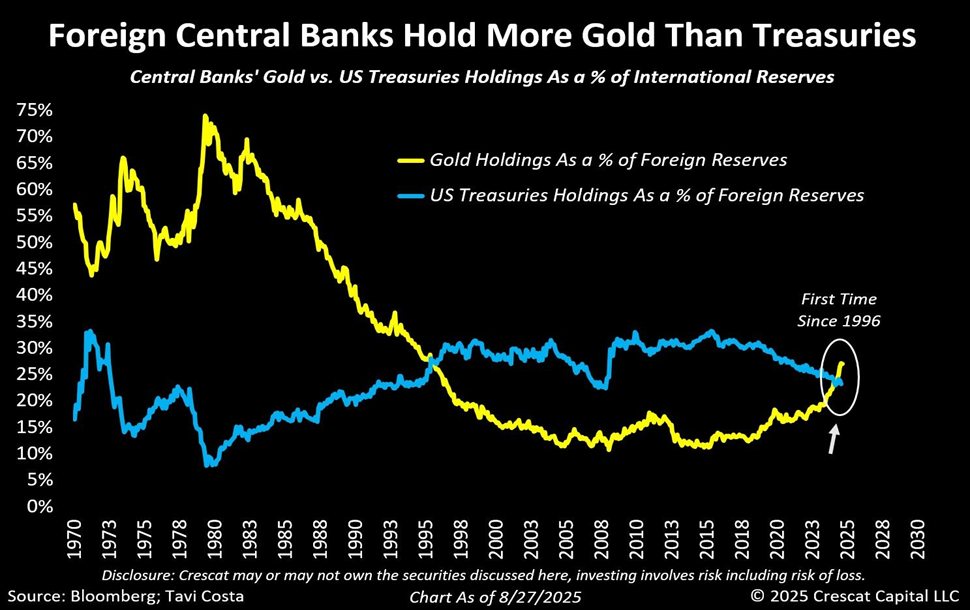
Not helping are buyers boycotting in particular U.S. bills, notes, and bonds. U.S. sanctions and tariffs are spurring buyers, particularly in China and even Japan, to cut back on buying U.S. securities. Japan, because of rising inflation and bond yields at home, is also repatriating funds for its own markets. Also not helping is increased demand for funds for AI, energy transition, and re-shoring, which gives rise to too much demand and crowding out. Interestingly, China and Russia in particular are buying gold instead of U.S. securities. Russia holds no U.S. treasuries. For the first time since the early 1990s, central banks now hold a higher proportion of their foreign reserves in gold rather than U.S. treasuries. Look what happened in the 1970s as the gold price rose and bond yields also rose.
We should add in the geopolitical risks, particularly the escalating Russia/Ukraine war and the wars between Israel and just about everybody else in the Middle East. This has heightened the need for defense spending. Add in concerns about energy supplies where a sharp rise in oil prices can spark an uptick in inflation.
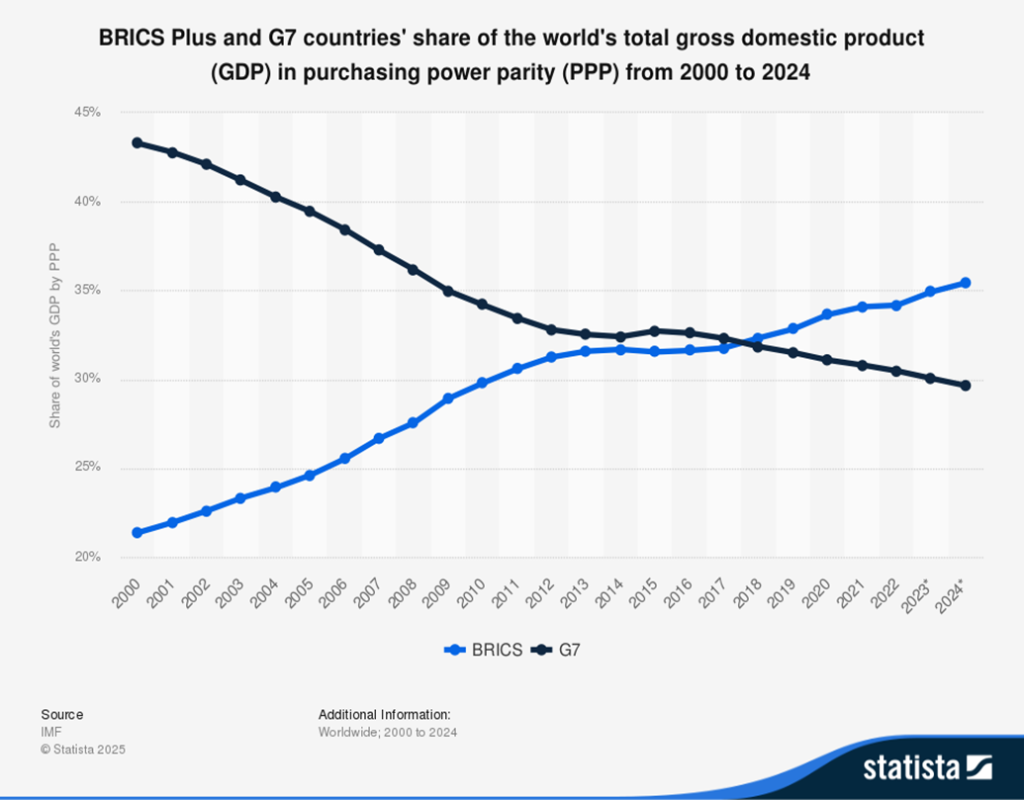
All the countries in the G7 are experiencing problems, some more than others. Interestingly, the GDP in purchasing power parity (PPP) for the BRICS now exceeds the G7, even as nominally the G7 is still ahead. There is a huge power shift going on which, if history holds true, will only heighten as we go forward, potentially ending in a war. Of the G7 countries, big problems plague both the U.K. and France. France in particular is dealing with high debt, high deficits, and political polarization. Political polarization has heightened in all the G7 countries to varying degrees. Today, on a PPP-basis, BRICS have 37% of the global economy vs. 29% for the G7. No wonder the geopolitical tensions are rising.
Debt to GDP is projected to rise for all the G7 countries going forward. Particularly vulnerable are France and the U.K. We’ve even read talk of a debt crisis and sovereign debt default emanating for both France and the U.K. Remember the EU debt crisis of the 2010s where Greece defaulted. By comparison, Greece’s situation was an annoyance, while the U.K. and France are looking at a disaster.
However, it is not just the U.K. and France who are in trouble; all are experiencing problems. Japan has far too much debt and yields are rising. Italy consistently has problems. The U.S. is moving into a fiscal nightmare with deep political polarization and rising deficits. As well, the trade wars between the U.S. and the rest of the world will also put upward pressure on inflation and yields. The best of the bunch may be Canada; yet it too is suffering from rising debt and political polarization.
The central banks are running out of bullets. Since the end of the gold standard in 1971, the world has experienced a massive rise in debt and ongoing financial crises. Crises erupted in 1974–1975, 1980–1982, 1990, 1997–1998, 2000–2002, 2007–2009, 2014–2016, and 2020–2022. Each succeeding one required more debt to purchase an additional dollar of GDP. That now exceeds by roughly a margin of 3:1. The fiscal wall is fast approaching.
Central banks are increasingly being forced into being the buyers of last resort. But even they have their limits. Whether that limit has been reached remains to be seen. A financial nightmare lies around the corner and we are not prepared for it. No wonder gold is rising. Gold is nobody’s liability.
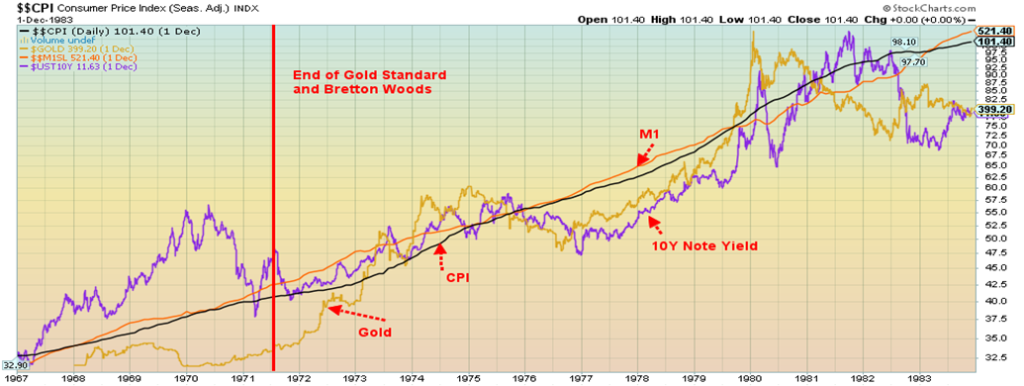
Is this a big oh-oh? Does history repeat itself? Yes, during those periods gold soared. The inflationary 70s were sparked by the funding needs of the Vietnam War, increased social spending and deficits, the oil shocks of 1973 and then again in 1979, where interest rates were kept artificially low for too long, the end of the gold standard and Bretton Woods, plus the wage price push which led to higher costs. As well, the US$ fell, caused mostly by the inflation of the Vietnam War and the end of the gold standard. Deficits rose during this period as well.
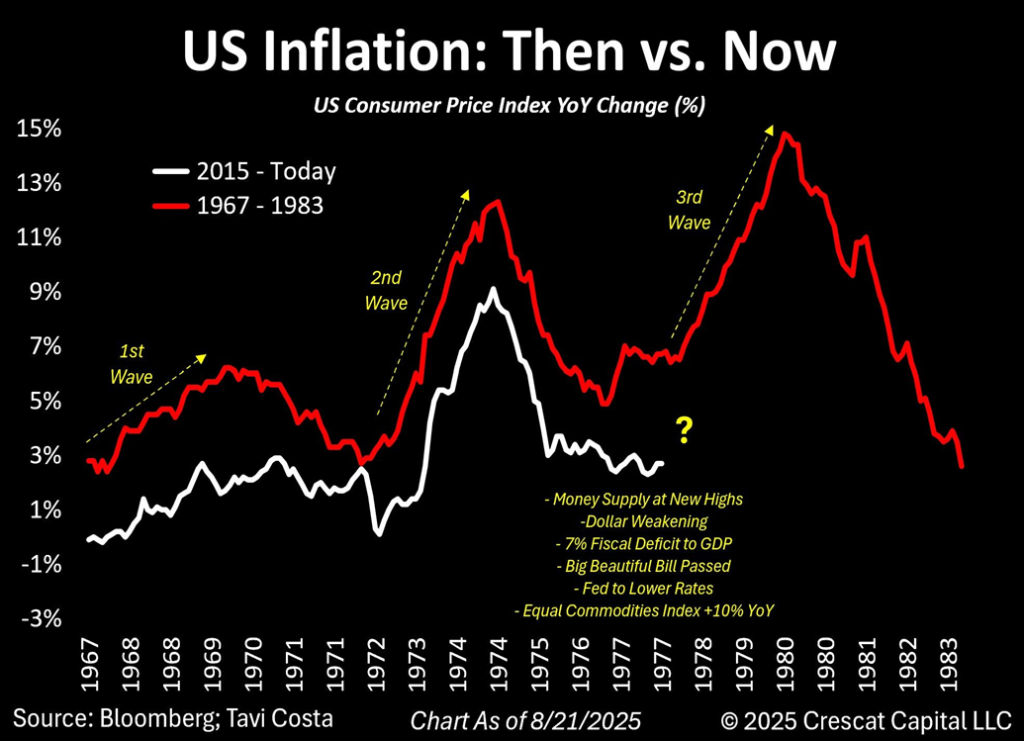
Today we have M1 at or near new highs, a generally weakening US$, high deficits noted as 5.9% of GDP for the U.S. and an average of 4.0% for the G7, the deficit spending that’s required for the Big, Beautiful Bill, and the Fed lowering interest rates. Missing is heavy involvement in a war that would help spike these deficits to even greater levels and potentially bring on a financial crisis, given where we are today.
The 1970s also saw one of the biggest gold rushes ever as gold soared from $35 to $875 by 1980. Our next chart shows that with a look at gold, the 10-year U.S. Treasury note yield, plus CPI and M1 growth. M1 and the CPI climbed relentlessly while gold’s rise mostly flowed with the rise of bond yields.
CPI, Gold, M1, and 10Y Yield 1967–1983
CPI, Gold, M1, and 10Y Yield 2015–2025
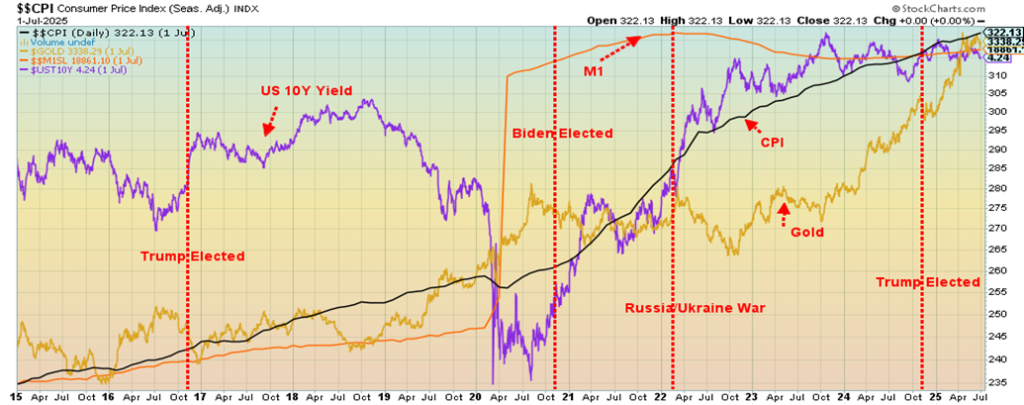
There are other similarities between the 1970s and today in that gold has been largely following bond yields while M1 soared and inflation rose. However, one thing stands out: while the 1970s had its share of problems and there were three recessions (1969–1970, 1974–1975, and 1980–1982), the period didn’t start with the staggering amount of debt outstanding that we see today. Nor did they have the fiscal deficits as a percentage of GDP as we have today. Another financial crisis on the scale of what happened in 2007–2009 could trigger not a recession but a depression. As well, could we have a sovereign debt collapse of a G7 country?
Chart of the Week
US Job Numbers
Employed Rate, Unemployment Rate 2020–2025
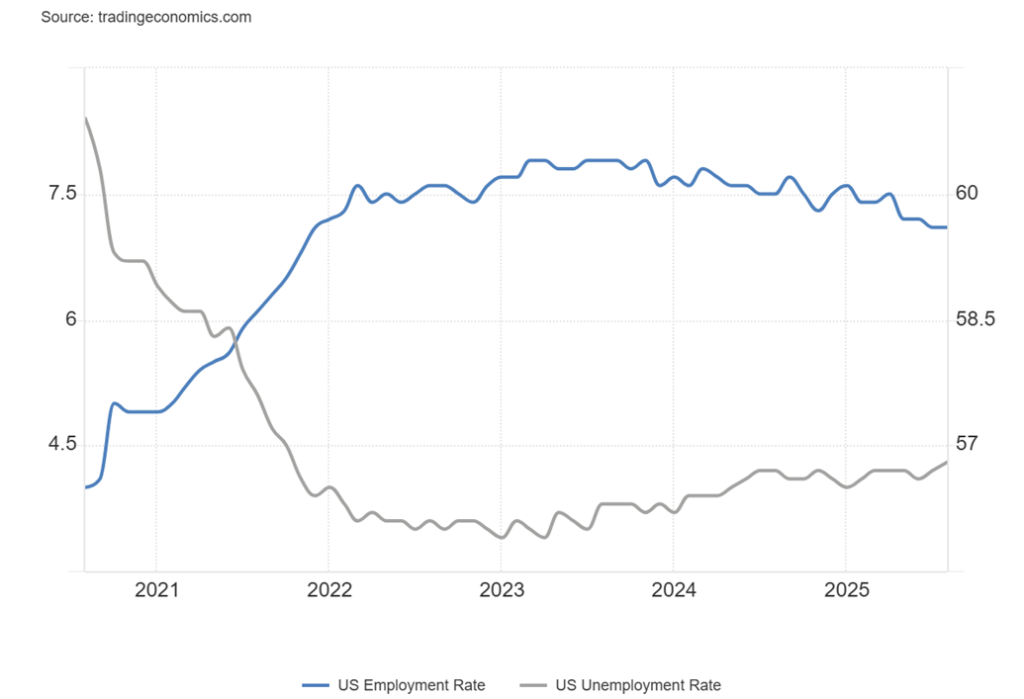
Is the U.S. jobs market tipping over? Nonfarm payrolls for August came in at 22,000, well below the consensus number of 75,000 and the July nonfarm of 79,000. It was the lowest nonfarm since June when it was reported that nonfarm fell by 19,000. Add in that the two previous months were revised downward by 21,000. Will the President be pleased, given that in the previous month he fired the head of the Bureau of Labour Statistics (BLS www.bls.gov), piqued by the low nonfarm number? Will he now fire the replacement who he appointed himself, given the poor numbers? And, given the firing, are the numbers to be trusted? Given, they were lower, plus a downward revision appears to support that nothing has changed at the BLS.
The nonfarm payrolls are the establishment number whereby business reports to the BLS. The household survey surveys households, just like it suggests. There the employment level rose by 288,000, but that just offsets a drop of 260,000 in July. The number can be a little volatile. Full-time employment fell by 357,000 but part-time employment rose by 597,000. The civilian labour force rose by 436,000. (Note: all figures are from www.stlouisfed.org and www.bls.gov).
The unemployment rate (U3) rose to 4.3% from 4.2% while U6 unemployment (total unemployed, plus all persons marginally attached to the labour force, plus total employed part-time for economic reasons, as a percent of the civilian labour force, plus all persons marginally attached to the labour force) rose to 8.1% from 7.9%. The Shadow Stats (www.shadowstats.com) unemployment number (which includes workers unemployed for more than one year and others employable but long-term discouraged are no longer counted in the labour force since being removed in 1994) rose to 28.0% from 27.8%.
The employment population ratio was unchanged at 59.6% while the labour force participation rate rose to 62.3% from 62.2%. The number of persons unemployed (U3) rose 148,000 to 7,384 thousand, but U6 unemployed sits at 13,960.6 thousand. All the numbers are pointing to a slowdown in hiring.
The number for those not in the labour force rose 826,000 in the latest report. There is an army of 6.3 million who are considered not in the labour force but who want a job now. They are the main source of the Shadow Stats numbers and are considered not in the labour force. The total not in the labour force is 102,966 thousand and includes retirees (61.6 million) and disabled people (8.2 million), as well as full-time students, stay-at-home parents, or full-time caregivers. Also included are those who are unemployed for over one year, plus marginally attached workers wanting a job but not considered a part of the labour force.
The average workweek was 34.2 vs. the estimate of 34.3, which is only .1 pt from matching the lowest since 2010. Average hourly earnings were higher by .3% as expected, while average weekly earnings also were up by .3% month over month (m/o/m) and by 3.4% year over year (y/o/y). The average duration of unemployment rose to 24.5 weeks on average vs. 24.1 in July, and 23 in June. That’s the most since April 2022. The median weeks unemployed rose 9.8 from 9.3. The number unemployed 27 weeks or longer rose 1,930 thousand from 1,826 thousand up 104,000. The total population level rose to 274,001 thousand from 273,785 thousand, up 216,000.
As for the sectors, manufacturing, information, financial, professional/business services, and federal employment all fell. Gains were in retail trade, health care, transportation/warehousing, and leisure and hospitality.
As the result of the job numbers, bond yields fell, the US$ Index fell, stocks fell, and gold rose. The odds of a rate cut of 25 bp in September rose to 100%. There are now talks of a 50 bp rate cut. The FOMC meets on September 16–17. Overall, the report showed a slowing rate of hiring and declining employment, all of which could result in a slowing economy. The employment rate has fallen from 60.4% in 2023 to 59.6% today, while the unemployment rate has gone to 4.3% from 3.4% in 2023. Over the previous 12 months, nonfarm payrolls have averaged 97,900.
It was no surprise that, following the job numbers, Fed Chair Jerome Powell was attacked once again by President Trump. His nickname is now “Too late Powell.” In the Trump administration’s desire to take over the
Fed, the Department of Justice has opened a criminal investigation into Lisa Cook, the beleaguered Fed Governor who Trump is trying to fire for alleged mortgage fraud, an event that took place before her appointment to the Fed. It’s all part of the plan for a political takeover of the Fed. As we’ve noted, if that happens, the markets won’t be kind.
Canada Job Numbers
Canada Employment Rate, Unemployment Rate 2020–2025
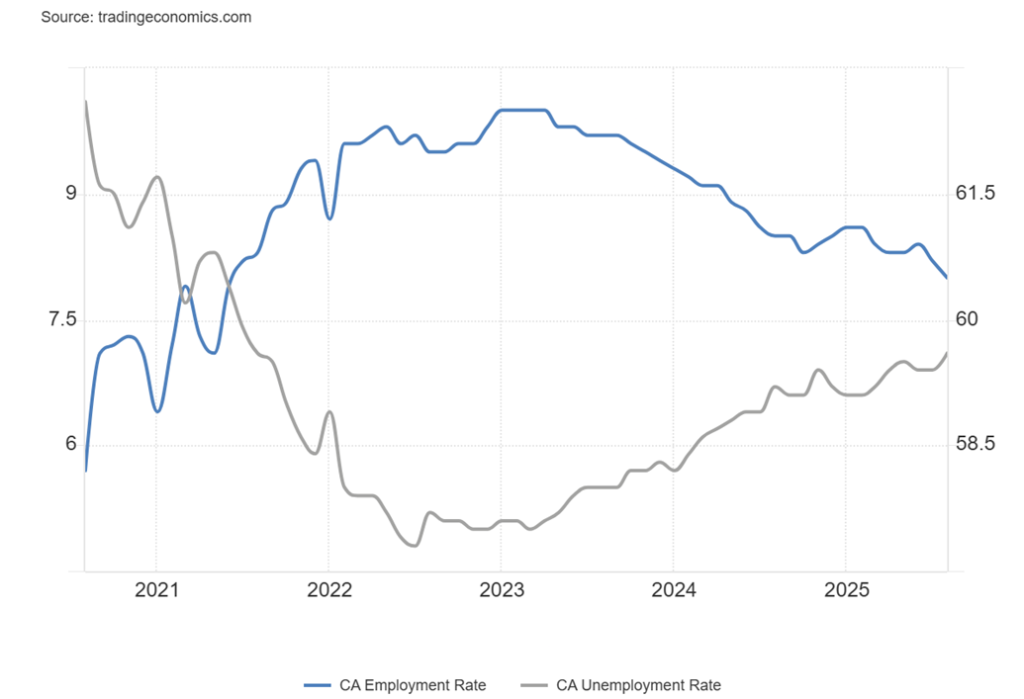
Canada’s employment report for August looks like a serious ouch. Jobs fell 65,500, well below the consensus gain of 7,500. In July, employment fell 40,800. The unemployment rate rose to 7.1% from 6.9% while the R8 unemployment rate (plus discouraged searchers, waiting group, portion of involuntary part-timers), the
highest reported by Statistics Canada, rose to 10.2% from 9.9%. The number of employed persons fell 40,800. Full-time employment fell 6,000 while part-time employment dropped 59,500. The employment rate fell to 60.7% from 60.9%. The number unemployed was 1,590 thousand vs. 1,560.2 thousand the previous month. The youth unemployment rate actually fell to 14.5% from 14.6%. Average weekly earnings rose 3.6%, above the forecast of a rise of 3.2%.
Despite the large drop in August, Canada has averaged 27,400 jobs/month over the past year. We’ve noted that sometimes the month-to-month job numbers can be volatile. One has to keep a longer-term perspective. Job loses were in professional, scientific, and technical services as well as in transportation, warehousing, and manufacturing. Many of these job losses were related to the tariffs being imposed from the U.S. as those have hit the auto industry and steel and aluminum. Gains were seen in construction. Ontario, B.C., and Alberta absorbed the bulk of the job losses.
The odds of a rate cut this month by the Bank of Canada (BofC) rose. Bond yields fell, but the TSX was actually up small, buoyed by gains in Golds (TGD), Metals (TGM), and Materials (TMT). The Canadian dollar rose small, mostly as the result of the US$ Index falling.
As noted, the large job losses were driven primarily by the tariff war. This puts further pressure on the Prime Minister to find a deal. As in the U.S., the next scheduled interest rate decision day by the BofC is September 17. Should be an interesting day.
S&P 500
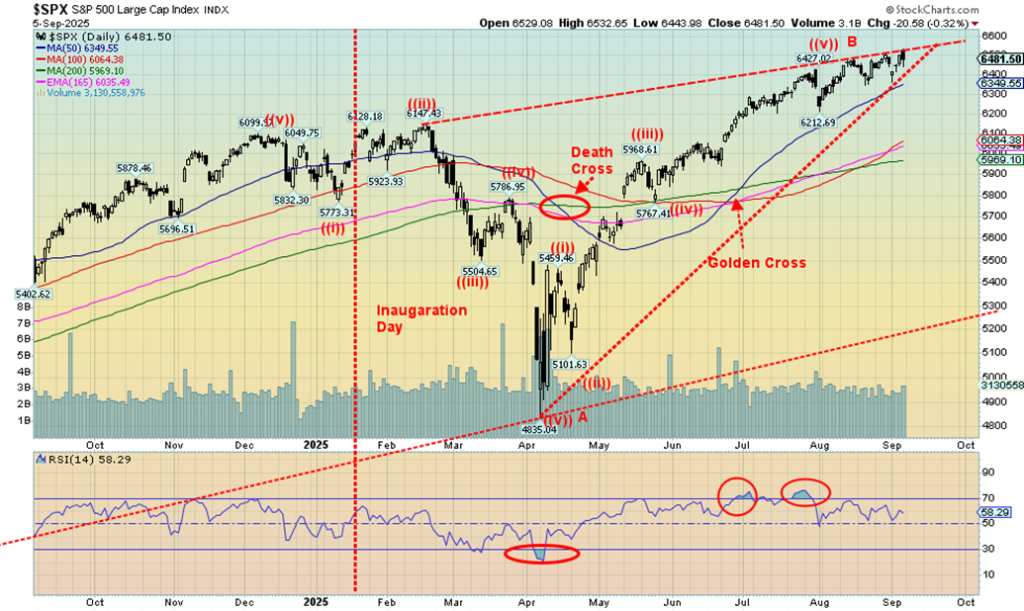
Friday’s employment numbers saw stock markets make highs, then reverse and close down. It was quite small, but on Friday the S&P 500 (SPX) made yet another all-time high, then reversed and closed down 0.3%. It’s a tough call to call it a key reversal. The best key reversals are weekly ones where a new all-time high is made but then reverses and makes a lower low than the previous week and closes below that low. We didn’t satisfy that on Friday. But that uptrend line keeps declining and the possible ascending wedge triangle is becoming more dominant. A break under 6,400 would be the first sign of trouble. Under 6,200 a potential top is in. Under 5,900 a larger breakdown is getting underway.
Nonetheless, all-time highs were prevalent again this past week. Joining the SPX were the Dow Jones Industrials (DJI), the NASDAQ, Russell 1000 and 3000, NYSE, AMEX, S&P 100 (OEX), and Wilshire 5000. As well, the NY FANG Index also saw new all-time highs. Of the FAANG/MAGA stocks, both Google and Broadcom made all-time highs. Notable absences were the S&P 500 Equal Weight Index and the NASDAQ 100. A divergence?
On the week, the SPX gained a small 0.3%, the DJI fell 0.3%, the Dow Jones Transportations (DJT) fell 1.1%, and the NASDAQ was up 1.1%. The S&P 400 (Mid) was up 1.3% and the S&P 600 (Small) rose 0.8%. End of cycle rallies for both? The S&P 500 Equal Weight Index fell 0.1% while the NY FANG Index gained 2.7%.
In Canada, the TSX Composite made all-time highs again, up 1.7%. Driving it higher were the usual suspects of the TSX Gold Index (TGD), the TSX Metals & Mining Index (TGM), and the TSX Materials Index (TMT). All made all-time highs as did the TSX Financials Index (TFS) and the TSX Information Technology Index (TTK). The TSX Venture Exchange (CDNX) continued its climb, up 3.3%. In the EU, the London FTSE was up 0.2%, the EuroNext fell 1.0%, the Paris CAC 40 lost 0.4%, and the German DAX fell 1.3%. In Asia, China’s Shanghai Index (SSEC) lost 1.2%, the Tokyo Nikkei Dow (TKN) was up 0.7%, while Hong Kong’s Hang Seng (HSI) rose 1.4%. Nobody was making all-time highs in either the EU or Asia.
We, like many others, believe a top is coming. Except so far, a top is illusory. We are seeing the fear and greed indices fall to neutral. Exceptions are the new highs/new lows index and put/call options which continue to exhibit greed. At the other end, the safe haven index and junk bond yields are showing fear. Rising gold prices, a safe haven, are a sign of fear. Some believe a crash could be coming. After all, we are moving into the crash period that extends into October. Is there a black swan event lurking in the shadows? An unexpected event that shocks the market? That’s always a risk.
Nonetheless, markets have been showing distribution that occurs at highs. The smart money is exiting. Falling volume, even as the market moves higher, is one of the negative signs. Divergences in the indicators is another negative signal, with the market making new highs but indicators making lower highs. There are numerous reasons why one should be cautious right now, aside from the negative seasonality. Risks are climbing in the market. A shock could send us lower in a hurry.
The Scorecard
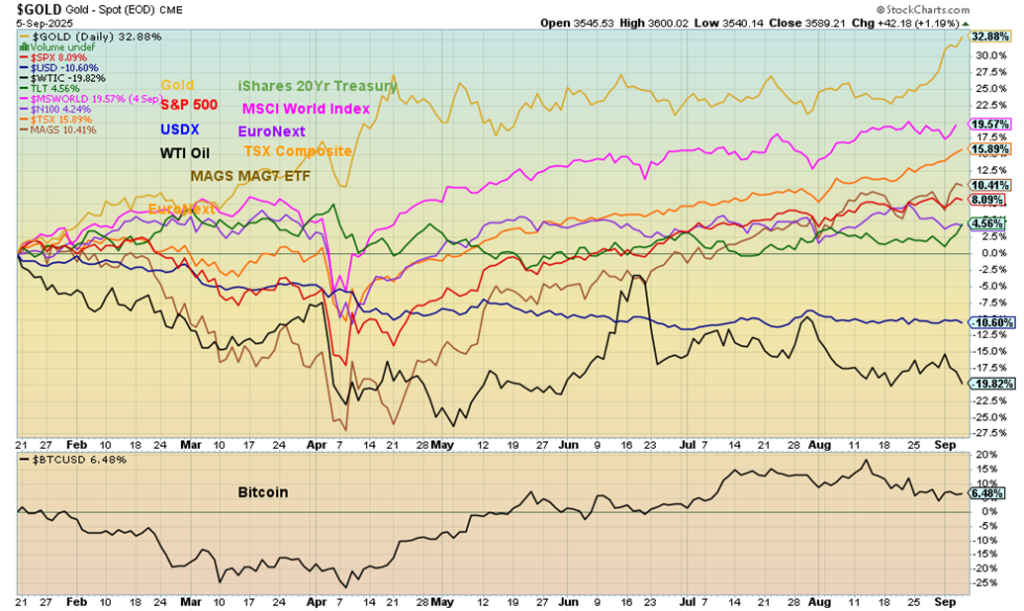
Gold’s recent surge has seen the yellow metal increase its lead over the rest, now up 32.8% since Inauguration Day on January 20. As we expected in our 2025 forecast, we believed the election of Donald Trump would be good for gold. We have not been disappointed. Gold rose 55% during Trump’s first term. Under Biden, gold rose slightly less, up 46%.
We have also noted that gold appears to rise more under Republican presidents than Democrat presidents. For example, under George W. Bush gold rose 223%. Under Obama gold was up only 44%. The MSCI World Index (ex USA) remains second, up 19.6%. The reigning loser is still WTI oil, down 19.8%. The US$ Index remains the only other loser, down 10.6%.
U.S. Bonds
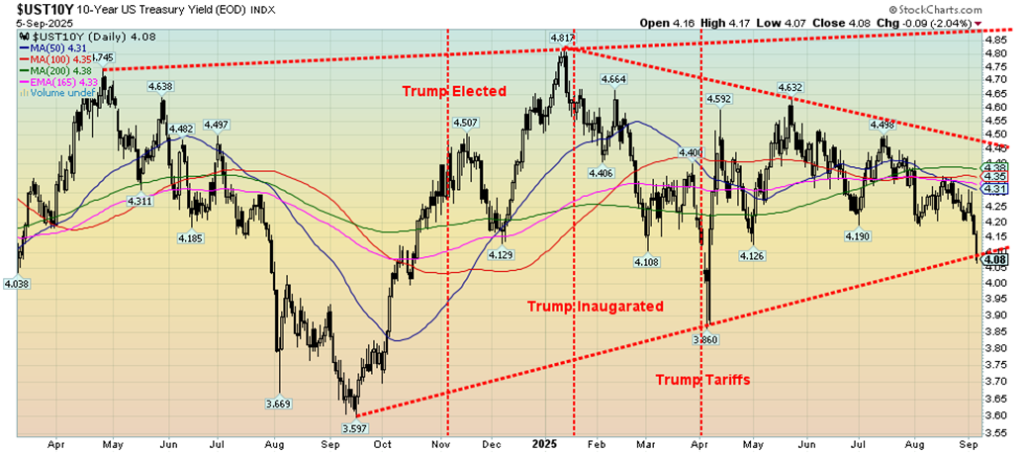
The 10-year U.S. Treasury note yield has now fallen to the bottom of the channel. The question now is, will it break it? Under 4% would be a good start towards confirming a breakdown. Minimum targets could be 3.85%, but could fall as low as 3.10%. A move back over 4.30% would suggest a low is in.
Gold
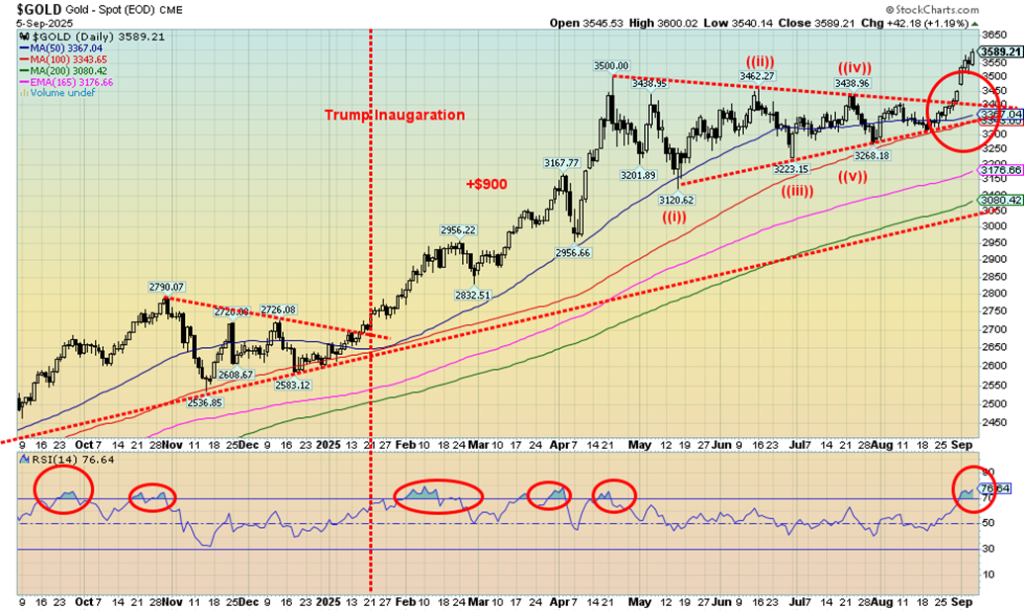
Gold! The shiny metal is the star, up a healthy 35.6% so far in 2025. Silver, gold’s junior partner, is up 40.1%. Gold is making all-time highs; silver, new 52-week highs. The gold stocks are soaring with the Gold Bugs Index (HUI) up 95.0% in 2025 to new 52-week highs while the TSX Gold Index (TGD) is up 91.1% to all-time highs. It has been a glorious period for the gold bugs.
Inflation, a slowing economy, rising unemployment, trade wars and Trump’s erratic approach to trade, real wars (Ukraine/Russia, Israel and everyone else in the Middle East), growing geopolitical tensions U.S. vs. Russia/China, G7 vs. BRICS, falling rates, potential for stagflation, Trump’s ongoing fight and takeover attempts with the Federal Reserve, his ongoing war to remake the federal civil service and fill positions with loyalists—it’s all out there.
Gold is the go-to safe haven asset in times of economic uncertainty, geopolitical tensions, and domestic political tensions (rising polarization in G7 countries). Gold, as we note, is up 35.6% in 2025, bonds (U.S. 20-year Treasury bond) are up 4.4% plus coupon, while Bitcoin is up 19.2%.
On the week, gold rose 3.9%, silver was up 3.0%, and platinum up 0.6%. Of the near precious metals, palladium fell 0.2% and copper dropped 1.1%. TGD gained 5.6% while the HUI jumped 4.3%. Helping gold’s rise was a continual decline in the US$ Index that was flat but gave up all its earlier gains on Friday following the employment reports. The US$ Index has been on a steady decline in 2025. The euro was up 0.2%, the Swiss franc was up 0.3%, the pound sterling was flat, while the Japanese yen fell 0.3%. The Cdn$, because of its weak employment report, lost 0.7%.
Over in the oil market, downward pressure continued. WTI oil dropped 3.1%, while Brent crude was off 2.7%. However, natural gas (NG) rebounded slightly with NG at the Henry Hub and EU Dutch Hub both up 1.0%. To no one’s surprise, the energy stocks fell with the ARCA Oil & Gas Index (XOI) off 3.2% and the TSX Energy Index (TEN) down 2.4%. Oil is being pressured by Saudi threats to up production and OPEC’s negative outlook.
Gold has now broken out of the ascending triangle formation that formed over the past five months. Targets are up to around $3,800. Many believe we’ll go even higher. Silver is targeting up to at least $42/$43. The gold stock indices are targeting HUI up to 550 and the TGD up to 645. It has been a great time to be in gold. The trouble is, right now all have reached into overbought territory with RSIs above 70. Granted, the RSI (and other indicators) can remain in overbought territory for some time, even a few weeks. So, it’s a warning sign, not necessarily a sign of a top. Worth noting is that we are continuing to see positive gains from junior miners. However, even the TSX Venture Exchange (CDNX) remains below its 2021 high.
Keep breakdown points in mind. The first breakdown point is 3,300 followed by 3,200. For silver, the points are $39.50 and $37.00. The gold stock indices have been in a steady rise since December 2024. Seasonally, we usually exhibit strength into September with a potential high in October followed by weakness into November/December. As the saying goes, you can’t go broke taking a profit. However, the conditions that have sparked this huge rally for gold are all in place and not expected to go away.
Could we have a melt-up? Yes, and as we note, our targets are above. Others have even higher targets but, as we say, one step at a time. Consolidations/corrections are healthy. Melt-ups are exhilarating but also potentially dangerous as too many get caught up in the euphoria. We’ve seen that many times. So, be long but be wary. We are always reminded that the one who became rich was the one that sold too early.
Markets & Trends
| % Gains (Losses) Trends | ||||||||
| Close Dec 31/24 | Close Sep 5/25 | Week | YTD | Daily (Short Term) | Weekly (Intermediate) | Monthly (Long Term) | ||
| S&P 500 | 5,881.63 | 6,481.50 (new highs) * | 0.3% | 10.2% | up | up | up | |
| Dow Jones Industrials | 42,544.22 | 45,400.86 (new highs) * | (0.3)% | 6.7% | up | up | up | |
| Dow Jones Transport | 16,030.66 | 15,727.85 | (1.1)% | (1.1)% | neutral | neutral | up | |
| NASDAQ | 19,310.79 | 21,700.39 (new highs) * | 1.1% | 12.4% | up | up | up | |
| S&P/TSX Composite | 24,796.40 | 29,050.63 (new highs) * | 1.7% | 17.5% | up | up | up | |
| S&P/TSX Venture (CDNX) | 597.87 | 857.25 (new highs) | 3.3% | 43.4% | up | up | up | |
| S&P 600 (small) | 1,408.17 | 1,449.75 | 0.8% | 3.0% | up | up | up | |
| MSCI World | 2,304.50 | 2,785.42 | 0.7% | 20.9% | up | up | up | |
| Bitcoin | 93,467.13 | 111,387.16 | 3.3% | 19.2% | down | up | up | |
| Gold Mining Stock Indices | ||||||||
| Gold Bugs Index (HUI) | 275.58 | 537.50 (new highs) | 4.3% | 95.0% | up | up | up | |
| TSX Gold Index (TGD) | 336.87 | 643.67 (new highs) * | 5.6% | 91.1% | up | up | up | |
| % | ||||||||
| U.S. 10-Year Treasury Bond yield | 4.58% | 4.08% | (3.6)% | (10.9)% | ||||
| Cdn. 10-Year Bond CGB yield | 3.25% | 3.27% | (3.3)% | 0.6% | ||||
| Recession Watch Spreads | ||||||||
| U.S. 2-year 10-year Treasury spread | 0.33% | 0.56% | (8.2)% | 69.7% | ||||
| Cdn 2-year 10-year CGB spread | 0.30% | 0.73% | (1.4)% | 143.3% | ||||
| Currencies | ||||||||
| US$ Index | 108.44 | 97.75 | flat | (9.9)% | down | down | down | |
| Canadian $ | 69.49 | 0.7227 | (0.7)% | 4.0% | up | up | neutral | |
| Euro | 103.54 | 117.18 | 0.2% | 13.2% | up | up | up | |
| Swiss Franc | 110.16 | 125.25 | 0.3% | 13.7% | up | up | up | |
| British Pound | 125.11 | 135.05 | flat | 8.0% | up | up | up | |
| Japanese Yen | 63.57 | 68.01 | flat | 6.9% | up (weak) | neutral | down (weak) | |
| Precious Metals | ||||||||
| Gold | 2,641.00 | 3,581.29 (new highs) * | 3.9% | 39.6% | up | up | up | |
| Silver | 29.24 | 40.95 (new highs) | 3.0% | 40.1% | up | up | up | |
| Platinum | 910.50 | 1,376.00 | 0.6% | 51.1% | up | up | up | |
| Base Metals | ||||||||
| Palladium | 909.80 | 1,106.50 | (0.1)% | 21.6% | up | up | down (weak) | |
| Copper | 4.03 | 4.47 | (1.1)% | 10.9% | down (weak) | down (weak) | up | |
| Energy | ||||||||
| WTI Oil | 71.72 | 62.05 | (3.1)% | (13.5)% | down | down | down | |
| Nat Gas | 3.63 | 3.04 | 1.0% | (16.3)% | down (weak) | down | down (weak) | |
Copyright David Chapman 2025
__
(Featured image by Michael Steinberg via Pexels)
DISCLAIMER: This article was written by a third party contributor and does not reflect the opinion of Born2Invest, its management, staff or its associates. Please review our disclaimer for more information.
This article may include forward-looking statements. These forward-looking statements generally are identified by the words “believe,” “project,” “estimate,” “become,” “plan,” “will,” and similar expressions, including with regards to potential earnings in the Empire Flippers affiliate program. These forward-looking statements involve known and unknown risks as well as uncertainties, including those discussed in the following cautionary statements and elsewhere in this article and on this site. Although the Company may believe that its expectations are based on reasonable assumptions, the actual results that the Company may achieve may differ materially from any forward-looking statements, which reflect the opinions of the management of the Company only as of the date hereof. Additionally, please make sure to read these important disclosures.
David Chapman is not a registered advisory service and is not an exempt market dealer (EMD) nor a licensed financial advisor. He does not and cannot give individualised market advice. David Chapman has worked in the financial industry for over 40 years including large financial corporations, banks, and investment dealers. The information in this newsletter is intended only for informational and educational purposes. It should not be construed as an offer, a solicitation of an offer or sale of any security. Every effort is made to provide accurate and complete information.
However, we cannot guarantee that there will be no errors. We make no claims, promises or guarantees about the accuracy, completeness, or adequacy of the contents of this commentary and expressly disclaim liability for errors and omissions in the contents of this commentary. David Chapman will always use his best efforts to ensure the accuracy and timeliness of all information. The reader assumes all risk when trading in securities and David Chapman advises consulting a licensed professional financial advisor or portfolio manager such as Enriched Investing Incorporated before proceeding with any trade or idea presented in this newsletter.
David Chapman may own shares in companies mentioned in this newsletter. Before making an investment, prospective investors should review each security’s offering documents which summarize the objectives, fees, expenses and associated risks. David Chapman shares his ideas and opinions for informational and educational purposes only and expects the reader to perform due diligence before considering a position in any security. That includes consulting with your own licensed professional financial advisor such as Enriched Investing Incorporated. Performance is not guaranteed, values change frequently, and past performance may not be repeated.


TopRanked.io Weekly Affiliate Digest: What’s Hot in Affiliate Marketing [Bovada Affiliate Program]
This week, we're mashing up 80s tech with 2020s private messaging apps. Why? Because Big Tech just dropped a big...


Euro Stablecoins Struggle to Compete with Dollar Dominance in Crypto Markets
Euro stablecoins remain marginal despite the euro’s global importance, with minimal trading volume compared to dollar rivals like USDT and...


Gilead Sciences Advances Growth Strategy with Focus on HIV, Oncology, and Innovation
Gilead Sciences focuses on developing treatments for HIV, cancer, and inflammatory diseases, driven by blockbuster drugs like Biktarvy. Growth relies...


Casablanca Stock Exchange Profits Surge in 2025 as Growth Momentum Strengthens
In 2025, Casablanca Stock Exchange profits rose 40% to MAD 50.9 billion. Net income grew 22.3%, driven by strong industrial...


Credibur Scales Rapidly: €2 Billion in Structured Debt Facilities in Six Months
Infrastructure fintech Credibur has added over two billion euros in structured debt facilities within six months. Its platform connects lenders,...
 |
|
 |  |
 |
|
-

 Fintech1 week ago
DZ Bank Pioneers Blockchain Bond Issuance, Advancing Tokenized Finance
-

 Markets5 days ago
Cotton Prices Rise Amid War Tensions, Weather Risks, and Supply Concerns
-

 Biotech2 weeks ago
Italy’s Pharmaceutical Sector Drives Innovation, Sustainability, and European Leadership
-
 Biotech2 days ago
Gilead Sciences Advances Growth Strategy with Focus on HIV, Oncology, and Innovation