Featured
Gold and stock markets weather out Trump’s storm
With the US diplomacy under attack due to accusations against President Trump, gold remained volatile and played the jack of all trades.

The markets effectively yawned. The very next day Trump issued another tweet saying “Never said when an attack on Syria would take place. Could be very soon or not so soon at all!” Then on Friday, April 13, 2018, after the markets were closed missile attacks were launched on Damascus. The markets did a yo-yo during the week with stocks down and gold up on April 11, 2018, then on April 12, 2018, it was stocks up and gold down. Friday’s market was down but stocks still ended the week on the plus side. Gold reversed on Friday and was up and also closed the week on the plus side. Stock markets and gold were reacting to the events of the week. And the events like the weather were akin to a “blizzard”.
The U.S. is quite versed in “gunboat” diplomacy. Only a year ago the U.S. fired 59 tomahawk missiles to hit a Syrian airfield. It was in retaliation for another alleged chemical attack by the Syrian government. Since Desert Storm in 1991, they have fired according to statistics over 2,200 tomahawk missiles at various targets and countries.
The “madman” theory of diplomacy is also not unusual. It has been best associated to former President Richard Nixon’s foreign policy in that they tried to make the Communist Bloc nations they were at war with think that Nixon was irrational and volatile and that he was so unhinged he might use nuclear weapons. Today the theory has been applied to North Korea’s Kim Jong-Un and to U.S. President Donald Trump. Except that markets do react to the presumed “madness.” When the rhetoric between Trump and Kim Jong-Un was hitting a fever pitch the markets reacted negatively. How the markets might respond to an actual clash between the “Great Powers,” the U.S., and Russia and even one between Iran and Israel is, of course, not known but is unlikely to be positive.
All of the rhetoric and threats do have consequences and markets do react positively or negatively to them. The threat of tariffs was the initial reason why the markets “tanked.” But when the market realized there were going to be negotiations, the market rebounded. And it is the same with the threat of war. Some might call it bluffing. It might even be a strategy to keep everybody unbalanced. For the markets, some might even call it “just noise.” Some noise as there have been over a dozen 1% up or down days since the markets topped back in January 2018.
Any attack on Syria is fraught with danger and unknowns. It is not as if this is the first time. Back in 2013 former President Obama also contemplated strikes against Syria. These never happened. At that time a deal was brokered with Russia to destroy Syria’s chemical weapons. That took place on a U.S. ship in the Mediterranean with U.N. inspectors present. Right after Trump tweeted, Defense Secretary James Mattis, a former Marine General, was dialing down the potential for an attack. Then after they did an attack on Friday, Defense Secretary Mattis announced it was “one-time shot.” Or is it? President Trump claimed it was “mission accomplished.”
As political analysts note, if Assad is overthrown what follows? The fall of Saddam in Iraq and Gaddafi in Libya ushered in a period of violence and chaos that continues today, especially in Libya. It also led to the rise of ISIS and other Islamic groups vying for power. After 17 years, Afghanistan remains in chaos with the Taliban controlling most of the countryside. But Syria is taking on a different tone with the potential for a clash between the U.S./Russia and Iran/Israel.
Markets, however, focus on earnings—unless, of course, something else gets in the way. With earnings season getting underway, the markets will return to looking at the economy and earnings. If they are good, the market will rally. But even if earnings are good there are dangers to the market besides the threat of war.
Lurking in the background are the ongoing Mueller investigation and lawsuits from women against President Trump. These are real wild cards, especially after the raid on Trump’s personal lawyer by the FBI and the seizing of a lot of documents. Trump’s lawyer, Michael Cohen, is now under criminal investigation. The investigation, coupled with the FBI seizing documents, could be the real threat to Trump`s presidency. No wonder there is much debate over whether Trump could and will fire special counsel Mueller. Many believe first he would have to fire Deputy Attorney General Rob Rosenstein. Current attacks are centering on Rosenstein. That might also involve firing Attorney General Jeff Sessions. Some have said Trump would have to do a “full” Richard Nixon by firing Sessions, followed by Rosenstein, then Mueller.
A Saturday night massacre would not go down well with markets. It would most likely create a constitutional crisis. Nixon’s troubled tenure as President featured the Watergate break-in against the backdrop of the war in Vietnam, Vietnam war protests, the expansion of the war into Cambodia, and culminating in the Arab oil crisis and the eventual end of the Vietnam war.
During Nixon`s tenure as President, from the time he was inaugurated until his resignation, the Dow Jones Industrials (DJI) fell 50%. Nixon was elected while Vietnam war protests paralyzed the Democratic convention in Chicago in 1968. Former President Lyndon Johnson would not run again. From the time of Nixon’s inauguration, the DJI fell and by June 1970 was down 35%. During this period there were huge anti-war demonstrations culminating in the Kent State shootings in June 1970 and the world learning about the secret bombings in Cambodia. A mild recession took place throughout 1970 triggered by rising interest rates and attempts to get Vietnam war spending under control.
The U.S. economy began to recover in 1971 and, while the Vietnam war raged on, attempts were being made for a peace treaty that would bring U.S. troops back home. The 1972 election was highlighted by the Watergate break-in in June 1972. With Nixon re-elected by an overwhelming majority, the markets rose in January 1973 on the back of what became known as the “Nifty Fifty” rally. The markets began to become concerned about the Watergate crisis and, coupled with rising interest rates due to the huge expenditures required by the war in Vietnam, markets began to roll over. It is noteworthy that Richard Nixon took the world off the gold standard in August 1971, triggering the end of the Bretton Woods agreement and setting off a speculation against the U.S. Dollar.
October 1973 was a dramatic month. Not only did the Saturday night massacre take place, but Vice President Spiro Agnew was forced to resign because of corruption and tax evasion, and the Arab oil crisis and embargo got underway. The stock markets started a collapse that didn`t see a final bottom until December 1974. Nixon resigned in August 1974. The markets had fallen 48% since October 1973.
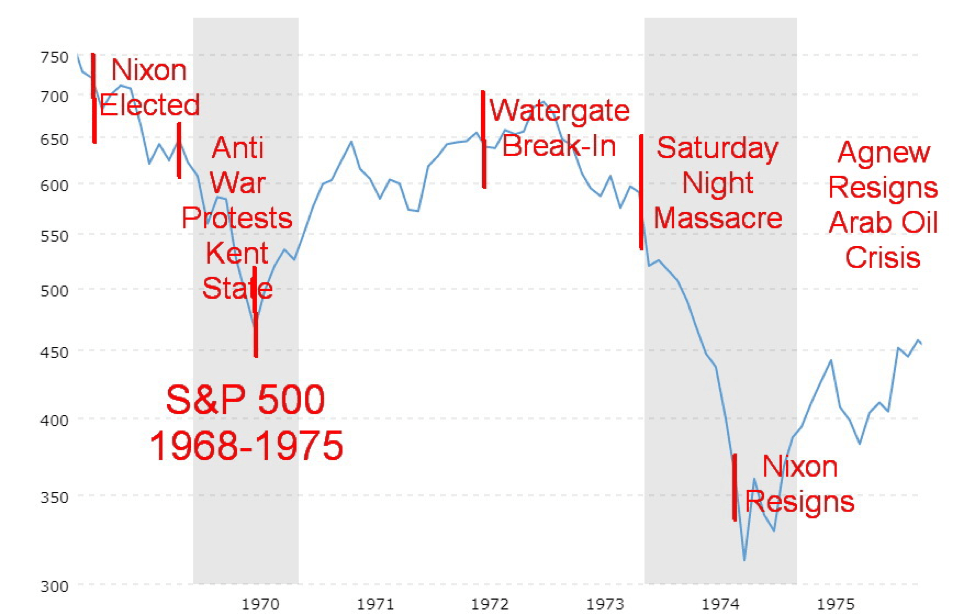
Note: Shaded areas denote recessions. © David Chapman
We tell all of this as there are lessons for the current market given the background of rising interest rates, a bull market that has been mostly rising for the past nine years, pressure against the U.S. Dollar, the potential for a war in the mid-East, and the tightening investigation into Trump. Like Trump, Nixon wanted to end the investigation into Watergate.
While Trump’s presidency has not been against the backdrop of anti-war protests, there have been numerous other protests over the past year that have reached the levels of those seen during the Vietnam war years, including the Nixon presidency. These have included Black Lives Matter protests related to police killings, gun control protests, the Dakota Access Pipeline protests, the #MeToo women’s protests, protests over healthcare and travel bans, and clashes between supporters of Trump and those against him that involved white supremacists. Many of these protests turned violent and involved riot police.
The dial has turned down on tariffs and a trade war with China. There are notes of caution with regard to an attack on Syria. The Mueller investigation is ongoing but still mostly a war of words with the President. But adding to the war of the words was the release of former FBI director James Comey`s book A Higher Loyalty. The book is proving to be quite controversial with name calling emanating from both sides. James Comey is a “slime ball” and Donald Trump is a “mob boss”.
But some good earnings reports might allow the market to rise back towards the former highs and even make new highs. We may look back at the January 26, 2018, high as the nominal high even if we do see new highs. There are too many dark clouds gathering. And, lest we forget, the Fed will no doubt continue its interest rate hikes, an event that adds further pressure on the markets. Safety and safe haven are becoming bywords.
Economic war between the U.S. and Russia
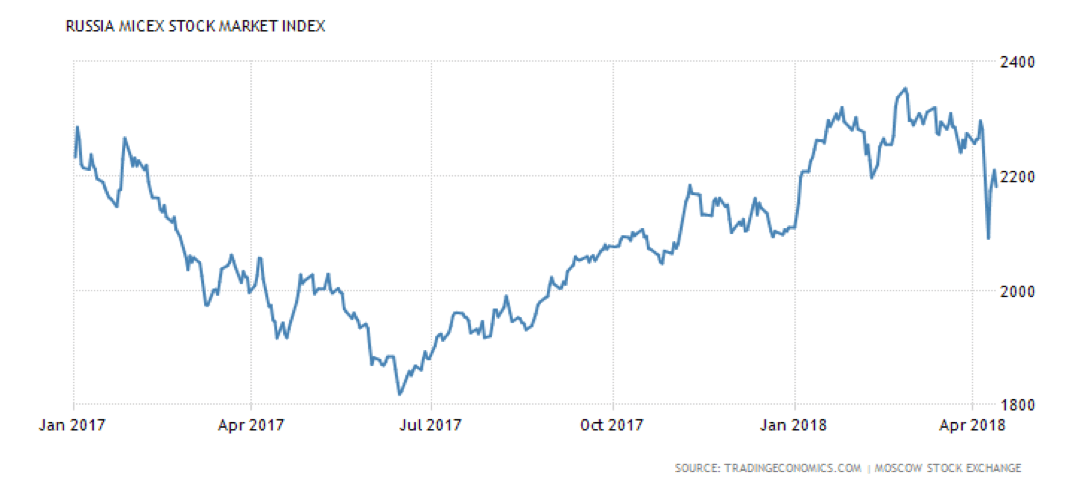
Sanctions do have consequences. Since the U.S. announced sanctions against a number of Russian oligarchs on April 6, 2018, the Russian Ruble, the Moscow Stock Exchange, and the stocks of a number of companies associated with the oligarchs that were sanctioned all took “hits.” The message seems to be that if Russia places sanctions against U.S. companies or “bosses” that operate in Russia that too could have a similar impact on their stocks. The market is still waiting for what Russia might do.
© David Chapman
Overall, the U.S. placed sanctions against 17 senior government officials, 7 oligarchs, and 12 companies the oligarchs own or control. Investors fled. There is even talk of imposing sanctions against holders of Russian debt. This latter thought is interesting as there is an estimated US$529 billion of Russian external debt. That debt is held by many foreign financial institutions in both the EU and the U.S. That in turn could in turn trigger defaults and significant losses to the holders of the debt. That scenario is unlikely to happen. And now there is talk of even more sanctions. Where and how does it end?
However, sanctions are having a “bite,” and unintended consequences. Hurt in the crossfire is Glencore (GLEN-LSE) a giant metals and oil and gas company. One of the companies hit is Rusal, primarily owned by sanctioned billionaire Oleg Deripaska. It appears that Rusal is the world’s second-largest aluminum company and supplies the world some 6% of supply and makes up a third of inventories on the London Metal Exchange (LME). It has caused aluminum prices to spike which in turn has negatively impacted U.S. companies. The head of metals at BMO Capital Markets has said “We can’t make it without Rusal. We need Rusal material.”
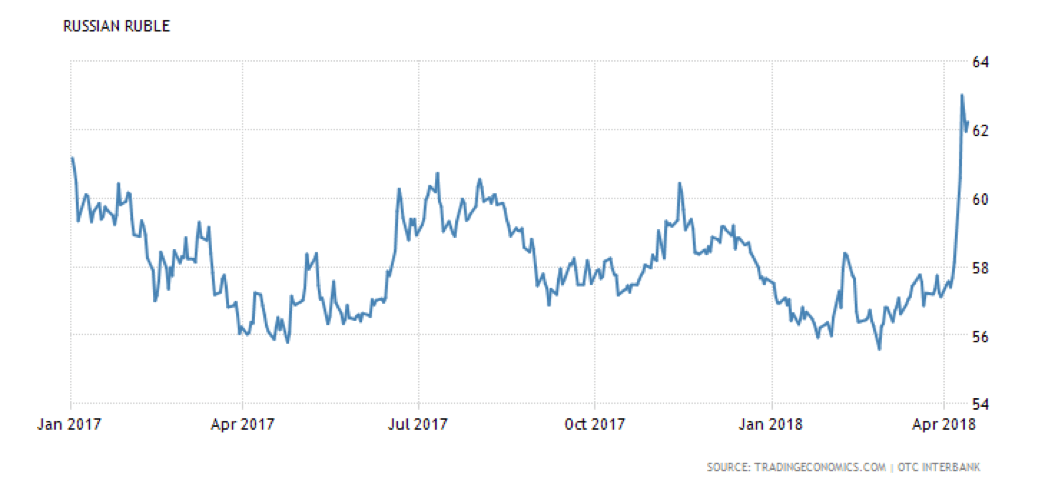
Note: The chart above is US$/Ruble so a fall in the value of the Ruble would show on the chart as a rise in the price of US$/Ruble. What it is saying is that it a US$ can buy a lot more Rubles. © David Chapman
It goes further. Rusal aluminum has been used to settle futures contracts on the COMEX and the LME. That won’t be happening any longer. No word on where they will get their aluminum. It is a serious loss of global supply. On the other hand, Rusal can re-direct its products to the Asian market. Now, what if the U.S. tried to place sanctions on those companies? International sanctions would effectively “mess up” all sorts of transactions, increasing not only the cost of business to Rusal but also the cost of business to users of aluminum everywhere. Shares in Rusal had fallen at one point by almost 60%. It is estimated that the Russian oligarchs lost upwards of $7.5 billion after the announcement of sanctions. Deripaska owns stakes in other companies hit by sanctions as well. Rusal is not the only one.
The sanctions are also hitting oil prices. Russia is the world’s largest producer of oil. The sanctions, coupled with the tensions in the Mid-East, have helped push oil prices to the highest level since 2014. Brent crude is up to $72 up from $60 in February 2018. Finally, the sanctions are unexpectedly impacting the Swiss Franc. Seems that sanctions include Swiss companies where the Russian oligarchs are invested. Given the need for liquidity, the Russians have little need to keep funds in Switzerland. Capital is flowing out of Switzerland. It is unknown what impact this could have on London where many Russian oligarchs operate.
Sanctions have consequences—and often unintended ones. The markets await the Russian response that could cause more disruptions. Tariffs, sanctions, markets take notice.
Bitcoin watch!
© David Chapman
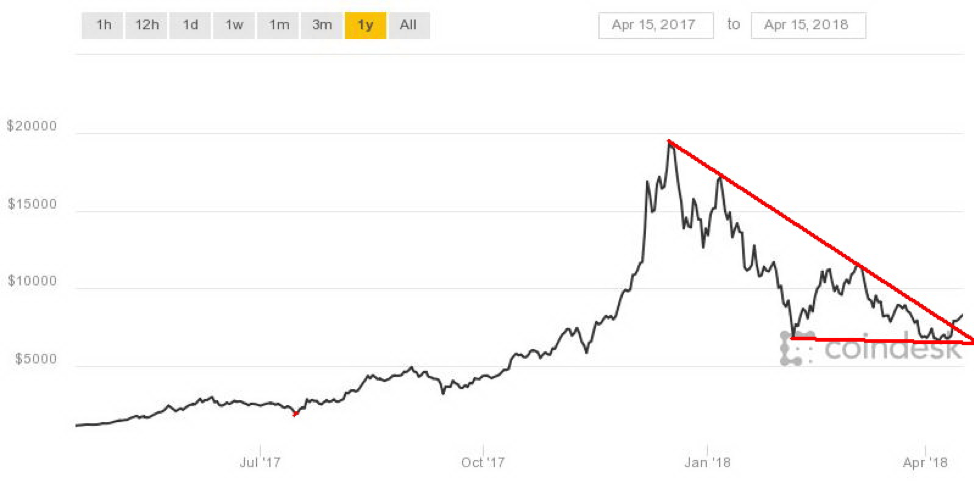
Is the cryptocurrency bear over? Bitcoin and the other cryptocurrencies jumped sharply this past week with Bitcoin jumping over $8,000 once again. The market cap of all cryptocurrencies leaped to $324 billion from $249 billion, according to Coin Market Cap. It was difficult to find the reason for the jump except for the usual short covering. Recall that now there is a futures exchange for the trading of Bitcoin. Futures can be both purchased and sold, including short-selling. Short-selling futures is normal activity and does not have the same constraints that surround short-selling stocks. It would be very difficult to short Bitcoin except through futures.
Technicians are calling it a bullish breakout. Stories abound that Bitcoin and the cryptocurrencies are priming for a major bull move. Yet stories still come out that there are scams, money laundering, and exchanges being shut down or constrained. Certainly, Bitcoin appears to have broken out and now sits at the cusp of a further breakout. Above $8,500 could see Bitcoin move to higher levels above $9,000. Bitcoin failed to break down under $6,500, a level that would have suggested lower prices ahead. Still, sudden moves out of nowhere usually end in failure. Unless Bitcoin can successfully take out $8,500 and $9,000 we view this as nothing more than a sudden pop that should end with Bitcoin resuming its downtrend.
Markets and trends
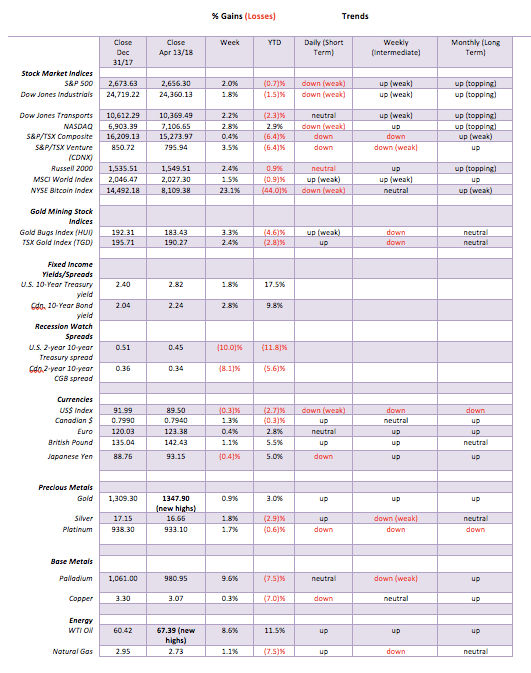
Note: For an explanation of the trends, see the glossary at the end of this article.
New highs/lows refer to new 52-week highs/lows. © David Chapman
© David Chapman
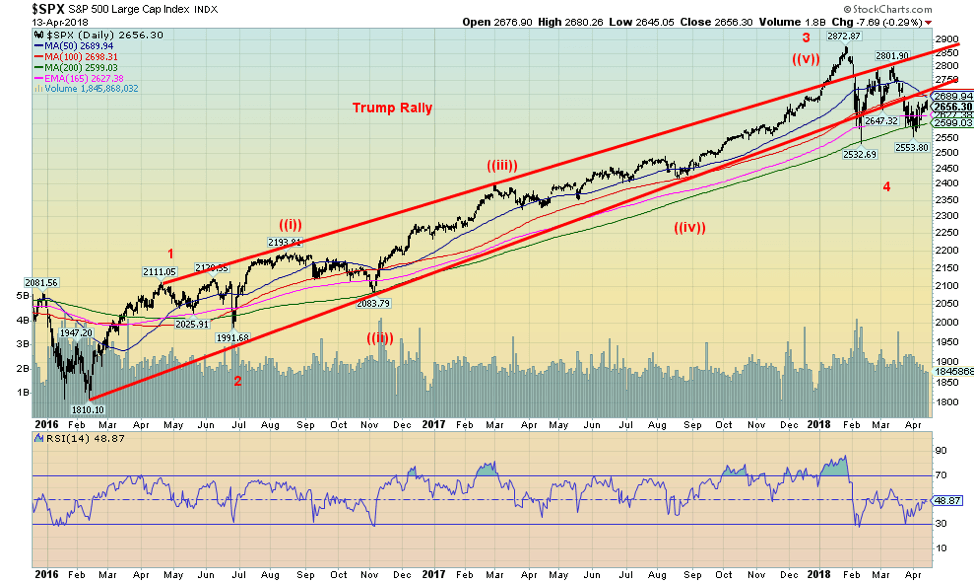
The S&P 500 continues to hold the 200-day MA and therefore is holding the uptrend. The S&P 500 needs to rise above 2,700 to suggest that the S&P 500 could be headed back to test the high at 2,872. Friday’s action saw the S&P 500 make slight new highs for the current up move, then reverse and put in an outside day and closing lower. In the background was all the goings-on with what turned out to be a rather dramatic Friday the 13th. Friday’s low was seen at 2,645 so a move below that level and especially below 2,625 would suggest that the S&P 500 is headed lower. The 200-day MA is seen at 2,600 so it is possible that another move down could make new lows below 2,554 the April 2, 2018 low. The low thus far in this move was seen on February 9, 2018, at 2,532. None of this suggests that a meltdown is underway, but that the corrective that got underway in late January is clearly not over yet. But as we show below there are a number of positive signs suggesting the market could and should recover and then challenge the previous highs. A failure to make new lows on this pullback would set up a move to the upside. The background noise is negative but the market is not making new lows with it. At least not as yet. Friday’s fears could reverse and turn into a sigh of relief.
© David Chapman
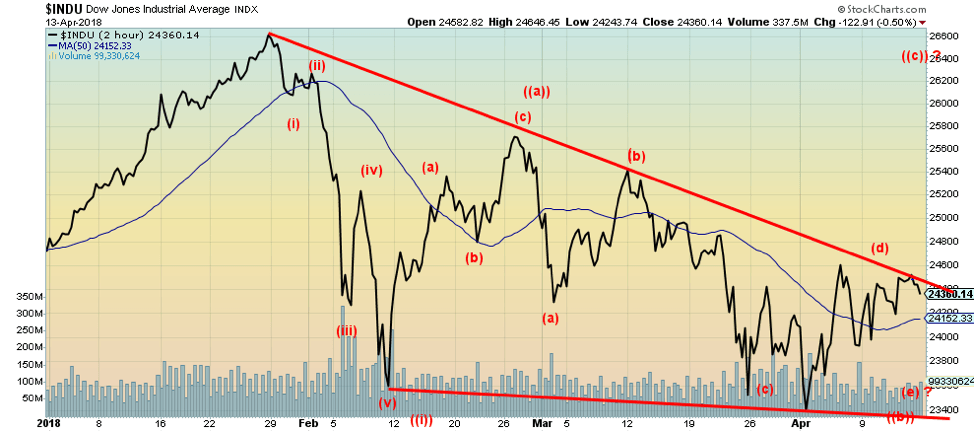
We rarely show intraday charts but we thought this 2-hour chart of the Dow Jones Industrials told a story. It shows what appears to be a five-wave decline from the top on January 26, 2018. This could be an impulse wave down and suggest, as Elliott Wave International says, the market made its final top in January. So that could be the first wave down. But the corrective wave can be quite tricky and, so far, what we see here is just a series of corrective waves. Corrective waves usually unfold as ABC type patterns. What we may have completed is an A wave up that topped just before the end of February followed by a B wave down that may or may not be complete. The DJI failed at the downtrend line and appears to be turning down once again. Could a B wave down be unfolding as an ABCDE type pattern? That is another typical corrective pattern. If that is correct, then there should be a C wave up that would unfold in five waves. The final C wave could take us toward the January 26, 2018 top or it could even make new all-time highs. A drop here below 24,100 could suggest that another down wave is underway (the E wave) that should bottom no lower than 23,400.
© David Chapman
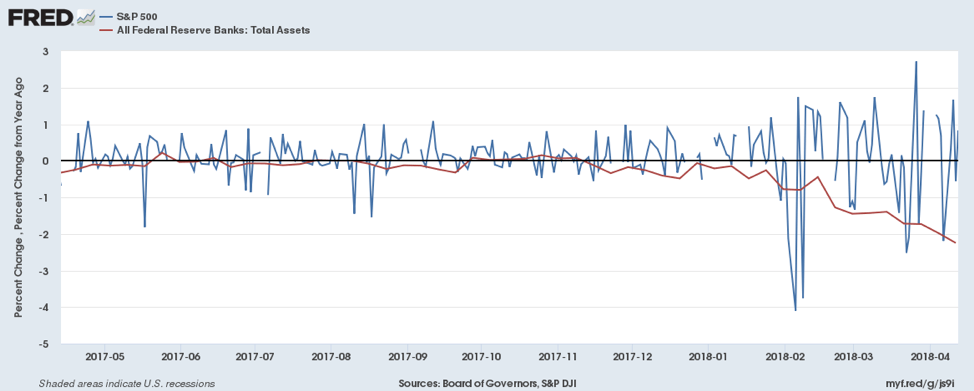
We are not sure whether this is a coincidence or not: a chart we saw at Tom McClellan’s Financial Publications caught our attention. This is a little different from what Tom McClellan posted. It does, however, have the same two components. The above chart compares the change in treasuries and MBS held by the Fed and changes to the S&P 500. As the Fed began its quantitative tightening (QT) program the S&P 500 went off the rails at about the same time. The Fed’s QT program is the unwinding of the assets acquired during its long period of quantitative easing (QE). The program is to proceed at the rate of $40 billion a month. By doing this, the Fed is sucking liquidity out of the financial system while at the same time hiking interest rates. As we note further on the bond market commentary, interest rates started rising in advance of the Fed tightening and before the QT program. Sucking liquidity out of the financial system does have a negative impact on the stock market, even if the reason given for the market falling is fear of the negative impact of trade policies.
© David Chapman
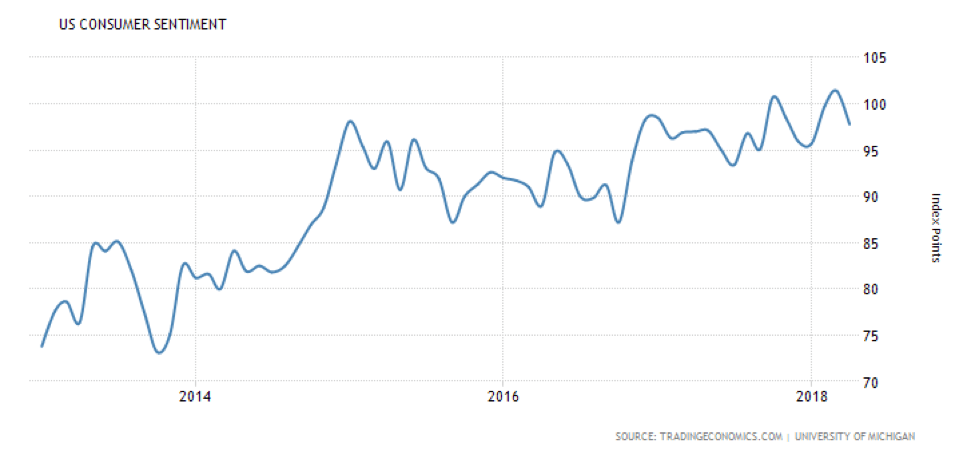
Consumer sentiment slipped in April to 97.8 vs. 101.4 in March. The consumer sentiment index above is the Michigan Sentiment Indicator. Consumer sentiment appears to be topping out as it runs into a wall around 100. The indicator came in below expectations of 100.5. Concerns were expressed about the potential impact of Trump’s trade policies and the impact on the domestic economy. Further behind were the threat of war, the widening Mueller investigations, and the FBI raids on Trump’s personal lawyer Michael Cohen. The index would start to break down under 95. Interestingly, the high point for the Michigan Sentiment Index was in January 2000 at 111.40. January 2000 proved to be the nominal top of the stock market following the high-tech/internet boom of the 1990s.
© David Chapman
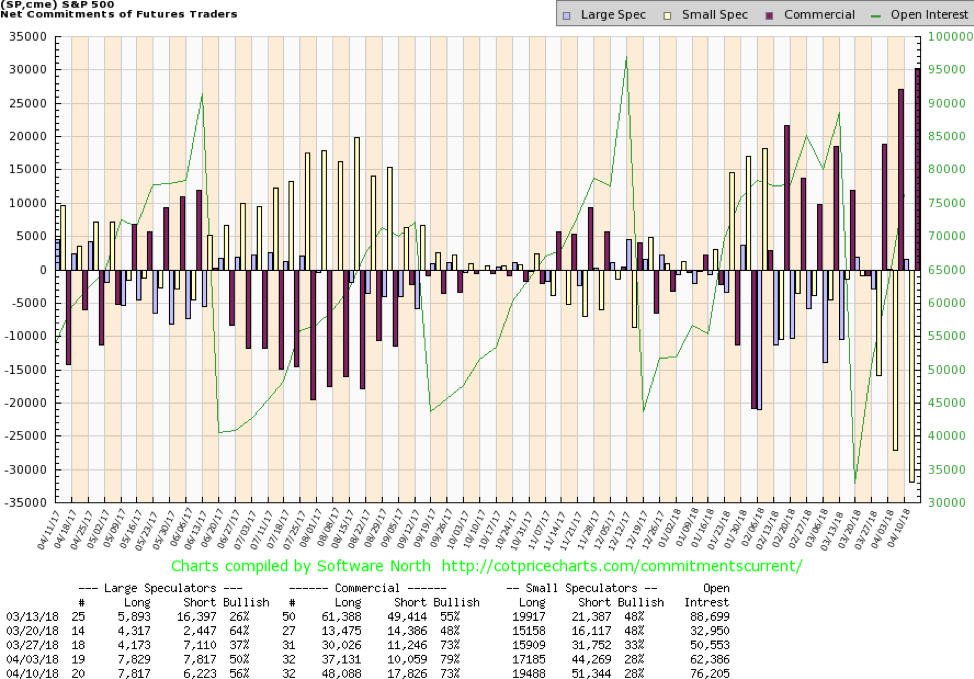
The bears seem to be still out in full force but the commercials have shifted to a more bullish stance. While the commercial COT for the S&P 500 slipped this past week to 73% from 79%, it is noteworthy that long open interest jumped roughly 11,000 contracts while the short open interest rose just under 8,000 contracts. The commercial COT is still telling us the market is more likely to rise going forward than it is to fall. That would suggest that any fall at this time could once again be a buying opportunity. We are entering the earnings season. Early results were positive. Good earnings may help drown out the negative background noise.
© David Chapman
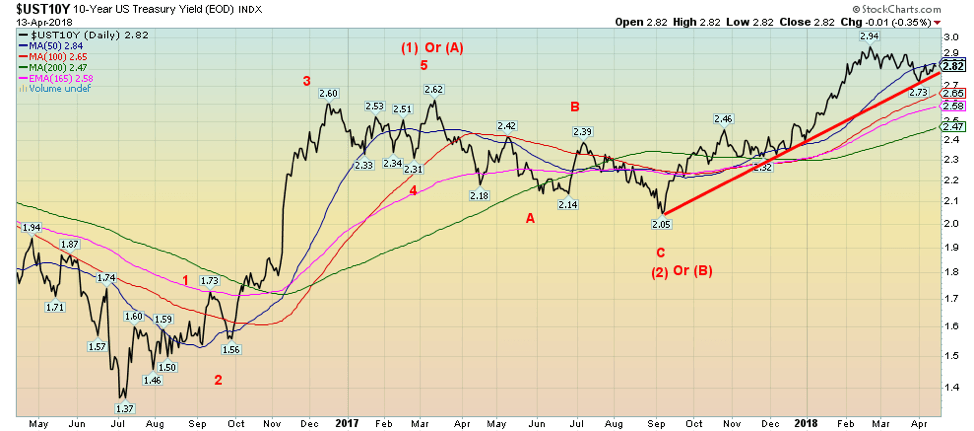
The 10-year U.S. Treasury note continues to waffle at just above an uptrend line. The 10-year rose to 2.82% this past week, up from 2.77% the previous week. This confirms our thoughts that the ultimate target for the 10-year is 3.20%. But to confirm a continued rise the 10-year needs to rise once again above 2.90%. A breakdown under 2.75% could suggest a decline to 2.65% and even down to 2.45%. The Fed continues to be on record for at least two more rate hikes in 2018 and more in 2019. Given darkening clouds on the horizon, our thoughts are the Fed hikes will eventually go too far, triggering a recession.
Recession watch spread
© David Chapman
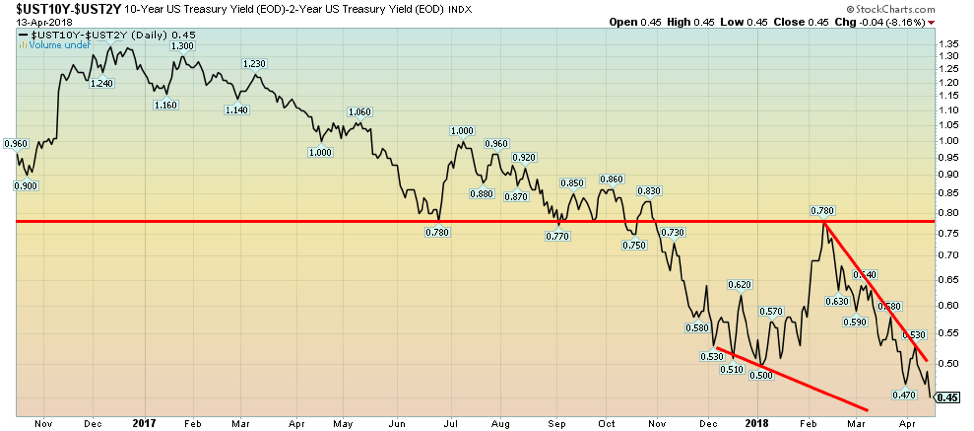
Our recession watch spread continues to narrow, falling to 0.45% this past week from 0.50% the previous week. The Canadian 2–10 spread also narrowed further this past week to 0.34% from 0.37%. Once again the spread is not in what we would call recession-warning territory. But the direction is firmly to the downside and the fall is picking up steam.
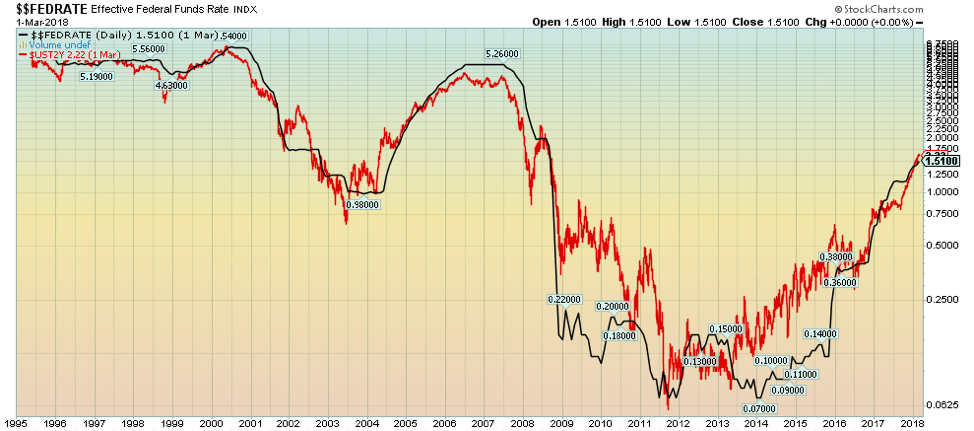
© David Chapman
This is a chart of the Effective Fed Funds rate overlaid with the 2-year U.S. Treasury note. The two are reasonably well correlated. However, notice the 2-year has a tendency to lead the Fed Funds. The 2-year started to rise in 2014/2015, well ahead of the rise of the Fed Funds. It is a statement that the bond market tends to lead the Fed, not the other way around. The Fed plays catch-up. Watch for the two-year to eventually turn down. Could be a clue as to when the Fed starts lowering interest rates.
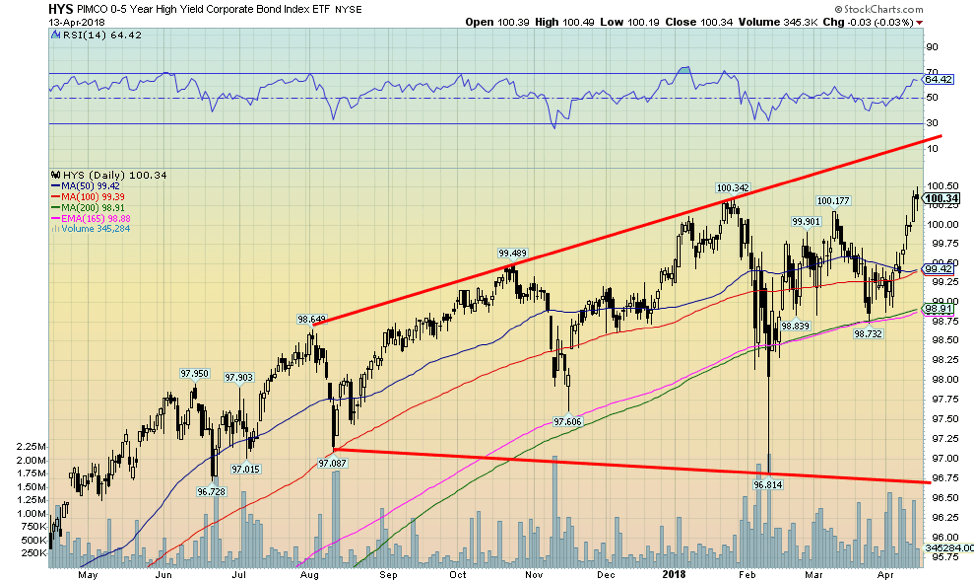
© David Chapman
If we are headed for a recession, the high-yield bond market is not reflecting it. Maybe it is rising as a reflection of investors seeking out high yield. The Pimco 0–5-year High Yield Corporate Bond Index ETF (HYS-NYSE) rose to new highs this past week. Initially, at least, the HYS plunged along with the stock market. But since then it has recovered sharply and now hit new highs. The HYS may be forming a broadening top. If that is correct then it could reach the top of the channel before turning down. Buyers of the ETF don’t seem to be concerned about the potential for defaults in the high-yield market. The HYS plunged in 2015/2016 along with the stock market. But before that, the HYS made a high in June 2014 followed by a plunge, and then a run to slight new highs in May 2015. Then the descent began. Could something similar be at play?
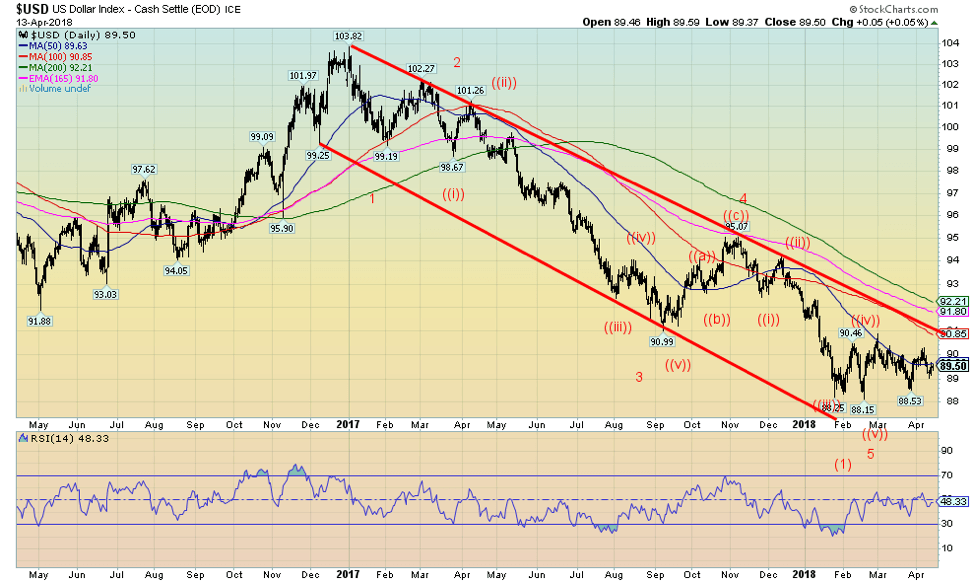
© David Chapman
Since making a low back on January 25, 2018, coinciding interestingly with the stock market top, the US$ Index has largely traded in a band between 88.50 and 90.50 with lows at 88.15 and highs at 90.89. So far, the 50-day MA (currently at 89.50) has effectively acted as resistance. Every time the US$ Index has indicated that it might rise higher, it fails and falls back down again. But it hasn’t really challenged the low of the range, either. The current stance of the US$ Index remains mildly bullish, but what is needed is a firm breakout above the 90.30 seen on April 6, 2018. Failure would mean the US$ Index is breaking below 89.00. There are arguments for either case. In looking at the Euro FX COT we note the commercials are quite short, implying the next move should be down for the Euro and up for the US$. They are also mildly short the British Pound but positive on the Cdn$ and rather neutral on the Japanese Yen. With an RSI at 48, indicators are neutral here too. So the best we can do is wait and see which way it goes before making any further stance on the direction of the US$ Index.
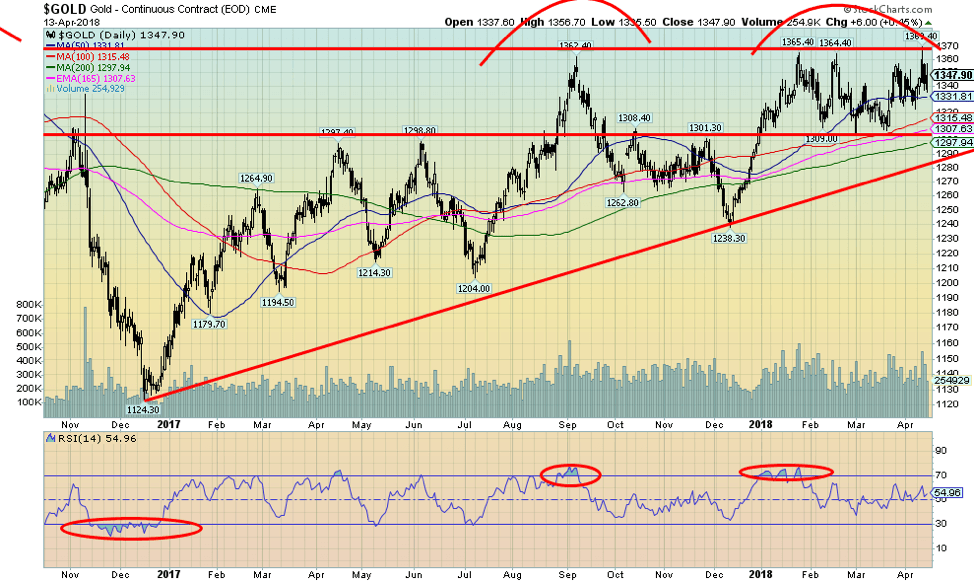
© David Chapman
Gold managed to finish up on the week this past week against background news that shoved it in both directions, both up and down. First, there was a surge in the early part of the week that took gold to new 52-week highs at $1,369.40. But that suddenly reversed and the next day gold was down over $20 from that high. Volatility rules the gold market as well. By Friday, though, gold reversed again and closed higher on the day, off about $12 from the new high. It is baffling as to what to make of it all. We have consistently said that gold has to break out over that entire $1,350/$1,375 resistance zone to suggest higher prices. For whatever reason sentiment has turned wildly bullish once again hitting 80% and there has been a preponderance of call buying. If we are bulls, it makes us nervous if everyone is jumping in expecting a breakout.
But on the other side gold has visited this $1,350/$1,375 zone on three significant occasions over the past two years. The first one was the high in July 2016 at $1,377. To date, that remains the high. Next, there was a high in September 2017 at $1,362, then a high at $1,365 in January 2018, followed by another thrust in February 2018 to $1,364 yet again in March to $1,357 and finally this week’s high at $1,369. Each and every time gold was pushed back. We could argue the pattern over the past few weeks is either a bullish pattern or it could be a bearish pattern. Even as gold made those four highs it made three lows at $1,309, $1,304 and $1,306 all in a space of about six weeks. So, which is it? A quadruple top or a triple bottom?
There is support at $1,330, $1,325 $1,315, $1,305, and finally at $1,295 with major support down to $1,280. Resistance is clear at $1,355 to $1,370. As we noted on our US$ Index commentary it too is range trading and this makes it difficult to predict which way we are going to go. The background news should be positive with threats of war, trade wars, and chaos in the White House. But gold’s inability to firmly breakthrough is concerning, especially when it should have good reason to do so. There are, of course, the ongoing comments that gold is being suppressed by the central banks. And quite possibly that is correct. Led by the Gold Anti-Trust Committee (GATA) many have worked very hard to prove that. That has been the argument since gold made its major top in September 2011 at $1,923. Since then, those that believe that gold should be rising have been increasingly frustrated. Still, against this background gold has been the best performing asset since 2000, outperforming the S&P 500 by a factor of 4.5. We continue to wait patiently for a breakout to the upside.
© David Chapman
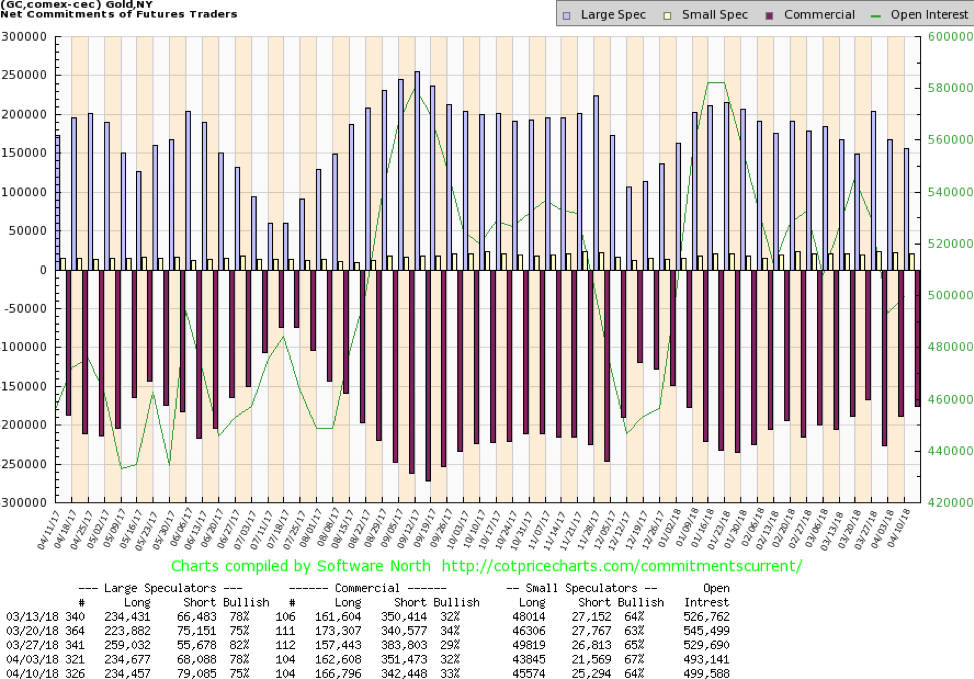
The commercial COT for gold improved marginally this past week to 33% from 32%. Short open interest fell about 9,000 contracts while long open interest rose roughly 4,000 contracts. The commercial COT for gold is at best mildly bullish. We’d prefer to see readings well over 40% to better convince us that the commercials are bullish. The large speculators (hedge funds, managed futures, etc.) saw their COT slip to 75% from 78% as their short open interest rose about 11,000 contracts this past week. While we are encouraged by the improvement in the commercial COT, as we note, the best we can say is it is mildly bullish.
© David Chapman
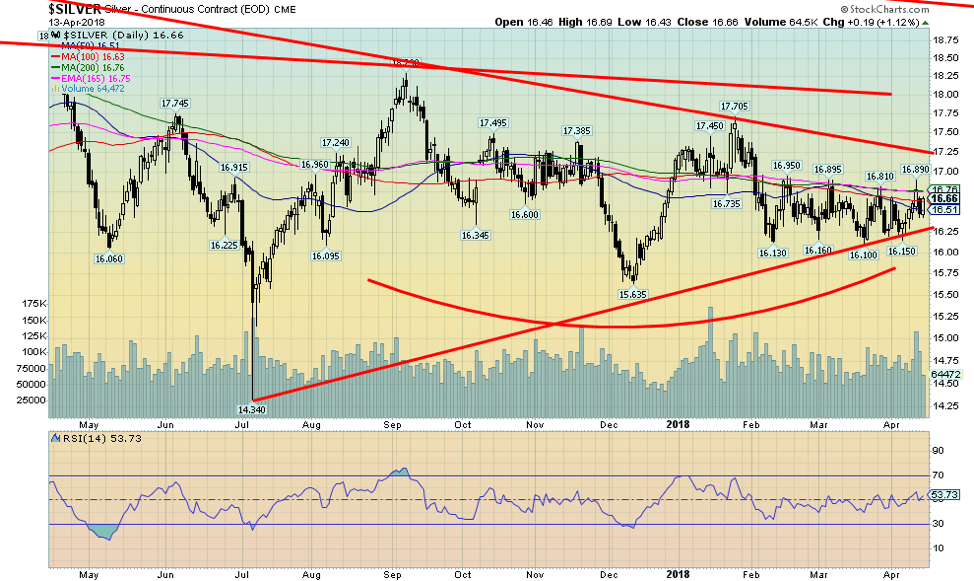
Silver has been even more frustrating than gold. Unlike gold, silver is not coming anywhere near earlier highs. In July 2016 silver made a high of $21.23. Since then its highs have been declining. Silver hit $19 in November 2016, $18.65 in April 201, $18.29 in September 2017, and $17.70 in January 2018. Since then silver runs into a wall around $16.90. But then it appears to have also found a floor around $16.10/$16.15. It has tested that zone four times in the past three months while also hitting up to $16.80/$16.90 four times as well. We call it a box pattern. We await the breakout of the box. Even once outside the box there is resistance up to 17.25. Below appears to have more room with support down to $15.60/$15.80. We doubt the downside but remain frustrated concerning the upside. The box has been defined and all we can do is wait to see which way it will break.
© David Chapman
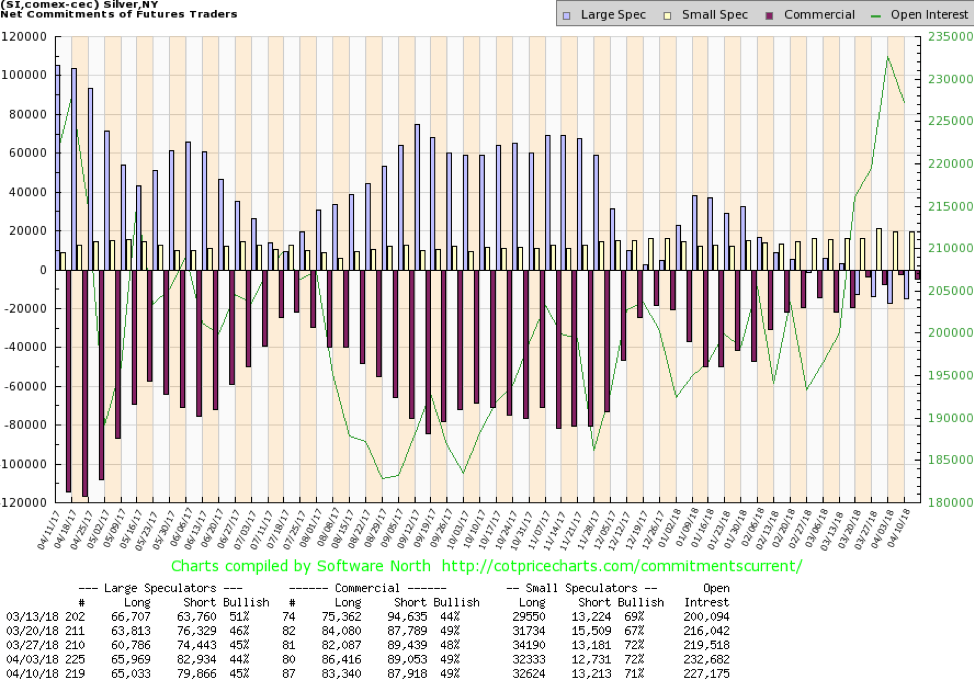
The commercial COT for silver remains very bullish. This past week the commercial COT was steady at 49% even as long open interest lost about 3,000 contracts but short open interest also fell just over 1,000 contracts. The large speculators remain in a net short position with their COT at 45%. We have rarely ever seen the large speculators COT in a net short position. Unusual in itself. The COT for silver remains highly bullish in favour of silver. Another reason why we believe the breakout should be to the upside.
© David Chapman
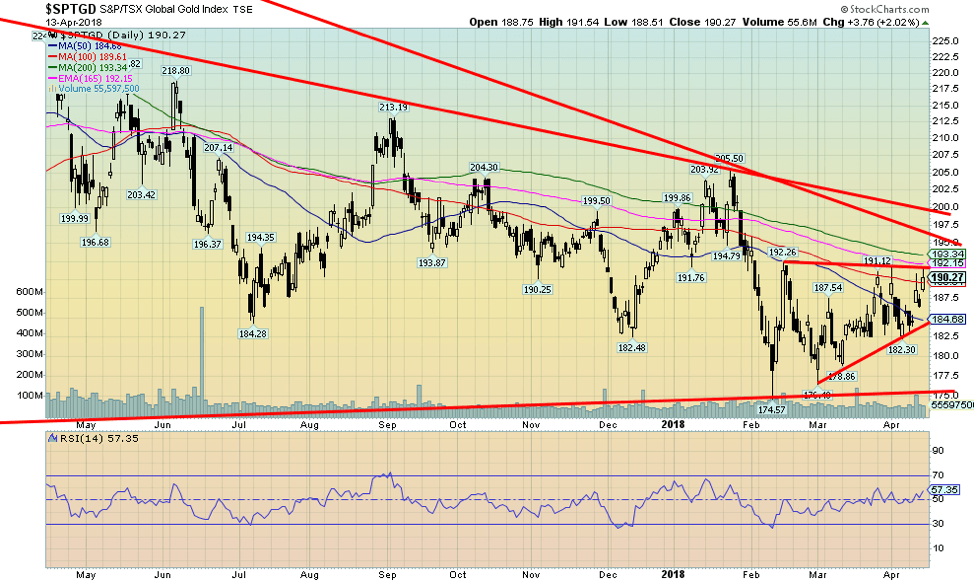
The gold stocks actually had a decent week with the Gold Bugs Index (HUI) up 3.3% and the TSX Gold Index (TGD) gaining 2.4%. The triangle forming on the TGD continues to appear bullish with an ascending look. The breakout would take place over 192 with potential to rise to 207. A rise to that level would see the TGD break out over further resistance seen at 195 to 200. Gold stocks remain considerably undervalued compared to gold. They have also been poor performers over the past number of years. None of that has stopped some mergers, and junior miners continue to raise funds although they have had to tap different sources rather than doing public issues. The best we can say is that the action this week was encouraging and the TGD should break out to the upside. But, overall, the gold stocks have been a major bust.
© David Chapman
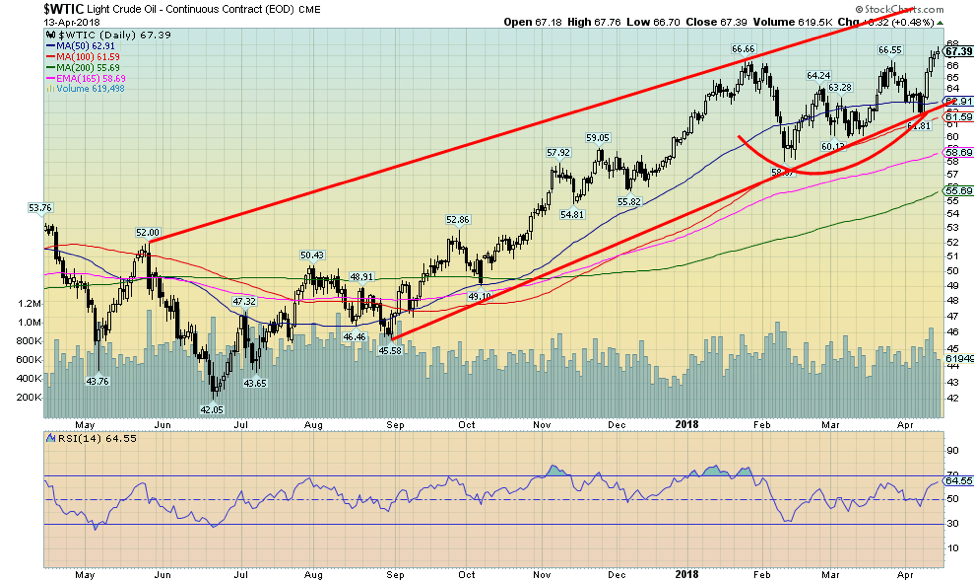
WTI oil prices rose to their highest level since December 2014 on fears of war in the Mid-East (Syria). Interestingly there is a gap on the WTI oil futures chart between $69 and $73 that was created way back in December 2014 when oil prices gapped down. We may now be testing that gap. A successful filling of the gap could suggest higher oil prices ahead. A failure would see oil prices fall back. Given it was announced that the missile launch against Syria was a “one shot,” it may well be that WTI oil pulls back again. WTI has been underperforming Brent crude. That’s not surprising given WTI is North American based vs. Brent which is more European/Asian based. The higher price is also bringing out more rigs in North America which could eventually have a dampening effect on the price. But right now, the fear appears to be war in the Mid-East and Mid-East worries have often driven oil prices in the past. There appears to be good support down to $63.
Chart(s) of the week
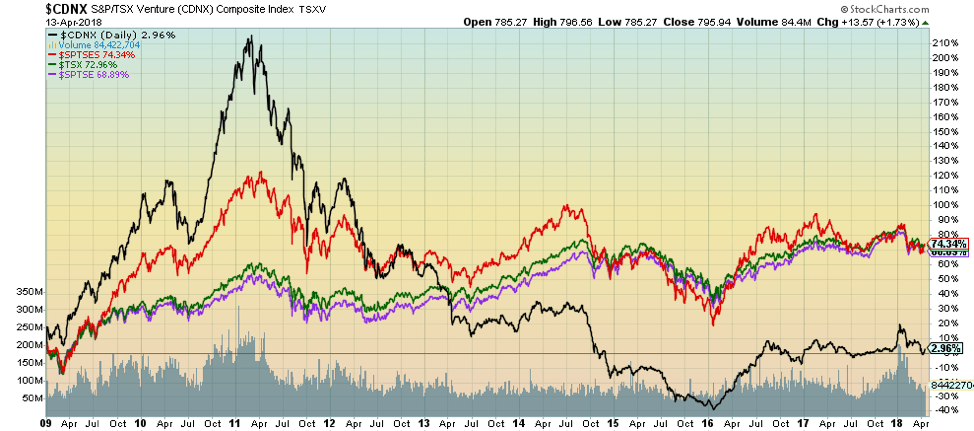
TSX Venture (CDNX), TSX Composite (TSX), TSX 60 (SPTSE), TSX Small Cap (SPTSES)
© David Chapman
This is a series of performance charts showing the TSX Composite and its sub-indices since the low of the financial crisis of 2007–2009. The first chart above shows the indices. The best performer was the TSX Small Cap Index with a gain of 74.3%. This is correct as during a bull market the small cap stocks tend to outperform. The large cap TSX 60 was only slightly behind with a gain of 68.9%. The TSX Composite itself was in the middle with a gain of 73.0%. Way behind was the junior venture exchange (CDNX) with a meagre 3.0% gain. The TSX Venture Exchange is dominated by junior mining stocks whose performance has been very poor since peaking in 2011. Note how they were up over 200% at one point that but their collapse actually took them negative during 2015. The biggest thing to note right now is that the junior venture exchange has been improving whereas the TSX Composite indices have seen their returns slow and actually appear to be rolling over.
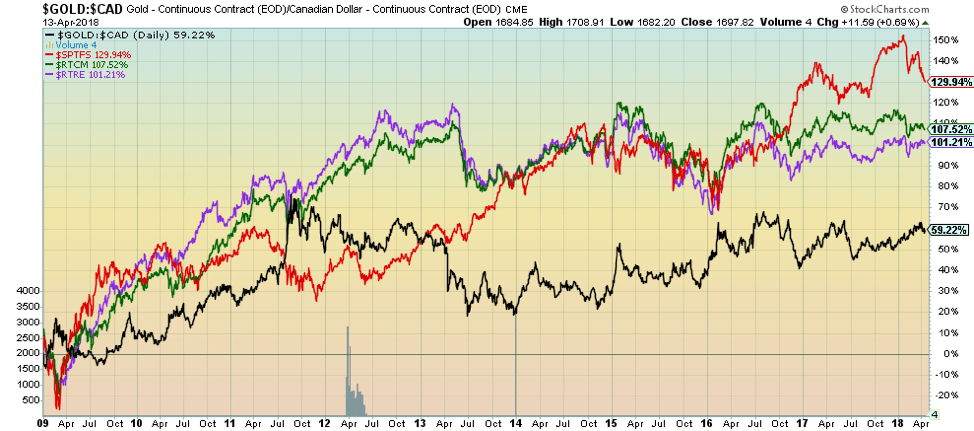
Gold in Cdn$, Financials (SPTFS), Income Trusts (RTCM), REITs (RTRE)
(Source: www.stockcharts.com)
Here we have compared the financial indices with gold expressed in Canadian dollars. Like the TSX Composite indices, their momentum appears to be slowing. Gold, on the other hand, has been in a slow rise since 2014 but still lags behind the financial indices. The TSX Financials sub-index has gained 129.9%, the TSX Income Trusts is up 107.5%, while the TSX REITs are up 101.2%. Given their slowing momentum vs. gold’s rising momentum, it appears to indicate that a shift is going on.
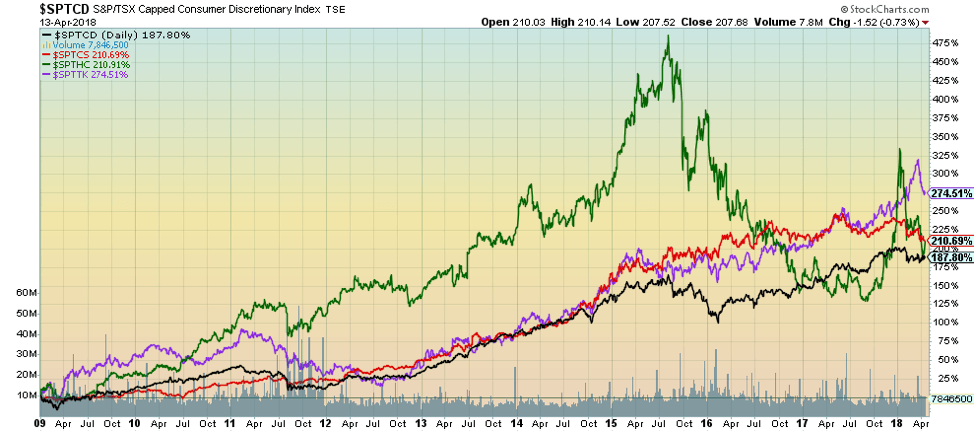
Consumer Discretionary (SPTCD), Consumer Staples (SPTCS), Health Care (SPTHC), Information Technology (SPTTK)
(Source: www.stockcharts.com)
These four sub-indices have been the best performers since the 2009 lows. But like the financials, their momentum has slowed while Health Care took quite a hit in 2015 thanks to Valeant. Health Care recovered recently but now appears to be falling quickly once again. Health Care is up 210.7% during the period, but that is well below the close to 475% it reached at Valeant’s peak. Even recently it reached a high of over 325% before falling sharply once again. Information Technology has been the best performer but it too appears to be pulling back. Still, it is up 274.2%. Consumer Staples is an area where investors seek safety and it has performed admirably, up 210.7%. Consumer Discretionary lags with a gain of 187.8%. Its momentum appears to be rising so it might be a sector to look at. But if the overall market slides, it most likely will slide with it.
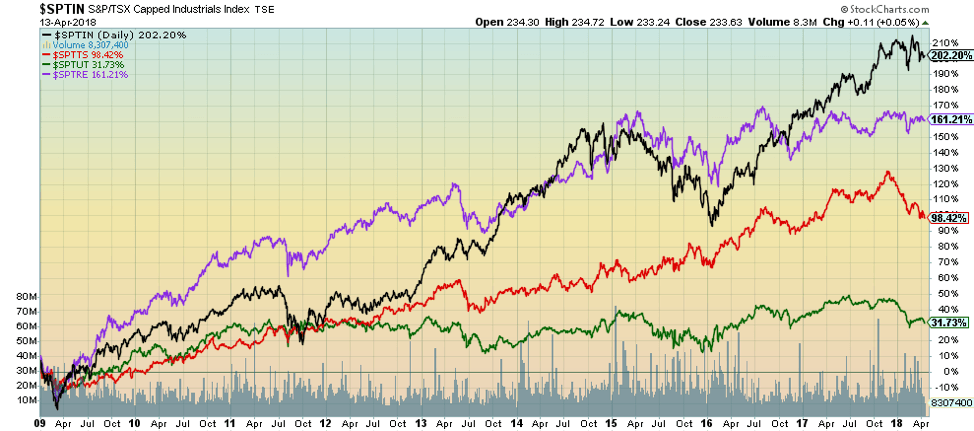
Industrials (SPTIN), Telecommunications (SPTTS), Utilities (SPTUT), Real Estate (SPTRE)
© David Chapman
Industrials have been a stellar performer and momentum still appears to be rising. But it has stalled so some caution is advised. Industrials are up 202.2% since 2009. The other sub-indices all appear to be rolling over if not falling. Still, Telecommunications is up 98.4%, Real Estate has been a stellar performer that is up 161.2%, while Utilities have lagged badly, up only 31.7%. Given that all are stalling in terms of momentum, some caution should be exercised with stocks from this group.
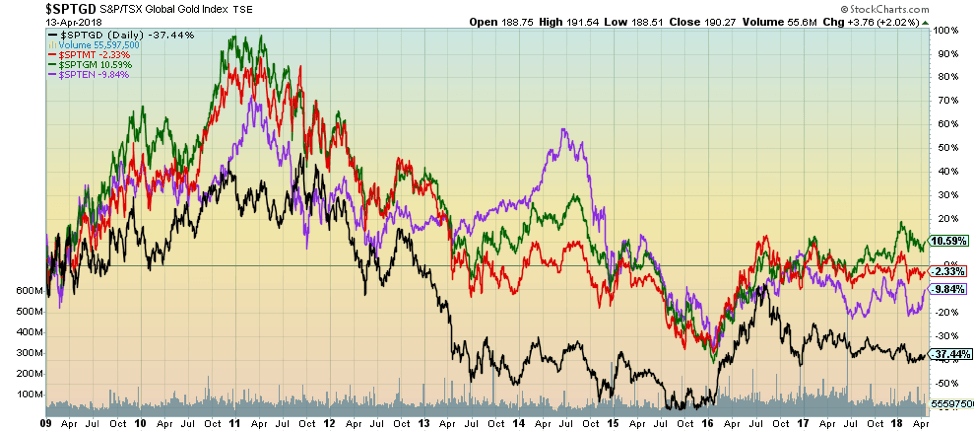
Gold (SPTGD), Materials (SPTMT), Metals & Mining (SPTGM), Energy (SPTEN)
© David Chapman
Finally, the misery sub-indices. There is nothing positive to say about this group. Their performance has been miserable since the lows of 2009. They started out like gangbusters but died quickly and solid gains became a market going down, down, down. However, all have recovered from their lows even if they are not as yet positive. The best performer has been the Metals & Mining group, up a paltry 10.6%. The rest are negative with Materials down 2.3%, the Energy group down 9.8%, and the worst performer Gold down 37.4%. Indeed, that gold stocks are down even as gold itself is up is a bit of anomaly. But despite the misery, this is probably the sector for investors to be looking at now. Yesterday’s dog can become tomorrow’s star After mostly six years of misery they are overdue for a turnaround.
(Featured Image by Gage Skidmore via Wikimedia Commons. CC BY-SA 2.0)
—
DISCLAIMER
David Chapman is not a registered advisory service and is not an exempt market dealer (EMD). We do not and cannot give individualized market advice. The information in this newsletter is intended only for informational and educational purposes. It should not be considered a solicitation of an offer or sale of any security. The reader assumes all risk when trading in securities and David Chapman advises consulting a licensed professional financial advisor before proceeding with any trade or idea presented in this newsletter. We share our ideas and opinions for informational and educational purposes only and expect the reader to perform due diligence before considering a position in any security. That includes consulting with your own licensed professional financial advisor.

-

 Business1 week ago
The TopRanked.io Weekly Digest: What’s Hot in Affiliate Marketing [uMobix Affiliate Program Review 2026]
-

 Cannabis2 weeks ago
Spain Launches Registration Process for Standardized Medical Cannabis Preparations
-

 Biotech2 days ago
ByBug Turns Insect Larvae into Low-Cost Biofactories for Animal Health
-

 Impact Investing1 week ago
Green Bonds Take Center Stage as GSS Market Matures


You must be logged in to post a comment Login