Business
What’s with gold and the Dow Jones in late September?
The 2020 37% market decline for the Dow Jones took only twenty-eight NYSE trading sessions. Historically, a 37% decline for the Dow Jones is a respectable claw back from the bulls by Mr Bear. I remain very positive on the XAU as well as gold and silver bullion. I would not be surprised seeing the XAU at the #1 position in the table below before 2021 arrives.

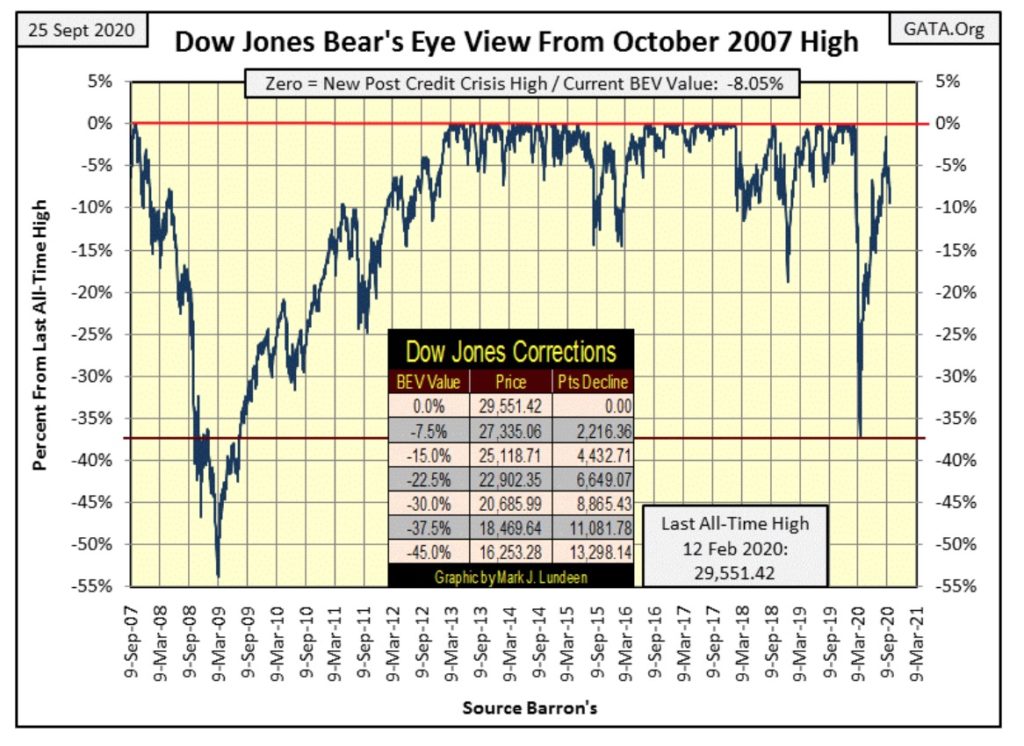
Gold and the Dow Jones have one thing in common; since their recent highs, the bears have yet to force them to correct by double-digit percentages. For gold, whose last BEV Zero was on August 6th ($2,061.44), two months have passed since its current correction began. The Dow Jones saw its last BEV Zero on February 12th, from where it collapsed by 37% a month later. To make the analogy fairer with gold’s BEV chart shown later in this article, I’m using the Dow Jones closing of September 2nd, a month ago when it closed just 1.53% from taking out its last all-time high of last February as the base for its current correction.
So, for both gold and the Dow Jones, neither have yet corrected 10% from their highs as noted above. The question in my mind is will they, and if so how deep into double-digits? That’s a question I don’t have a firm answer to, but let’s look at the Dow Jones BEV chart below and see what we can about it.
The first thing I note is how swiftly the Dow Jones’ 2020 37% market decline, and rebound was compared to the decline and rebound from its sub-prime bear market. It took about eighteen months, from October 2007 to March 2009 for the Dow Jones to decline 54%, and then forty-eight months, from March 2009 to March 2013 for it to recoup its sub-prime bear market losses.
The 2020 37% market decline for the Dow Jones took only twenty-eight NYSE trading sessions; what the hell?! Since 1885, the Dow Jones has never seen anything like that. And then the Dow Jones rebounded from its March 23rd low to come to within 1.53% of making a new all-time high in only 114 NYSE trading sessions. Again, since 1885 the Dow Jones has never recovered so swiftly from such a deep market bottom.
In the Bear’s Eye View chart below, look at how narrow the Dow Jones 2020 decline and recovery is compared to the 2007-2013 sub-prime bear market decline and recovery. I know the 2007-2009 54% market decline was the Dow Jones’ second deepest percentage decline since 1885, exceeded only by the 1929-32 89% market crash. But historically, a 37% decline for the Dow Jones is a respectable claw back from the bulls by Mr Bear, but in just twenty-eight trading sessions? And then a rebound to just 1.53% short of a new all-time high in only 114 trading sessions?
I know I’m repeating myself, but this is really weird and I want to make this point stick; going back to 1885, the 2020 37% market decline and recovery is without historical precedence.
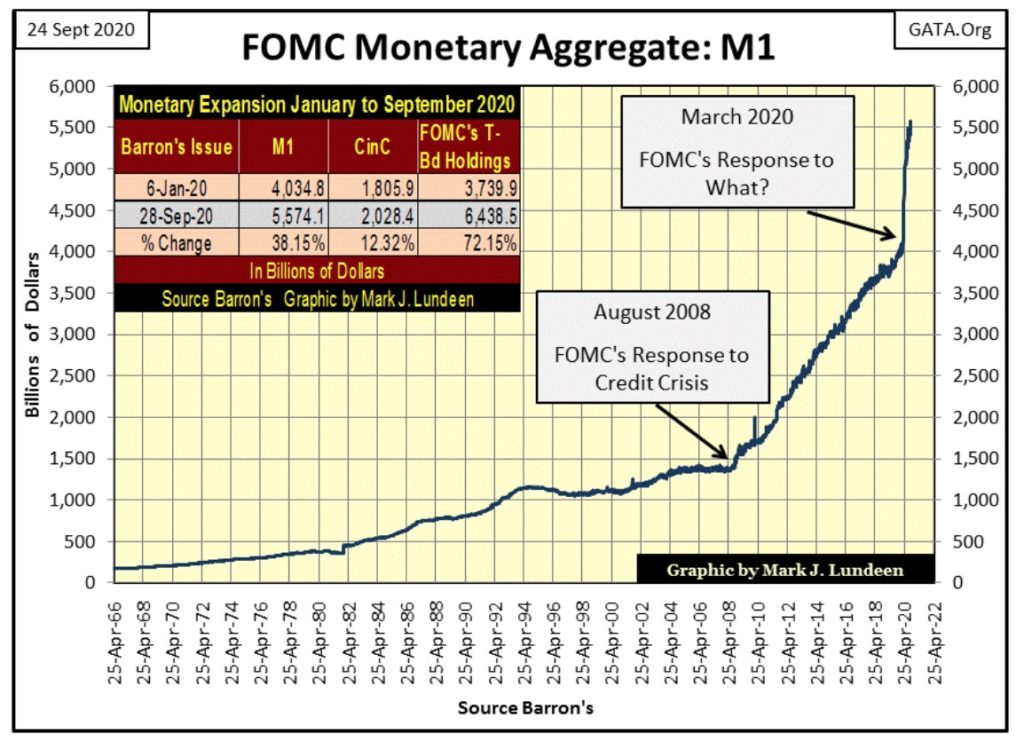
So what’s going on here? I know my faithful readers know I’m now going to blame all this on the idiot savants crafting “monetary policy” at the FOMC. But looking at their “monetary policy” going back to 1966 in the chart of their M1 monetary aggregate below, I think I’m justified in claiming I see the idiots’ finger prints on our markets since 2008.
Note on M1 Data: Beginning next week the Federal Reserve will publish M1 data only on a monthly basis. That’s twelve data points a year instead of its current fifty-two. As a data hound; I smell a rat.
In the past I’ve stated I believed the 2007-09 54% market crash was aborted by FOMC. On a dividend yield basis, the Dow Jones should have declined by at least 70%. The steepening slope of M1 beginning in August 2008, two months before the October 2008 market panic, supports this position of mine. And now the slope of M1 has gone vertical since March 2020; why?
Little commented on by contemporary market watchers, but in early 2020 the corporate bond market was full flight into a selling panic, as seen in the yield spikes in Barron’s Best and Intermediate grade corporate bonds below.
Both these bond series are considered “investment grade” by bond rating agencies. Yet in just two weeks in March, Barron’s Best Grade Bond Yields (Blue Plot) doubled from 1.88% to 4.01%, with Barron’s Intermediate Bond Yields seeing a similar spike.
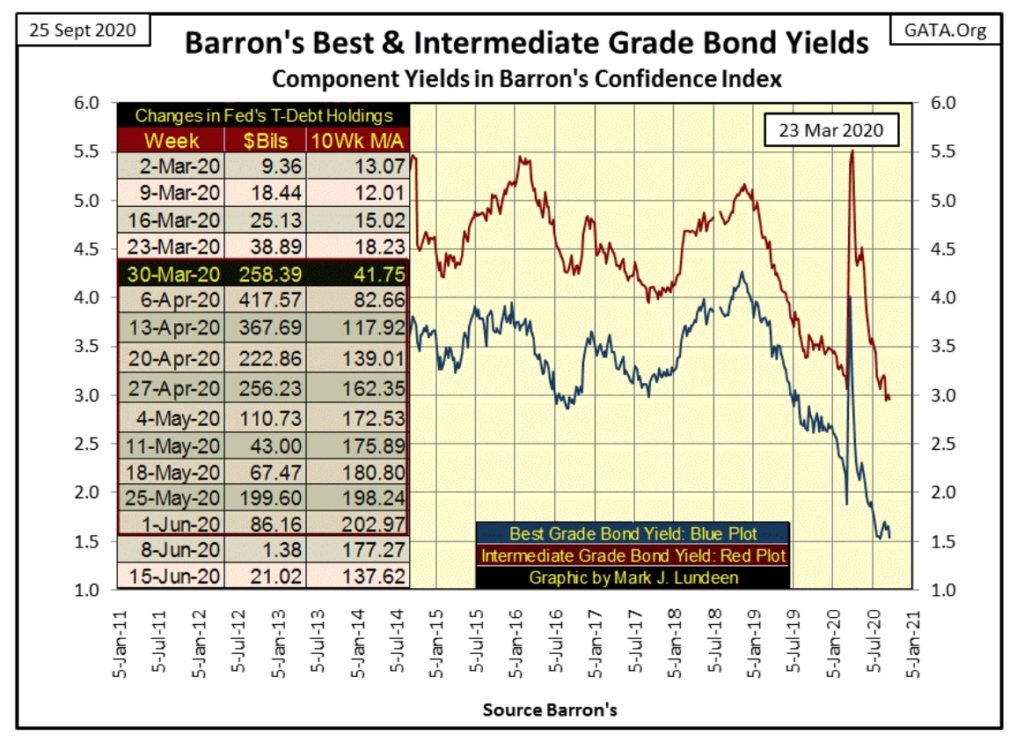
On March 23rd of this year, as corporate bond yields peaked, for the first time ever the FOMC announced that it was going to purchase corporate bonds.

On 23 March 2020, the Federal Reserve announced that it would buy investment grade corporate bonds, and on 9 April set the amount at up to $250 billion and extended the purchase to junk bonds. This column shows that these interventions succeeded in stabilizing credit markets: prices lifted and dealing spreads narrowed. However, emergency lending powers provide an inadequate basis for Federal Reserve operations in corporate bonds. In light of these findings, congressional authority to buy and to sell corporate bonds alongside US Treasuries would help to align Federal Reserve operations with what has become a capital-market centred financial system.
https://voxeu.org/article/federal-reserve-needs-power-buy-corporate-bonds
Had the FOMC not intervened in the financial markets last March as reported in the link above, the Dow Jones would have continued deflating far below its BEV -37% level seen in its BEV chart above as summer approached with corporate bond yields increasing to alarming levels.
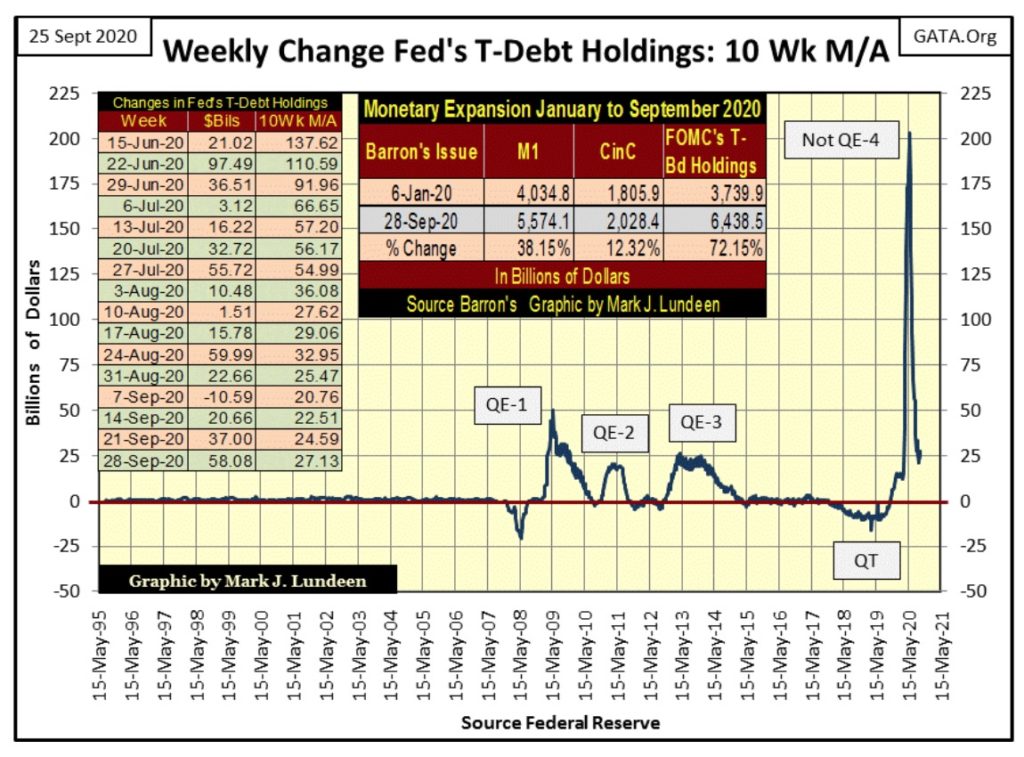
This didn’t happen, but only because the FOMC flooded the financial system with “liquidity”, as seen in the table in my chart of M1 above. Since Barron’s first issue for 2020, in just the past nine months:
- M1 has increased by 38.15%
- CinC has increased by 12.32%
- The Federal Reserve’s holdings of US T-debt has increased by a whopping 72.15%
So, exactly as the FOMC purchased sub-prime mortgages in 2008-09, at prices everyone else refused to pay, in 2020 these idiot savants began purchasing corporate bonds at prices everyone else refuses to pay, using pure monetary inflation to finance their purchases.
If you wanted to know the actual financial condition of the S&P 500 companies, and in the thirty Dow Jones companies, the best guess I have is that in all too many cases they stink. In other words; well-known companies whose products and services familiar to all are having difficulties servicing their debts without the assistance of “policy makers” supporting their bond valuations.
With the FOMC “supporting market valuations” as they have for well over a decade, the bulls running wild and free on Wall Street remain fat, dumb and happy. I know not when, but one day in the not too distant future will be Mr Bear’s, and in it you’ll be happy to own gold and silver bullion, and shares in the precious metals miners.
Oh, and what about whether the Dow Jones will see a plus 10% correction in the weeks and months to come? With the world as it now is, don’t ask me as I haven’t a clue whether it will, or even if the Dow Jones is going on to new all-time highs from here, which it could. The only thing I can say for sure is I want no exposure to the financial markets as 2021 approaches as I see monumental risks and pathetic rewards for retail investors betting on Wall Street.
Next are the BEV values for the major market indexes I follow. There were some new all-time highs (BEV Zeros) on September 2nd, but none since. And some of these former high flyers, such as the NASDAQ Composite (#11) and 100 (#12) deflated by double digit percentages this week. The Dow Jones (#7) closed the week with a BEV value of -8.05%. It’s encouraging seeing the spread between the XAU (gold and silver mining) and the NASDAQ Banks (#19&20) widening.
I remain very positive on the XAU as well as gold and silver bullion. I wouldn’t be surprised seeing the XAU at the #1 position in the table below before 2021 arrives.
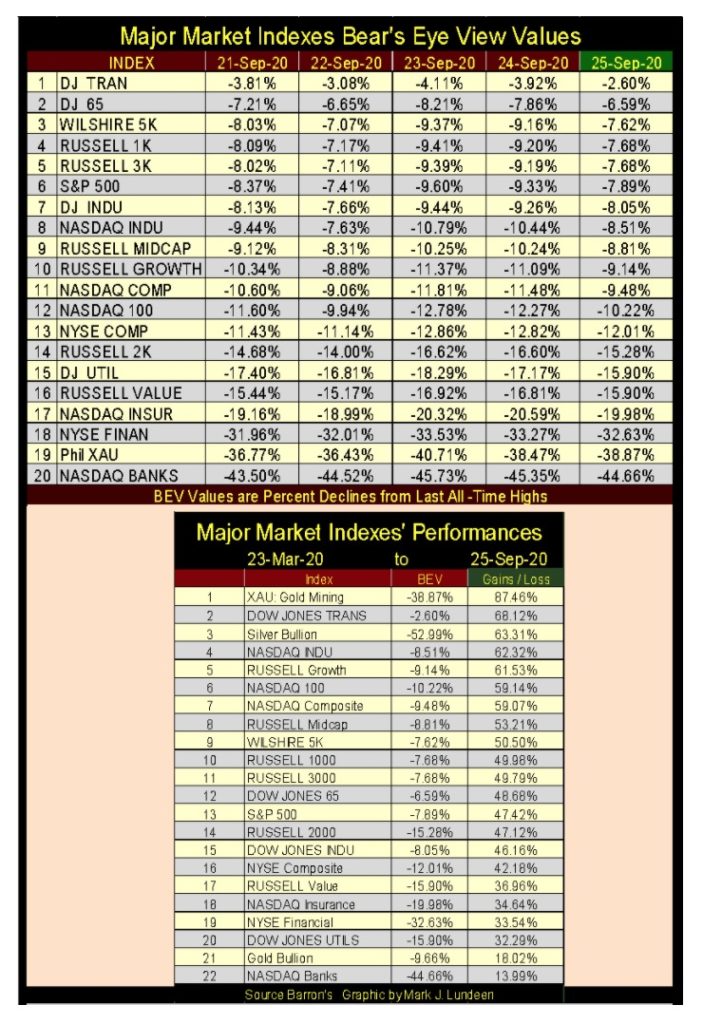
In the market indexes performance table above, the XAU remains in 1st place. What’s with the Dow Jones Transports at #2? Must be UPS cleaning up delivering all the stuff people are buying from Amazon.
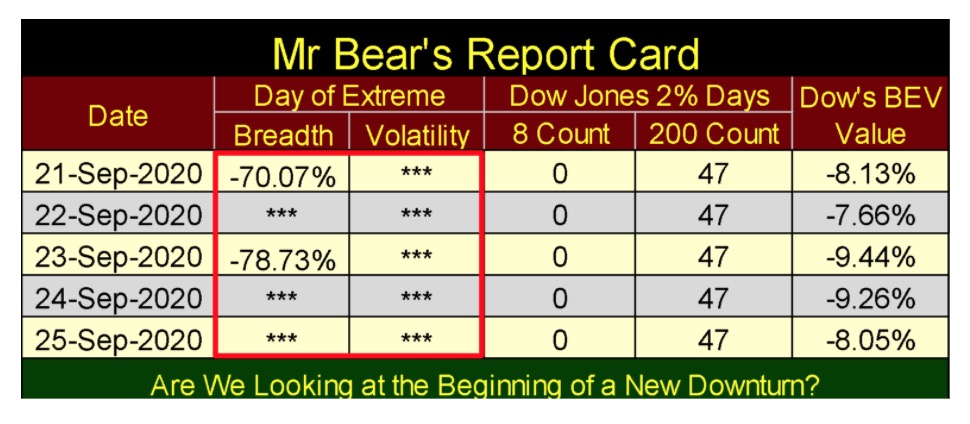
This week saw two extreme market events; two negative NYSE 70% A-D days or days of extreme market breadth, as seen in Mr Bear’s report card below. I’m not going to make much about this except to say the stock market felt the hot breadth of Mr Bear on the back of its neck on Monday and again on Wednesday this week.
What’s odd is the Dow Jones didn’t see a 2% day on Monday or Wednesday as is usually the case. We’ll know when Mr Bear is once again active when once again we see an increase in these extreme days in the market. A rising 8 count is NEVER a positive for the stock market. Currently the Dow Jones’ 200 count contains 47 very stale Dow Jones 2% days from last winter / spring’s 37% market decline, and doesn’t indicate much of anything in our current market. And as noted before, the Dow Jones BEV value has yet to descend to double digits.
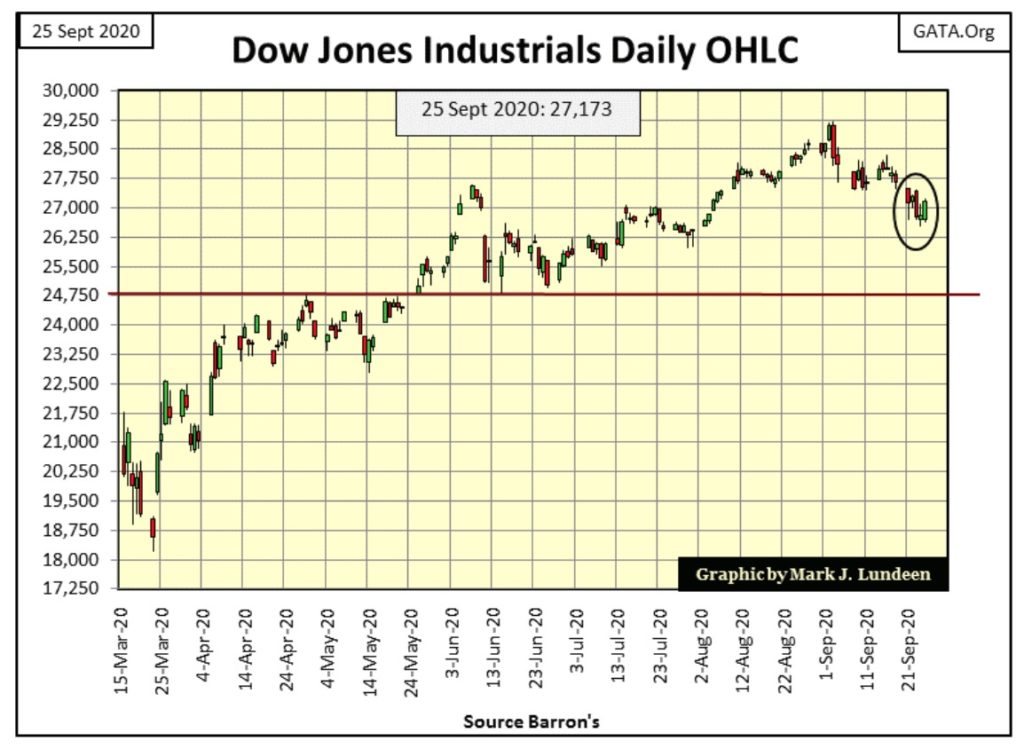
Here’s the Dow Jones in daily bars. The Dow Jones could turn around and advance in the weeks to come, but right now the venerable Dow is looking a bit weak. Stating the obvious, if the Dow Jones is to advance from here, it’s has to stop going down as it has for the past three weeks.
But one way or the other, whether the Dow Jones continues deflating or begins to advance into market history is purely a spectator sport for this guy. I just enjoy looking at the FOMC and Mr Bear duke it out on Wall Street in the chart below. But if I were to make a market bet at my local bucket shop, I’d bet a nickel on the FOMC that the Dow Jones is still good for a new round of all-time highs sometime in late 2020.
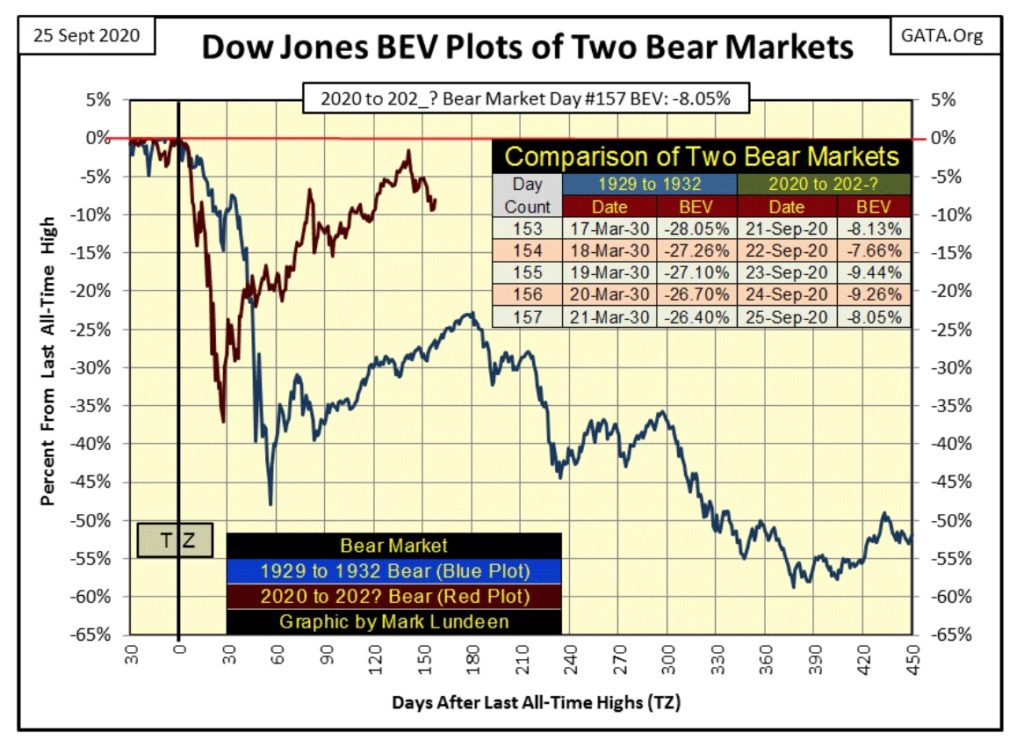
Next is my comparison between the Great Depression crash and our market decline. I began publishing this chart last April or so to see whether the advance of last spring and summer was an advance to new all-time highs for the Dow Jones or a dead-cat bounce; aka a sucker’s rally as was the case for the 1929 to 1932 89% market crash.
Well, as September rolls into October, beginning to believe the bounce by the Dow Jones off its lows of last March is in fact a sucker’s rally is looking more likely. Of course all the Dow Jones has to do to stop me from pointing out the similarity between these two bear markets is for it to go on to new all-time highs.
But we live in a world drowning in unserviceable debt. That includes companies trading in the stock market, as seen in last March’s spikes in yields for corporate bonds. That the current market decline might compete with the 89% decline for the 1929-32 market crash is a real possibility considering the debt loading of American business.
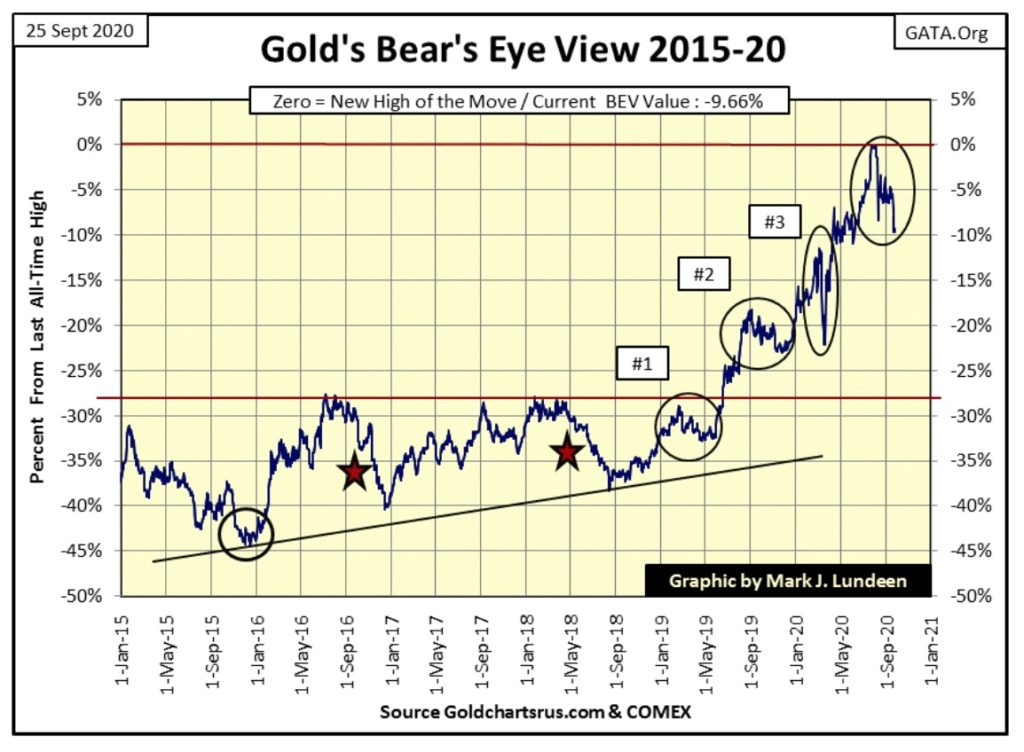
I see a lot of disappointment with the gold bulls about gold’s current correction, as was also the case for corrections #1-3 below. This is just how markets work; they go up and they go down.
At the tops of big bull markets, the points where big bear markets begin, retail investors believe they’re bullet proof, seeing only the possibility of ever more all-time highs. It’s a mistake they’ll ultimately regret.
Early in bull markets, at any market reversal investors begin focusing on the former bear market lows instead of the gains from them. So, normal bull market corrections tend to shake out weak and timid bulls before they move on again.
Markets are cruel things; they show no mercy to the gullibly bullish in bear markets or the fearful in bull markets.
Why am I so sure that the future for the stock market is one of deflating market values while the upside potential for gold, silver and the mining shares remains enormous? I’ll tell you if you promise to keep it to yourself.
I get inside information directly from the idiots savants at the FOMC; they’re planning on a Not QE-5 in the chart below the next time the stock and bond markets begin deflating that will put their last Not QE-4 to shame. My source tells me they spend hours a day practicing placing zeros after a 1 on their work stations, and the idiot that can enter $1,000,000,000,000 and hits their Enter key first wins a cookie.
Hey, this is how “monetary policy” is executed in the 21st century, and one of these days everyone will regret what these people have done with our money. That also goes for holders of precious metals assets. One day they may discover they’re richer than they thought possible, but can’t enjoy it in a world that has been reduced to grinding poverty for what we see below.
Lenin knew this.
“The way to crush the businessmen is to grind them between the millstones of taxation and inflation.”
– V.I. Lenin
As did John Maynard Keynes
“There is no subtler, no surer means of overturning the existing basis of society than to debauch the currency. The process engages all the hidden forces of economic law on the side of destruction, and does it in a manner which not one man in a million is able to diagnose.”
– Lord John Maynard Keynes
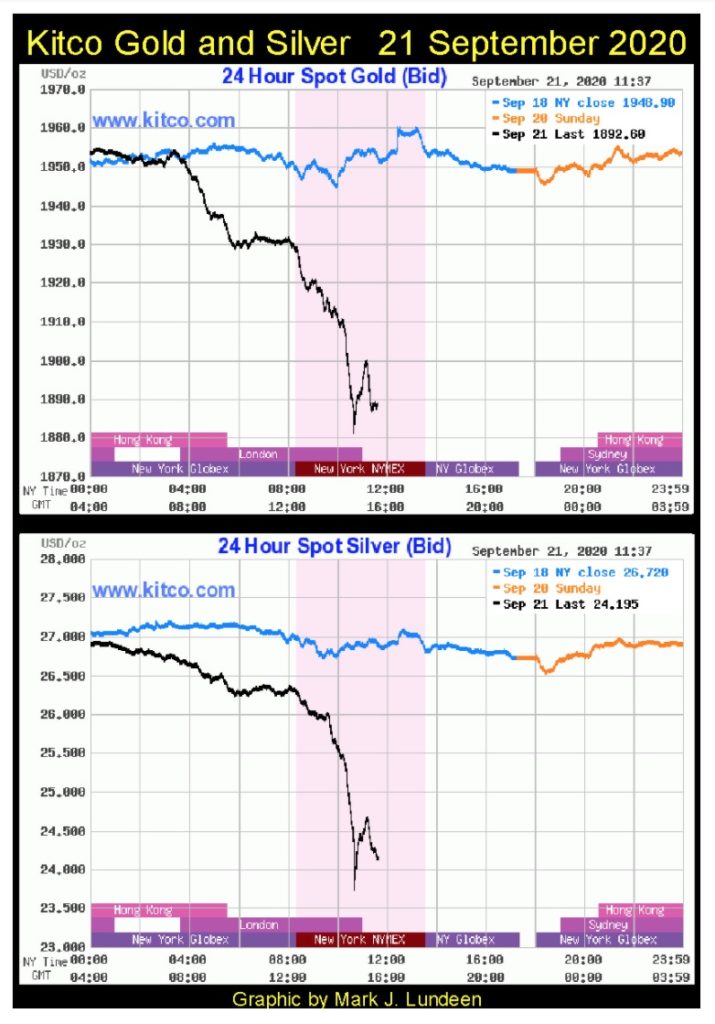
So, why did gold and silver see a selling panic last Monday in the chart below? The bad guys are still in charge of “monetary policy”, and obviously they can still cause a selling panic in the paper futures markets. But the days are numbered where they can continue doing so.
After last week, they still failed to force gold to correct 10% from its last all-time high of August. But even should they drive gold down into a 20% correction in the weeks to come, it doesn’t change anything in a world where the FOMC can “inject” $2.69 trillion dollars of “liquidity” into the financial system since the end of last year.
As September turns into October 2020, I wait for the day when both gold and silver advance more than 10% in a single day as financial asset valuations deflate and bond yields soar.
I know I’ve said this before, but this day is coming. It’s best to have your positions in gold and silver before it does.
Here’s gold and its step sum going back to 1998. Since then gold has gone up significantly.
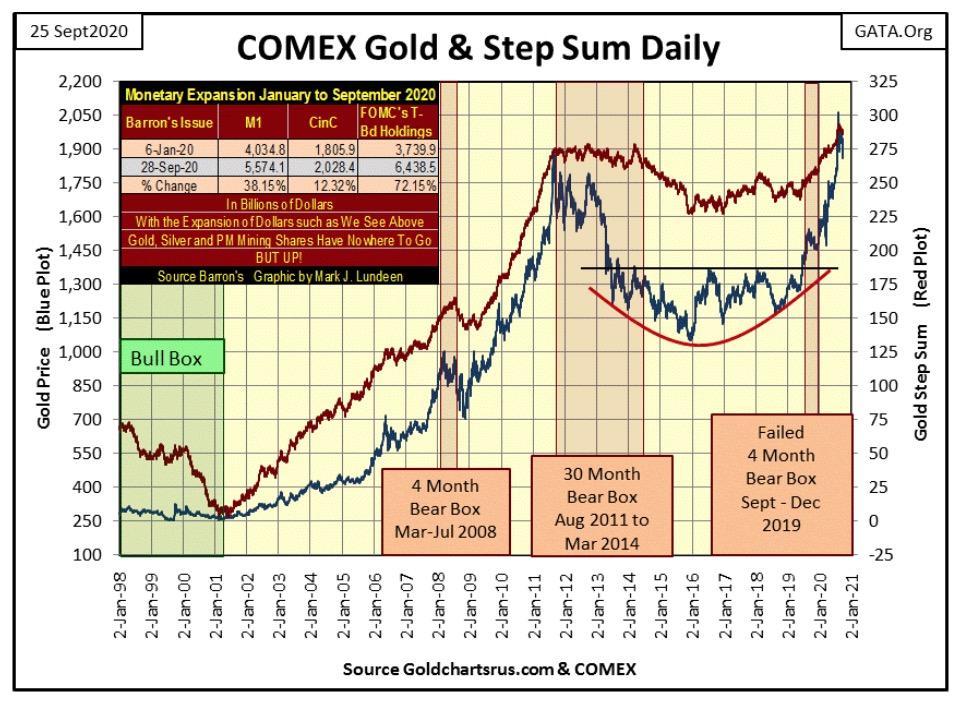
Or has it?
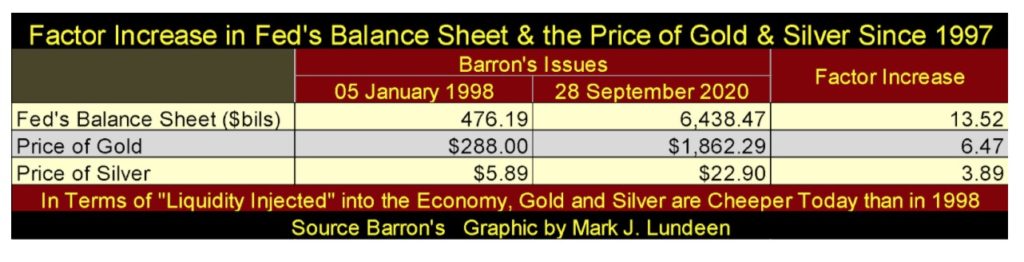
Looking at the expansion of the Federal Reserve’s balance sheet in the table below, since January 1998 it has increased by a factor of 13.52 while the price of both gold and especially silver have lagged far behind. To my way of thinking, this fact makes gold, silver and precious metals mining companies compelling bargains at today’s prices.
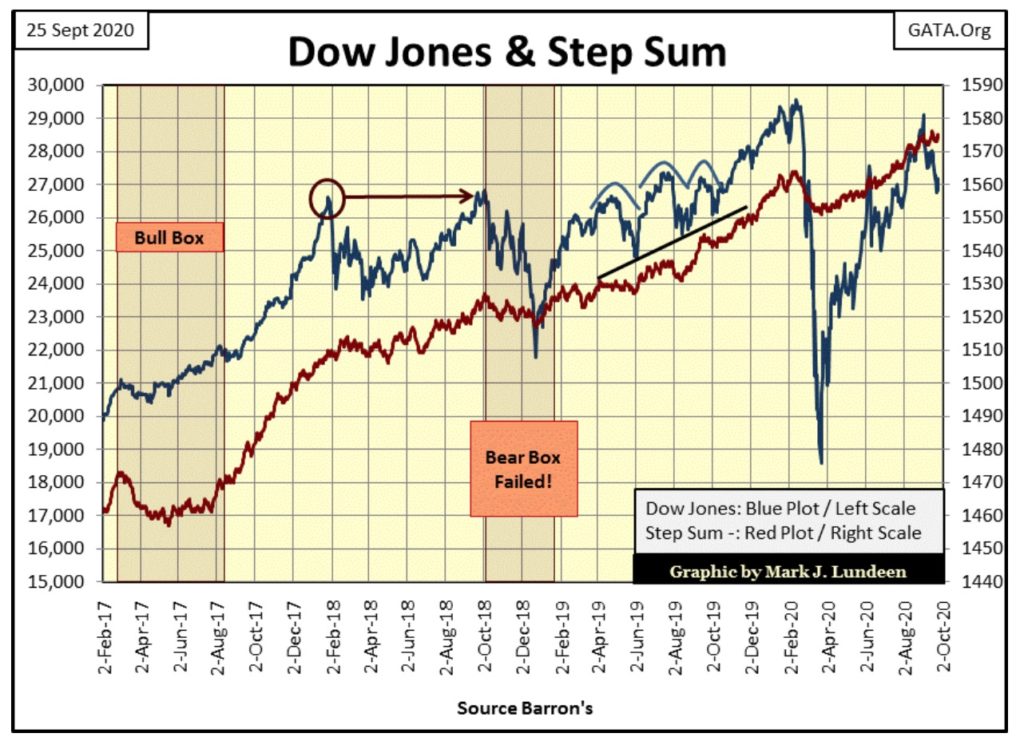
In the Dow Jones’ step sum chart below, since it’s high of its advance on September 2nd the Dow Jones price plot (Blue Plot / Market Reality) has decoupled from its step sum plot (Red Plot / Market Expectations). We have the makings of a step-sum bear box below. But I don’t take such decouplings seriously unless they continue for at least eight weeks, with twelve or sixteen weeks even better.
The best way to understand a bear box is to understand the reality of a price decline is being denied by the bulls; in this case the bulls could be the idiot savants at the FOMC.
Should a bear box develop in the coming months, the safe bet is to bet on the reality of the market decline, not the bullish expectations of the bulls. Unless this box continues to early November, it’s too early to think about that, but I’m keeping my eyes on this developing box.
Moving on to gold’s step sum table below, gold’s daily closings have been overwhelmed by down days in the past month. Its step sum is down by six net daily declines (292-286=6), and its 15 count has remained negative for a long time, though at a -5, gold’s 15 count remains neutral. Actually I’d like to see gold’s 15 count go down to a -7 or lower, which would technically make gold oversold, and thus ready for a rebound.
Still, all that red below is a bit depressing. But as noted above, this is what markets do; they go up and then they go down. Yet for all the selling seen below, the bears have failed to drive gold’s BEV value below -10%, and that may be the key observation to take away from the table.
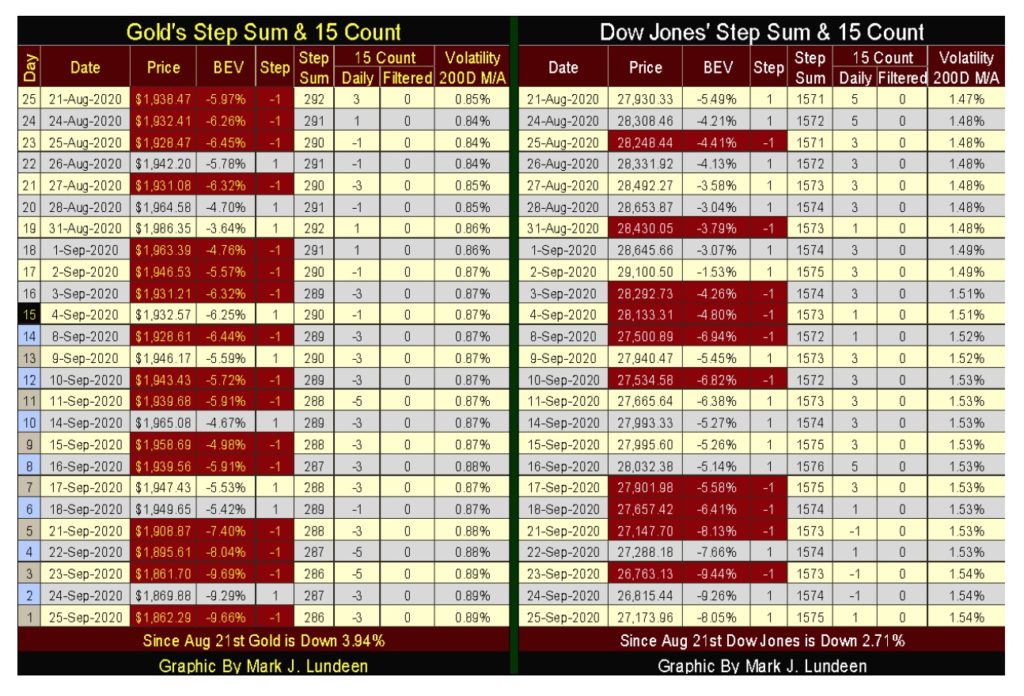
For the Dow Jones step sum table, we can see its bear box developing. Since August 21st the Dow Jones is down757 points as its step sum is up four net daily advances. Comparing gold’s with the Dow Jones table I can see why gold is down 3.94% in the past twenty-five trading sessions. I’m surprised it’s not down 10%.
But with all the daily advances the Dow Jones has seen since August 21st, why is it down 2.71% after the FOMC had “injected” $128 billion into the financial system during this time? How much longer before the idiots begin their Not QE-5?
Here’s some fake news from CNN Business on the commercial and residential real estate markets:
New York (CNN Business) The housing market is red hot thanks to record-low mortgage rates and consumers looking to flee cities for the suburbs. But offices, shopping malls and other commercial real estate properties have been hit hard by the coronavirus pandemic.
https://www.cnn.com/2020/09/22/investing/commercial-real-estate-recession/index.html
This is all true enough; as published. Commercial real estate for the past two decades has declined as brick and mortar retail has lost business to internet merchants. Once one had to live in New York or Chicago to have access to merchandise originating from distance corners of the globe, a distinct disadvantage to anyone living in North Dakota or Wyoming. But the internet changed all that.
As an example here’s a link for Japanese knifes offering both manufactured and hand forged kitchen implements. The selection offered for types of knifes and steel used in them is amazing, with prices ranging from $100 to over $2000!
Look at the recommendations for the knife seen in the link below; people from around the world shop here for knifes made by old samurai-sword smiths. Even Macy or Marshall Fields from years ago couldn’t compete with this internet site when it comes to kitchen knives, or other consumer goods on other sites, and they have suffered for it.
Office space is a big CCP virus loser as many businesses have discovered how easy it is to have their “office workers” just stay at home and work on-line. This new arrangement saves them the expense of renting office space, so these companies aren’t planning to lease office space anytime soon.
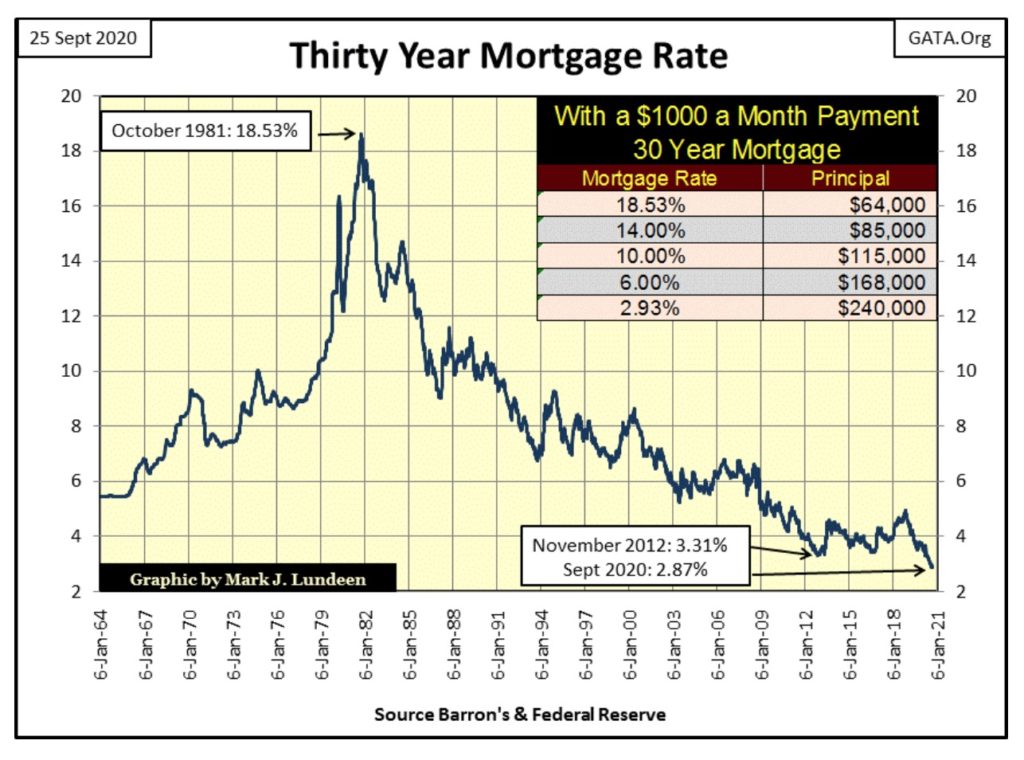
The boom in single family homes is a monetary phenomenon. As seen in the chart below mortgage rates have been dropping since October 1981 when they peaked at 18.53%. In October 1981, with a rate of 18.53%, a $1000 monthly payment could afford a mortgage of only $64,000. A few weeks ago mortgage rates declined to 2.96%, where a $1000 monthly payment could afford a mortgage of $240,000.
Truth be told, the collateral for both mortgages could be the same house. Forty years later this house now needs updated plumbing, a new roof and windows, but your real estate agent knows a real bargain when they see one.
What makes this CNN Business article so fake isn’t what it’s reporting, which is true enough as it goes, but in the obvious omissions not covered in telling this story. In time the CCP Virus pandemic will be proven to be no more a health hazard that is the flu. And the harm inflicted on retail merchants by the Covid-19 virus was completely unnecessary.
The “consumers looking to flee cities for the suburbs” are fleeing from riot zones. Management of these cities’ reaction to these riots has been to defund their police departments and quickly release any rioters apprehended by the police, allowing rioters to resume looting and burning their city. They also have actively prosecuted any business or homeowner who attempted to protect their property and livelihood with firearms.
The obvious question not asked in this CNN Fake News article was “who wants to pay property taxes to municipal governments like these?”
—
(Featured image by Tumisu via Pixabay)
DISCLAIMER: This article was written by a third party contributor and does not reflect the opinion of Born2Invest, its management, staff or its associates. Please review our disclaimer for more information.
This article may include forward-looking statements. These forward-looking statements generally are identified by the words “believe,” “project,” “estimate,” “become,” “plan,” “will,” and similar expressions. These forward-looking statements involve known and unknown risks as well as uncertainties, including those discussed in the following cautionary statements and elsewhere in this article and on this site. Although the Company may believe that its expectations are based on reasonable assumptions, the actual results that the Company may achieve may differ materially from any forward-looking statements, which reflect the opinions of the management of the Company only as of the date hereof. Additionally, please make sure to read these important disclosures.


XRP Under Pressure Amid Macro Forces, Fed Policy, and Regulatory Shifts
XRP remains under pressure despite easing geopolitical tensions, as macroeconomic factors and Fed policy dominate market sentiment. Liquidations and high...


Edison Accelerates Renewable Growth and ESG Impact in 2025
Edison reports strong 2025 sustainability progress, boosting renewable investments by 90% to reach 2.3 GW toward a 4 GW 2030...


New Gene Therapies Transform Rare Disease Care, but Gaps Remain
Gene therapies are transforming rare disease treatment, enabling normal lives for some patients. However, only about 6% of 7,000 rare...


Temotiva Launches Crowdfunding Campaign to Advance Preventive Mental Health
Temotiva Innovación Lab has launched a crowdfunding campaign through Santander X Explorer, marking a new phase for the University of...


Fed Policy Shift Raises Concerns Over Debt and Inflation Risks
The Federal Reserve is criticized for resuming balance sheet expansion through Treasury purchases despite expectations of tighter policy under new...
 |
|
 |  |
 |
|
-

 Business1 week ago
SpaceX IPO Sparks Déjà Vu as Market Risks Loom and Gold Bulls Stay Hopeful
-

 Business2 weeks ago
Dow Jones Rally Faces Uncertainty Amid NASDAQ Reversal
-

 Crowdfunding5 days ago
Wyrmgold Launches Crowdfunding Campaign for Believe in me! (please)
-

 Biotech2 weeks ago
The German Biotech Industry Faces Funding Crunch Despite Market Stability