Business
Why Gold and the XAU Are Outperforming the Dow Jones
The Dow Jones has surged from 35,000 to over 46,000 since November 2023, marking a 31.4% gain with repeated BEV Zeros and no reversal signs. Meanwhile, gold and silver miners (XAU) are rebounding strongly from deep bear market lows. Despite minimal Wall Street support, their advance looks bullish, echoing the Dow’s 1980s beginnings.

In the past month, the Dow Jones made four BEV Zeros (0.0% = new all-time highs) in its BEV chart below, with two of them this week. This week’s BEV Zeros were the 58th and 59th since the Dow Jones entered into scoring position (began trading within the Red Rectangle), in November 2023. In a Bear’s Eye View chart, where dollar advances and declines are converted into percentage declines from new all-time highs, this is what a twenty-two-month, bull market advance looks like.
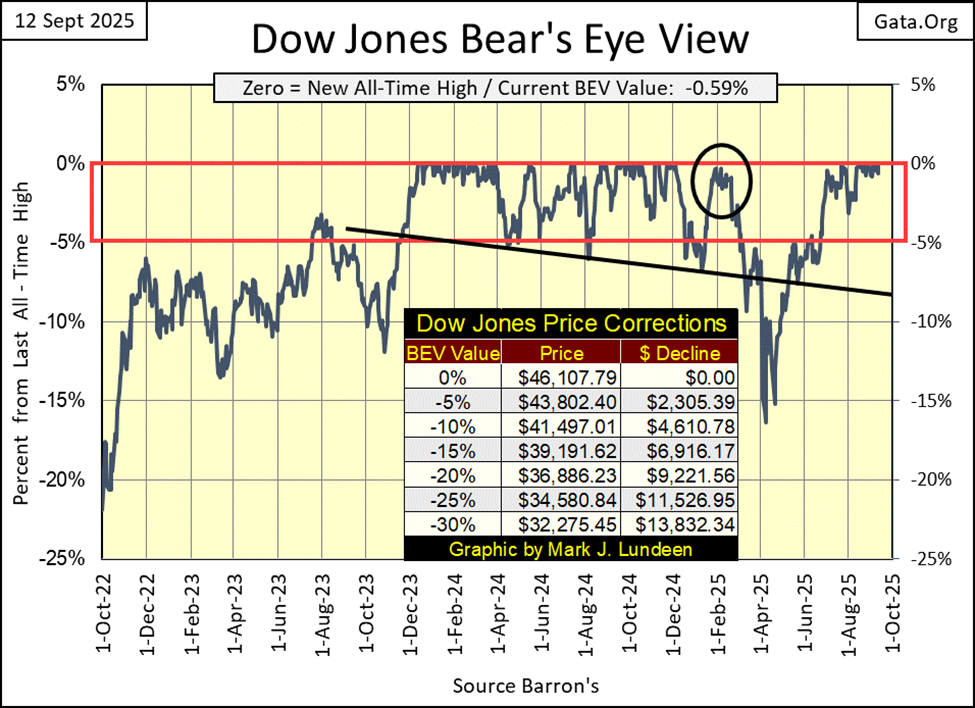
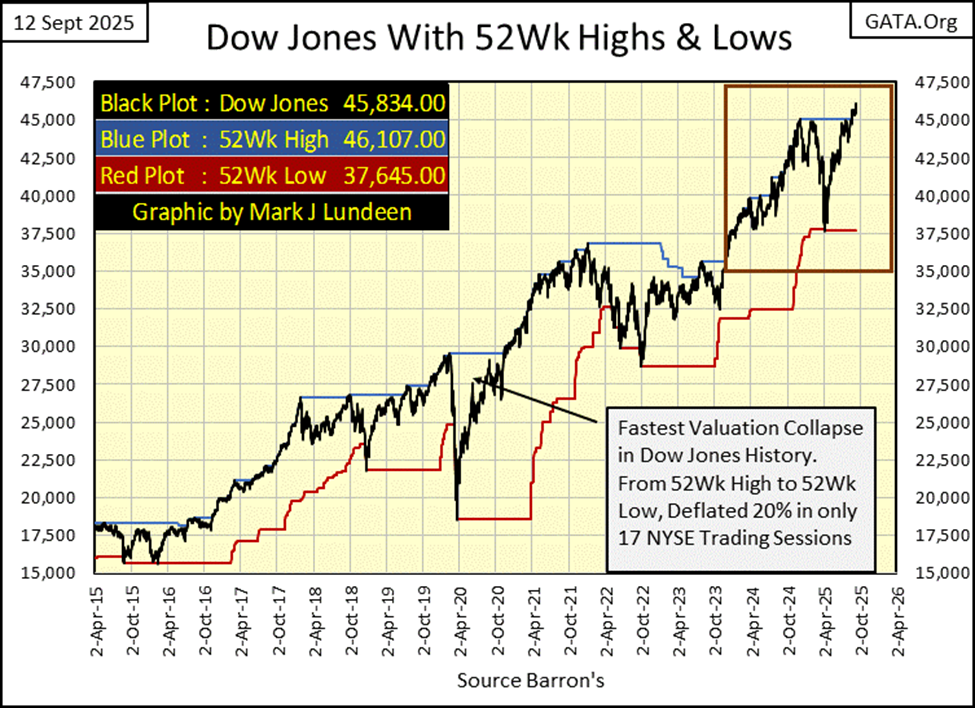
Looking at the Dow Jones advance since November 2023 in dollars below (Red Square), just eyeballing it, the Dow Jones has advanced from 35,000 to over 46,000 these past twenty-two months. That is a percentage advance of 31.4%, with no indication of the market turning around any time soon. Some day it will, taking the Dow Jones down to levels not currently knowable, but right now, it’s advancing.
Another index doing good are the gold and silver miners in the XAU, charted in BEV format and in dollars below. What is odd about this, is the XAU and the Dow Jones typically are counter-cyclical to each other. Yet, as seen above and below, the gold miners and the Dow Jones have been rising together for quite some time. This co-existent advance won’t continue forever.
So, who is going to continue advancing, as the other is fated to enter a bear market? The Dow Jones has been advancing since August 1982, when it last closed below 800. This week it closed above 46,000, a forty-three-year advance by a factor of 57.5. Or, a $1.00 of Dow Jones in August 1982, is now equal to $57.50.
How much more can anyone reasonably expect from this geriatric bull market?
Now let’s consider the XAU below. In its BEV chart, it’s coming off the bottom of an 85% bear market decline from ten years ago, and a 60% bear market bottom in late 2022.
These horrific bottoms eliminated any lingering bull-market sentiment since its last all-time highs of April 2011, fourteen years ago. And now the XAU is rising, with no support from Wall Street; brokers aren’t currently urging their clients to buy the miners of precious metals. Nope, currently they are urging their clients to buy AI stocks, as they totally ignore the miners of precious metals.
Still, looking at the XAU below, someone is buying the miners, and very much are willing to pay higher prices as this advance continues.
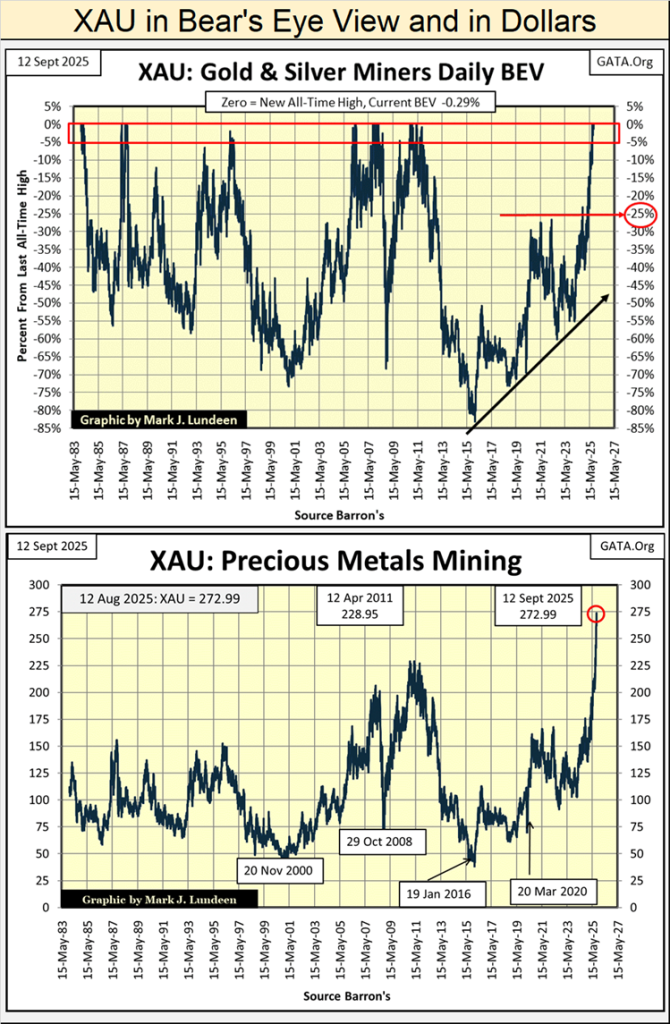
Above is the XAU plotted in the dollars it is published in. To see an index advance like this, with very little public support is not only unusual, but very bullish. I’m no “market expert,” just a market enthusiast who has done his homework on the market. And the situation as I see for the XAU above, reminds me very much how the Dow Jones looked like in the early 1980s, a time I remember very well.
Below is the genesis of the current bull market for the Dow Jones, where in August 1982 it last closed below 800, on its way to over 46,000 forty-three years later. Though, in January 1984, two years into the bull market, most people in the stock market (and there wasn’t many of them in the market back then), were worried the Dow Jones would collapsing back below 1,000. As it did five time before, from 1966 to 1982.
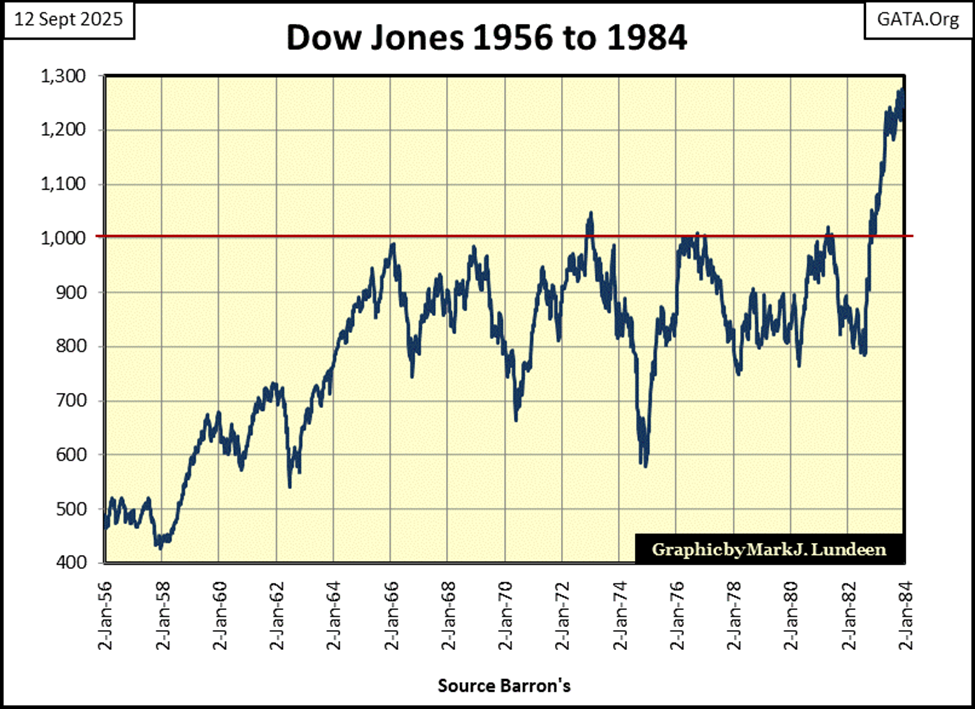
Well, in 1984 the Dow Jones didn’t collapse back below 1000. Instead, it continued rising to valuations no one in 1984 would have / could have considered possible.
That is how I consider the XAU now in 2025. There will be pullbacks in the years ahead for the XAU, there always are during any bull market advance. However, as this market enthusiast sees the gold and silver miners; they have a long way to go from here, both in terms of dollars and time.
Let me share with my readers a sea-story, a tall tale of Wall Street from the decks of a US naval ship. In the summer of 1982, I was the Leading Petty Officer (LPO / IC2, or E5) for the Interior Communications Shop on the USS Schenectady LST-1185. The ship’s TV system was located in my shop. When we were in port, most nights I’d watch PBS’s Nightly Business Report with an Electrician’s Mate 2nd Class Petty Officer (EM2). We’d talk about the stock market all the time, talking ourselves into going out to buy some stocks.
Well, one day we took the plunge, and we submitted request chits to our chain-of-command to take a day off to “buy some stocks.” I liked Genentech, Pete like Genentech too, but also Citibank. Barron’s just had an article about Exxon, which at the time had what I recall a 15% dividend, can you believe that? So, we were both going to buy some Exxon.
Yeah, in August 1982 the stock market was CHEAP. The Dow Jones itself was yielding a dividend of 7%, and only a few wanted what the market had to offer!
We walked through our chits threw the chain-of-command for “buying some stocks.” We said that as in the military, if you want a day off, you have to tell them why, and what we wanted was a day off to “buy some stocks.”
Our day off was approved. But everyone in our chain-of-command, from our Chief, to the ship’s Executive Officer couldn’t help but laugh at two enlisted electricians taking a day off to “buy some stocks.” What a hoot! At the end of the day, Pete and me may have been the only enlisted men at San Diego’s 32nd Street Naval Station, to have owned shares trading on Wall Street.
I guarantee you, “buying some stocks” was something my chain-of-command wouldn’t have done in August 1982, as that was something just not done at the start of a historic bull market.
That was a long time ago, and now everyone is in the stock market, and still buying. Look at all the BEV Zeros seen in my table for the major market indexes below. The week ended with only the bottom three closing outside of scoring position, more than 5% from their last all-time high, with the NASDAQ Banking index at the bottom.
Being tail-end Charlie (#21 row below) belonged to the XAU since 2012. At the close of December 2024, the XAU (this week’s #8), had a BEV of -40.08%. Nine months later, the XAU is regularly making new all-time highs, three more just this week.
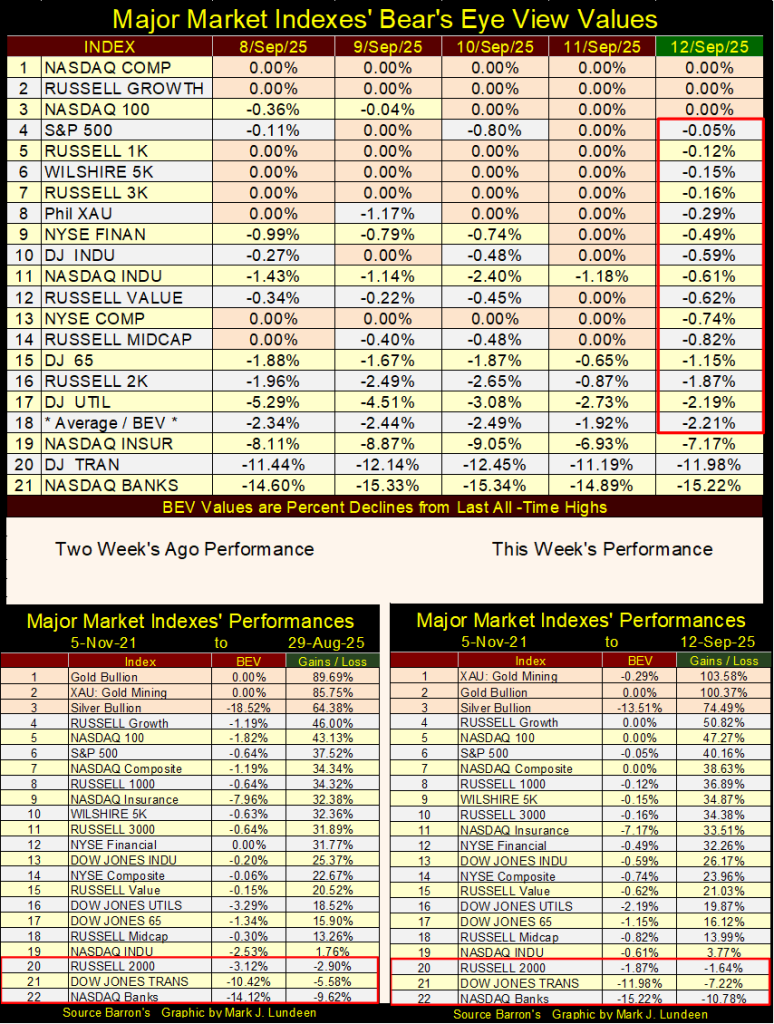
In the performance tables above, this week the XAU took the #1 spot! But gold and silver (#2&3) also enjoyed large gains since the end of August. And where are the Dow Jones and the NASDAQ Composite? Far below at #13 and #7 in the table.
Wall Street continues ignoring precious metal assets. But if these gains continue, and they should, Wall Street will be forced to begin covering the most significant bull market advance, since the bottom of the March 2020 Flash Crash.
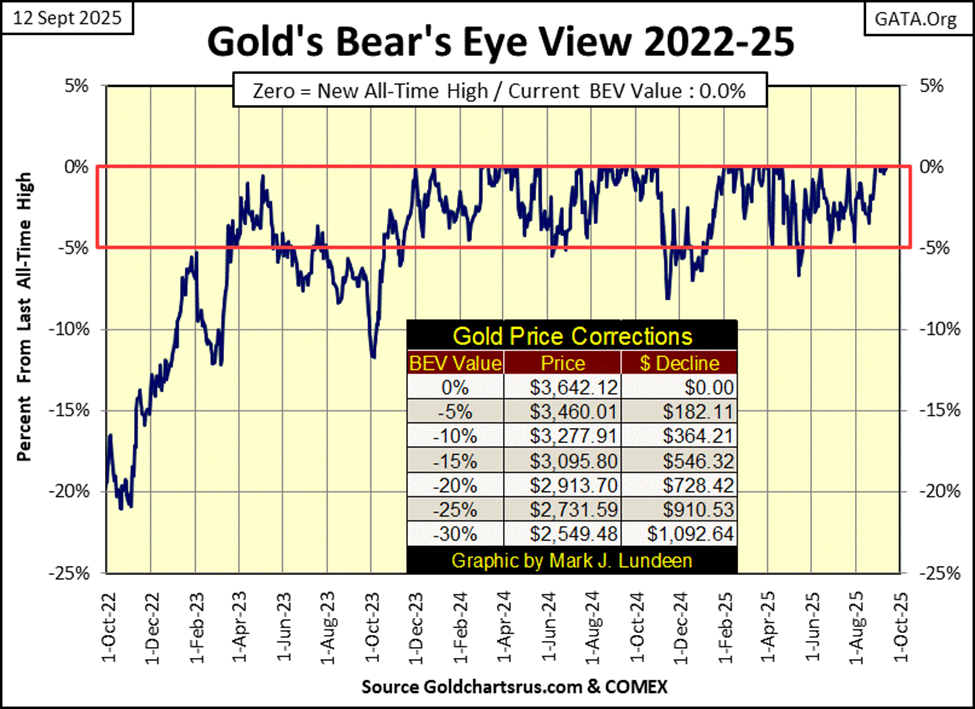
Next is gold’s BEV chart. The last time gold closed below scoring position was in May, and for the past three months it has refused to close with a BEV of something below -4.99%. Rather, gold has preferred to close at new all-time highs; #66 to #72, since entering into scoring position in November 2023. Since May, most of these new all-time highs have happened in the past two weeks, six in total, pushing gold up by $210.32 since August 28th.
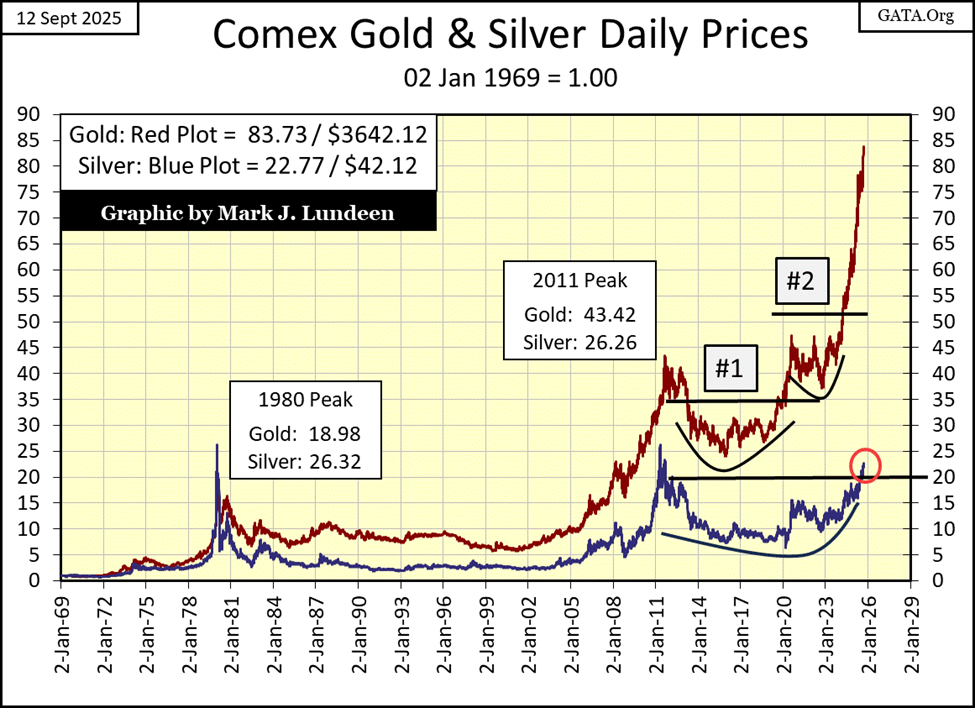
Here is the chart plotting the indexed values of gold and silver, with 02 January 1969 = 1.00. As noted above, the Dow Jones has advanced by a factor of 57.5 since August 1982. That is a serious advance. But note since 1969, gold has advanced by a factor of 83.73! I think we should note most of that advance has occurred since January 2023.
In August 1982, Exxon offer investors a dividend yield of 15%, and no one cared. In September 2025, gold is leaving the Dow Jones far behind, but who know this, or cares? You now do, but not many others. Ask around your circle of family and friends, and you’ll see what I’m talking about; they don’t care.
Well, this is how bull markets are; no one knows or cares, until all of a sudden they do. Just know the big money made in the markets, is always made by buying before a major trend comes to the attention of the investing public. Right now, that isn’t the much promoted AI stocks, but gold, silver and their miners.
The indexed value of silver (below), broke above 20 on July 10th, and hasn’t yet collapsed below it. I don’t think it will either. What I think silver will do; is one fine day it will exceed the gains seen below for gold. Gold closed the week with a factor of 83.73, up from a factor of 1.00 in January 1969.
What will the price of silver be when it too has a factor increase of 83.73? $154.90. That would be an advance in the price of silver by 368% from today’s close of $42.12. Forty-two-dollar silver? Cheap.
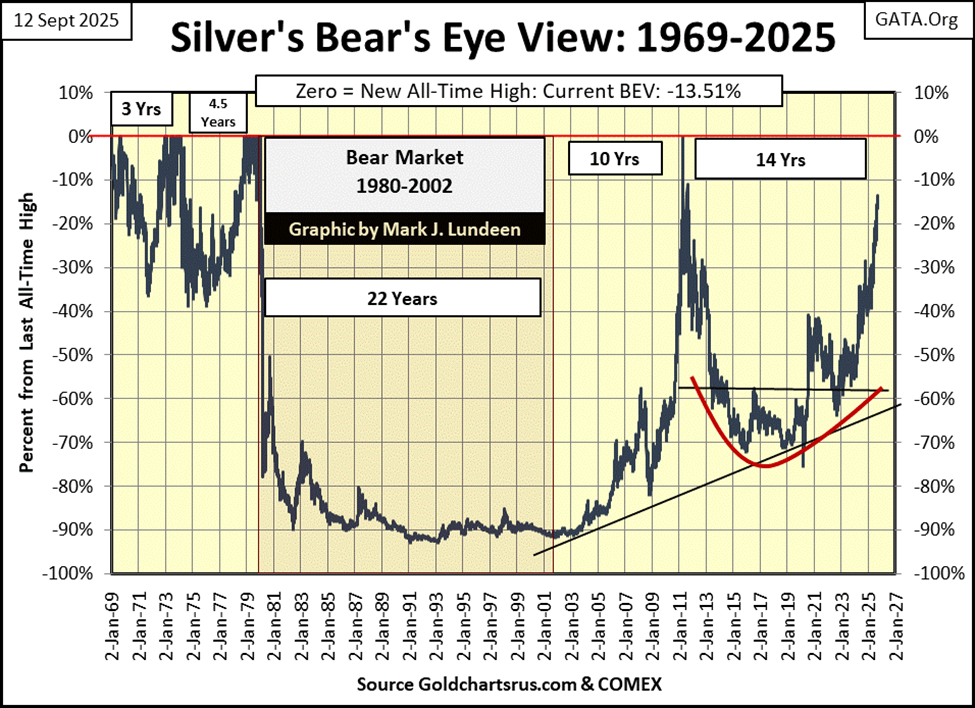
Here is my BEV chart for silver. What a history of misery the below BEV chart documents for silver since its last all-time high in January 1980. A 90% bear market decline that hammered silver’s bulls during the decade of 1990s. Then there was the failed attempt for a new all-time high in April 2011, to be followed by another crushing bear market decline, this time a 70% bear market decline.
Since January 1980, investing in silver was only an investment in misery and financial loss, and everybody knows it. Anyone with half a brain got out of silver long ago, and they aren’t coming back in anytime soon!
Okay, I have less than half of my brain, because I love silver for all the above negative reasons cited above that drove so many people out of the silver market, nicely displayed in silver’s BEV chart above.
This is what a bottom looks, and feels like, and * I LOVE BOTTOMS. * Bottoms are always emotionally uncomfortable. Placing a significant investment at a market bottom, though the right thing to do, is also an excellent way of losing sleep at night. One doesn’t boast when investing at market bottoms, as everyone around you knows only fools do such things. But what everybody knows about a market, is usually useless information.
Here is some useful information, something few people are aware of; silver closed the week with a BEV of -13.52%. Silver is no longer 70%, or 90% below its last all-time high from January 1980, but only 13.52% away from making a new all-time high, and rising. Let’s see what the “market experts” say when silver breaks above $50 an ounce (less than $8.00 from this week’s close), and then keeps on rising.
Moving to my step sum tables below, the intensity of gold’s advance, compared to the Dow Jones is on full display, when looking at the volume of BEV Zeros they have generated since August 8th. For gold, these past two weeks have seen more daily closes at a new all-time high (BEV Zeros highlighted in blue), than not. The Dow Jones is also making new all-time highs, but its advance is not as energetic as is gold’s.
For one thing, gold is now in a period of time when it is seeing more daily advances than daily declines, and has been since August 25th. I like that. But truth be told, with gold’s 15-count closing the week with a +7, indicates gold is currently an overbought market, and markets don’t like being overbought. So, it would be a healthy development should gold see an increase in daily declines for the next few weeks, to push down its 15-count down from a +7.
That is what I think. However, truth be told again, the market doesn’t care what I think. So, maybe we’ll continue seeing daily advances overwhelm daily declines in the gold market, as its 15-count rises up to a very overbought +9, to maybe even a whoppingly overbought 15-count of +11, or possibly gold bull-market insanity itself; a 15-count of +13!
That may happen, but with the Dow Jones doing so well, I doubt this is very likely.
Why would that be?
Because inflation flowing from the Federal Reserve System doesn’t inflate the valuations of gold, silver and the XAU. What inflation flowing from the Federal Reserve System inflates is; valuations in the stock and bond markets, as well as valuations in real estate.
What inflates bull-market valuations in gold and silver, is deflation in the stock and bond markets, as well as deflating real estate valuations. Wealth fears deflation, so at such times, flight capital flows from Wall Street, into the gold and silver markets.
So, enjoy the current gains in gold, silver and in their mining shares. But things are going to become crazy when Mr Bear once again begins to claw back on the massive gains the financial markets have seen since August 1982. When that happens, valuation for precious metal assets will go Absolutely Ape.
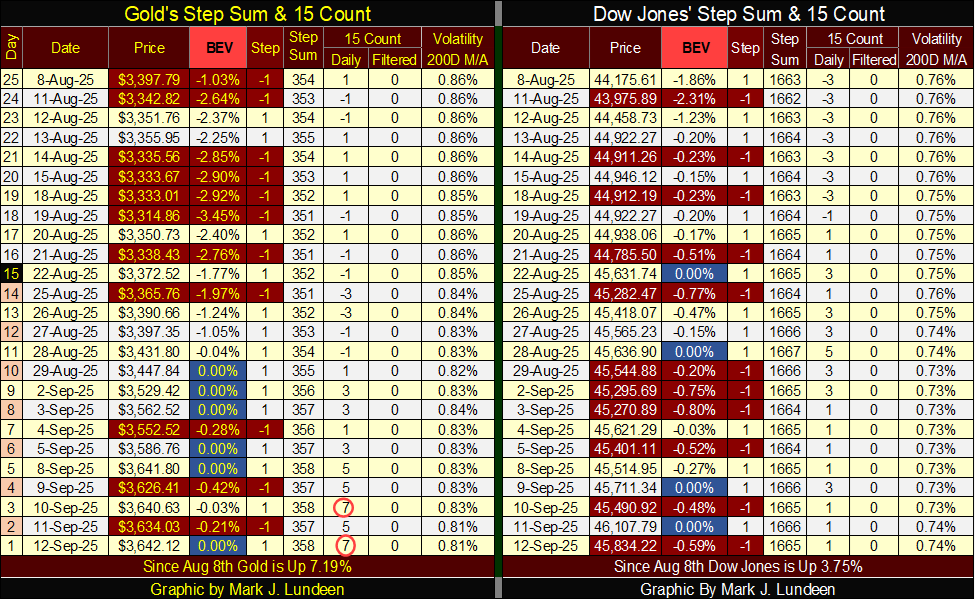
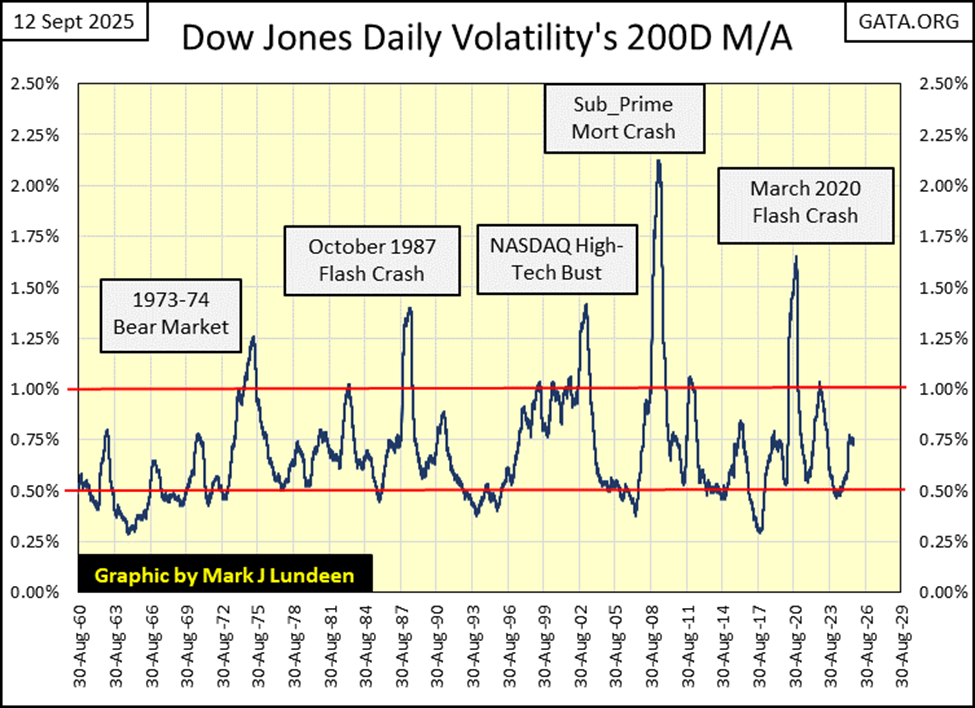
On the Dow Jones side of the step sum table above, it too is making new all-time highs. Unlike gold, the Dow Jones’ 15-count is a nicely neutral +1. Another huge positive for the Dow Jones, is its daily volatility’s 200D M/A closed the week with a reasonable 0.74%. I’m expecting good things from the Dow Jones for as long as this critical metric (daily volatility) remains below 1.00%.
Historically, bad things for the stock market ALWAYS happen when this indicator rises up above 1.00%, as seen in the chart below.
I like this chart, as it provides excellent information on when to buy, and when to sell the stock market. Bull markets occur when daily volatility for the Dow Jones began to decline from these peaks, which occur at bear market bottoms. Bear markets occur when daily volatility for the Dow Jones begin to rise from their bull market lows, below the 0.50% line.
That the Dow Jones continues rising as its volatility increases, does not disprove this system of market timing. When in fact, the real money made in the current advance was from the March 2020 Flash Crash volatility peak, until daily volatility for the Dow Jones broke below its 0.50% line. Any profits made since then, are only crumbs left to the bulls by Mr Bear. Nice crumbs, but crumbs nonetheless.
__
(Featured image by Dimitry Karastelev via Unsplash)
DISCLAIMER: This article was written by a third party contributor and does not reflect the opinion of Born2Invest, its management, staff or its associates. Please review our disclaimer for more information.
This article may include forward-looking statements. These forward-looking statements generally are identified by the words “believe,” “project,” “estimate,” “become,” “plan,” “will,” and similar expressions, including with regards to potential earnings in the Empire Flippers affiliate program. These forward-looking statements involve known and unknown risks as well as uncertainties, including those discussed in the following cautionary statements and elsewhere in this article and on this site. Although the Company may believe that its expectations are based on reasonable assumptions, the actual results that the Company may achieve may differ materially from any forward-looking statements, which reflect the opinions of the management of the Company only as of the date hereof. Additionally, please make sure to read these important disclosures.


The TopRanked.io Weekly Digest: What’s Hot in Affiliate Marketing [LiveChat Affiliates Review]
Quick Disclosure: We’re about to tell you how LiveChat Affiliates run a top-notch affiliate program. And we really mean it....


German SMEs Face Tighter Bank Lending, Turn to Alternatives
Access to bank loans for German SMEs is tightening despite strong financing needs. About 37.8 percent face restrictive lending, driven...


Bitcoin Stalls as Geopolitical Risks and Crypto Industry Tensions Persist
Bitcoin is moving sideways near $72,000 amid ongoing Iran tensions, while ETF inflows remain strong. Quantum security debates continue. Ethereum...


Geopolitical Tensions and Trade Disruptions Reshape Global Commodities Markets
Geopolitical tensions and disrupted trade routes, especially around the Strait of Hormuz, are reshaping global commodities markets. Agriculture faces supply...


Germany Sees 413 Cannabis Cultivation Clubs Two Years After Partial Legalization
Two years after partial cannabis legalization in Germany, 413 cultivation clubs have been established nationwide. Lower Saxony leads in clubs...
 |
|
 |  |
 |
|
-

 Fintech3 days ago
Toss Explores Blockchain Mainnet to Power Next-Generation Financial Services
-

 Cannabis2 weeks ago
Poland Proposes Cannabis Decriminalization: 15 Grams and One Plant Without Penalties
-
 Africa8 hours ago
Geopolitical Tensions and Trade Disruptions Reshape Global Commodities Markets
-
 Fintech1 week ago
Credibur Scales Rapidly: €2 Billion in Structured Debt Facilities in Six Months