Business
Gold’s 21st Century Rally: What Markets Are Missing
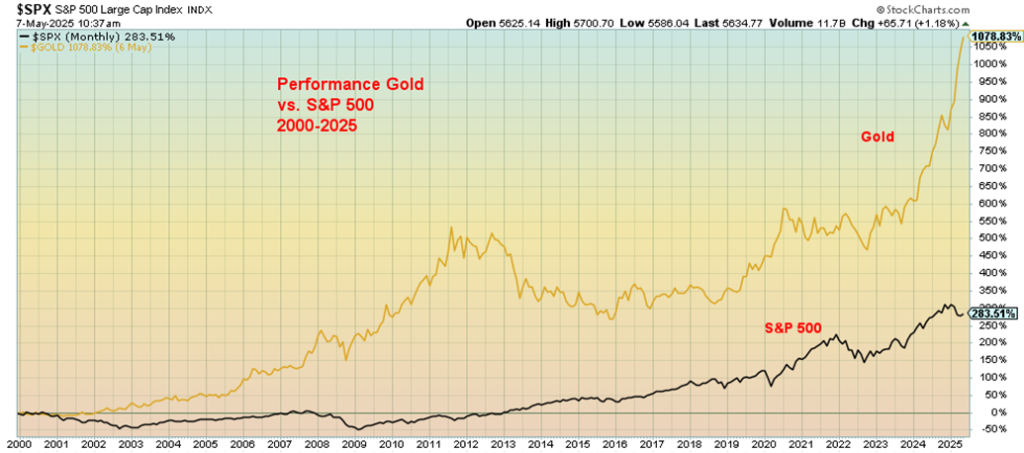
Gold, once fixed at $35, now floats freely after Nixon ended the gold standard in 1971. Since 2000, it has outperformed stocks, rising 1,078% vs. the S&P 500’s 284%. Amid global chaos and declining confidence in fiat currencies, gold remains under-owned despite its finite nature, no default risk, and growing central bank demand.

It almost seems like a cliché to say that there is a time to own stocks and a time to own gold. Yes, we have noted this before, but it is worth repeating. In many quarters, gold is still viewed as a barbarous relic of another era. Gold, however, has been around for over 3,000 years as money, a currency, and a store of value.
Gold has been steadily making all-time highs, recently as high as $3,500. That makes the view of gold as a barbarous relic harder to justify. Central banks have been steadily adding to their gold reserves since 2009, at the time of the 2007–2009 financial crisis and Great Recession. For years since the mid-1960s, central banks had been divesting themselves of gold. We also can’t help but notice that President Trump’s Oval Office has become rather golden, ornate. Apparently, he likes gold.
Stocks vs. Gold
When this century got underway, gold was trading at $287.50. Its low was hit at $251.70 in August 1999. But even that was well up from the fixed rate of $35 that had been in place since 1934. Then, in August 1971, President Nixon took the world off the gold standard that had been set by Bretton Woods. The U.S. dollar had been fixed to gold while other currencies floated in a small band around the U.S. dollar. After the gold standard ended, gold became freely trading and currencies also began float around the U.S. dollar.
The end of WW2 and subsequent wars in Korea, Vietnam saw the world overwhelmed with U.S. dollars as the U.S. balance of payments deficit grew. The gold standard ended when a central bank (thought to be the Bank of France) came to the U.S. and demanded that its hoard of U.S. dollars be converted to gold, as was allowed. The U.S. realized doing that would clean out their gold reserves. The U.S. blinked and the gold standard was gone.
Currencies, once pegged to the U.S. dollar and ultimately gold, were now merely fiat currencies backed by nothing except the good faith of the government; i.e. I.O.U.s. Exchange rates were set up now to float against the U.S. dollar and each other.
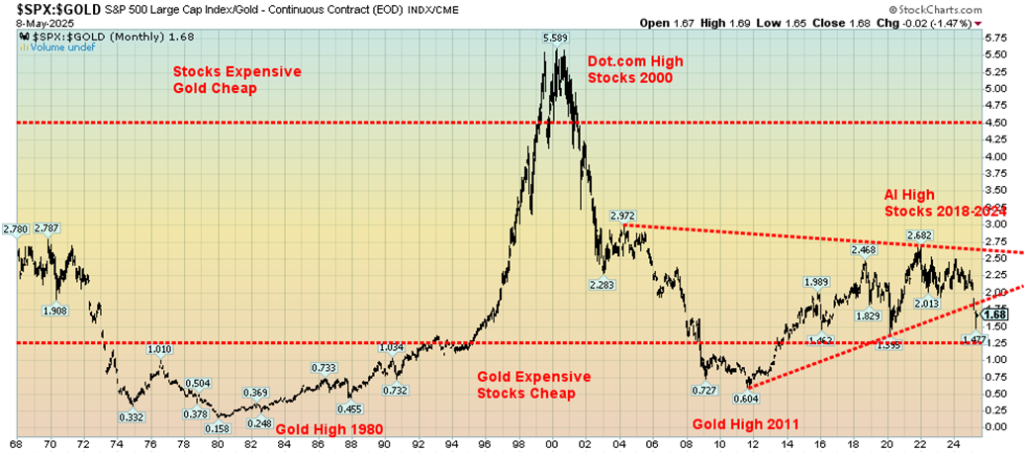
The Dow/Gold index has been around for some time. It is difficult to say who started the relationship. The Dow Jones Industrials (DJI) was the blue chip of stocks while gold was viewed as a safe haven in times of economic uncertainty, geopolitical conflicts, and loss of faith in government. That explains why the history of the Dow/Gold index has played out over a wide range.
In 1929, at the peak of the 1920s stock market bubble, it hit 18.36. In 1933, during the depths of the Great Depression, it had fallen to 1.94. It rose again as confidence regained and in 1966 it peaked at 27.85. Throughout the tumultuous, inflation-ridden 1970s, it declined, bottoming in 1980 at 1.29. Once again, it rose through the 1980s and 1990s, peaking in 1999 at 42.19. The dot.com crash and the Great Recession once again sent stocks tumbling and gold rising. The ratio bottomed in 2011 at 6.36.
The AI and MAG7 rush of the 2010s and 2020s once again signaled investors to own stocks over gold. But this time the response has been more muted than in previous periods of a strong stock market. So far, it has topped in 2018 at 22.36. Since then, the ratio has been in a slow downtrend. Now it is breaking down.
However, instead of looking at the Dow/Gold index, we are showing the S&P 500/Gold ratio. The DJI covers only 30 stocks, while the S&P 500 covers 500, a broader outlook. In any case, the picture is the same—we are breaking down in favour of gold. That should be no surprise, especially since the election of Donald Trump, which has unleashed a period of chaos and volatility. The tariff wars are sparking economic uncertainty and a loss of faith in government. Add in the growing conflicts in Russia/Ukraine, the Middle East, and now
India/Pakistan and we have geopolitical tensions. Where and when this bottoms out is, of course, a guess. But the odds favour at least a collapse towards the 2011 low of 6.36 and quite possibly lower.
Since 2000, gold has been a clear winner. Gold is up 1,078%, while the S&P 500 is up 284%. Yet gold, particularly in North America, continues to be under-owned. While central banks have been adding to their gold reserves, the Bank of Canada (BofC) sold all its gold in 2016, figuring they were better off holding U.S. securities. (Note: the decision was actually the Department of Finance/Government of Canada as the owners of the Bank of Canada). In 2015, gold as a percentage of global assets was a mere 0.5%. It’s probably higher now, but historically it is still on the low side. In 1960 it was 5%.
All the gold in the world is estimated to be 244,000 metric tonnes, which includes reserves in the ground. At $3,400 that’s about $26.7 trillion. However, if you eliminate reserves in the ground, the valuation drops to around $19 trillion. The global stock market size is estimated at $124 trillion and the global bond market at $133 trillion, probably higher. Global debt is estimated at $350 trillion and global real estate at about $655 trillion. A reminder that gold is finite, unlike debt. But then gold has no liability so it won’t default. Shouldn’t everyone own a bit of gold?
Fed Interest Rate Decision
The mandate of the Federal Reserve is to promote maximum employment, stabilize prices, and moderate long-term interest rates. Going into this past week’s FOMC meeting, the wide expectation was that the Fed would leave interest rates unchanged. And that is exactly what happened, much to the chagrin of President Trump. As Fed Chair Jerome Powell said, “if the large increases in tariffs that have been announced are sustained, they’re likely to generate a rise in inflation, a slowdown in economic growth and a rise in unemployment.” Powell added that the impacts could be temporary or more persistent.
We call that scenario of rising inflation, slowing economy, and rising unemployment stagflation. Powell is correctly taking a wait-and-see approach rather than responding with a knee-jerk reaction. Tariffs have a long history. In the 19th century the U.S. grew behind a wall of tariffs. But that didn’t stop globalization that had been growing through the centuries, dating back to BC and the Silk Road that connected China and Europe.
The spice trade routes created by the Islamic rulers of the 7th to 10th centuries added to the growth of globalization. That in turn led to the Age of Discovery throughout the 15th to 18th centuries. As the Industrial Revolution grew, so did globalization.
Tariffs have their place; however, as the world learned during the Great Depression, trade wars along with currency wars that negatively impact globalization have a huge negative impact on economic growth and employment, especially following years of an increasingly globalized world. Trade wars spark retaliation, disrupt supply chains, slow economic growth, reduce competition, and increase volatility in markets. We are seeing that with a huge drop in container shipping and freight shipping, a falling Baltic Dry Index that measures shipping, instability in stock markets, and falling economic growth. Trade wars could eventually lead to military wars—that’s Economics 101.
So, it is with today’s trade wars that Powell knows will have a negative impact on global economies and employment, but as well can negatively impact prices as the price of imports rises. Turning what was imported into a domestic industry where one didn’t exist before takes considerable time, financing, and skills training to fulfill the jobs required. It doesn’t happen overnight and may never happen.
Today, tariffs risk lifting inflation by making imported goods more expensive, as well as raising unemployment as companies are forced to cut jobs to counter the rising prices. A lose-lose situation. Given the rising U.S. debt and deficit and the economic instability of trade wars, the U.S. could see still another downgrade for its debt. Currently, the U.S. credit is rated AA+ by Moody’s, S&P, and Fitch. Weakness in the U.S. credit rating is reflected by rising credit default swaps spreads. Canada’s credit rating remains at AAA.
So, the Fed has to take a wait-and-see approach. Yes, the Fed has a tendency to be behind the curve. That is the price paid for waiting for the data before making a decision. So far, the data hasn’t resulted in a huge impact in inflation, unemployment, or a slowing economy. The first signs are being seen with the negative 0.3% GDP growth in Q1 and early signs of potential for rising unemployment. Next week we get the CPI/PPI for April and we’ll find out whether inflation is rising. Early forecasts suggest an uptick in inflation for both the CPI and PPI.
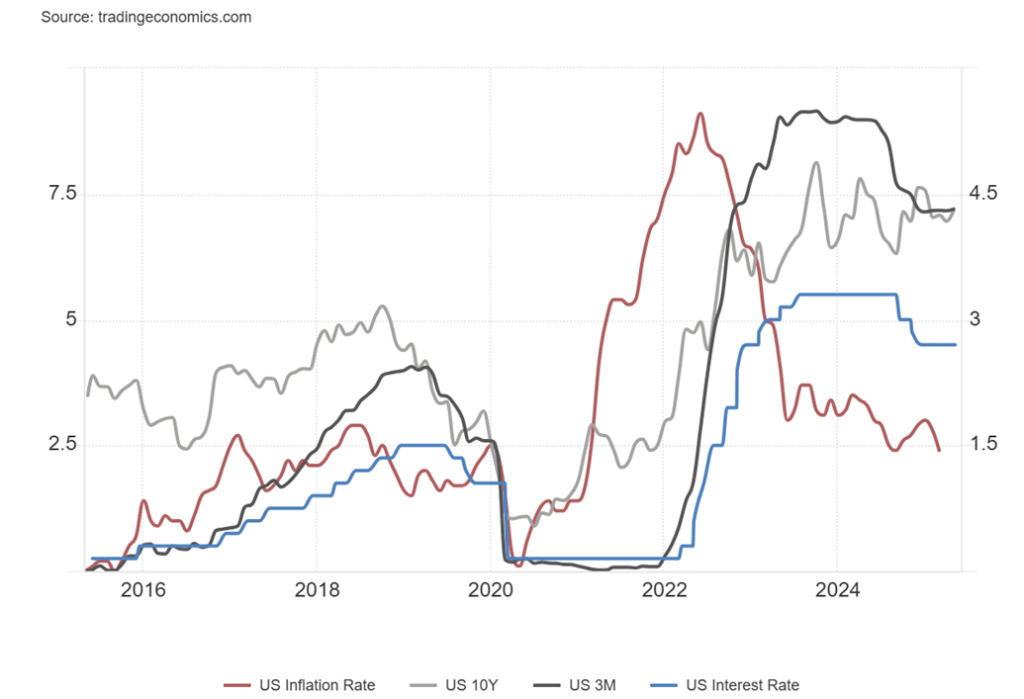
Our chart of various interest rates plus inflation shows that currently we have a normal curve with the rate of inflation below both the Fed rate, the U.S. 10-year Treasury note, and the U.S. 3-month Treasury bill. This followed years of an inverted yield curve when interest rates were artificially held below the rate of inflation, following the 2008 financial crisis, the Great Recession, and the 2020 pandemic. That inverted yield curve played a big role in creating the conditions for a stock market, housing and everything bubble. Borrowing money was cheap.
The odds of a rate cut between now and the next FOMC meeting on June 17–18 are slim to none. Many do not expect any rate cut until at least the September FOMC, despite the uncertainty being caused by the erratic trade and economic policies of the Trump administration.
Canada Job Numbers
Canada’s April job numbers came out, and the best one can say about them is that they are mixed. Canada added 7,500 jobs in April, above the expected 2,500 and well above the decline of 32,600 in March. The interesting part about the increase was that full-time jobs increased 31,500 while part-time jobs fell 24,200. Some of the increase is due to the jump of 37,000 in public administration to deal with the election. However, jobs increased in finance, insurance, real estate, and leasing while falling in manufacturing and wholesale/retail trade.
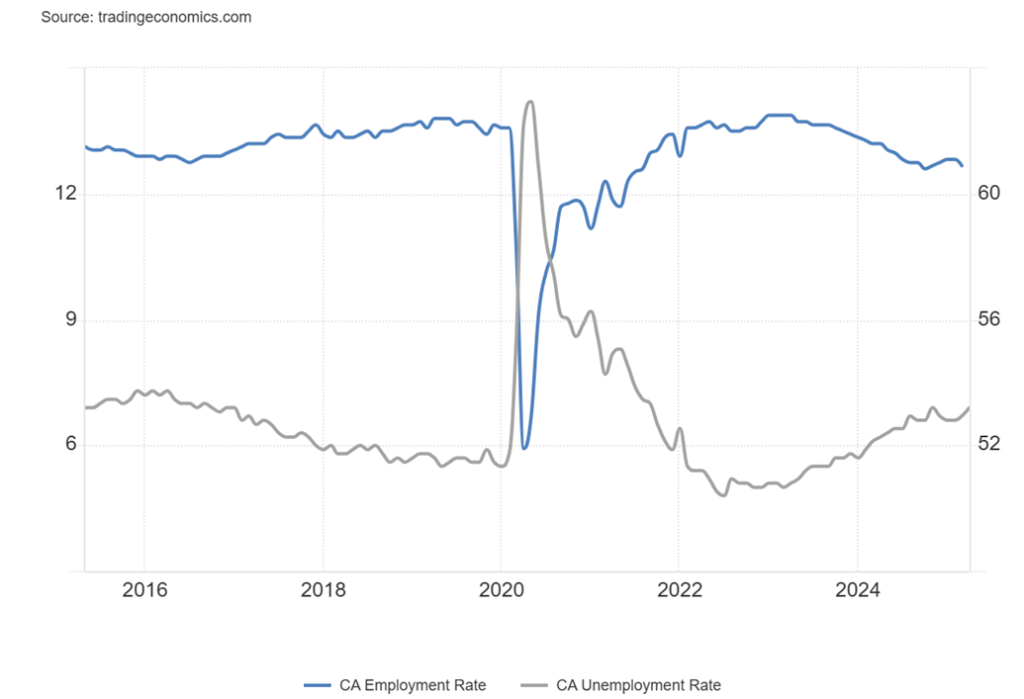
The unemployment rate rose to 6.9%, above the expected 6.8% and March’s 6.7%. Some of that is due to the rise in the labour force participation rate that jumped to 65.3% from 65.0%. As well, the labour force grew mostly in line with population growth. More people were entering the labour force. The employment population ratio was at 60.9%, down from 61.1%. That ratio remains slightly below the peak seen in February 2020 at 62.1%. The R8 unemployment rate (discouraged searchers, waiting group, and portion of involuntary part-timers) actually fell to 9.2% from 9.5%. However, it was the fourth consecutive month over 9%.
The big increase in jobs, as noted, came in public administration, largely related to the election held on April 28. It didn’t say whether they are part-time or full-time jobs The fall in manufacturing jobs has been directly attributable to the ongoing trade war between the U.S. and Canada. Tariffs have consequences. It is also why Ontario had the worst decline in employment and rise in unemployment, given it is the industrial heartland of Canada. In Windsor, a car manufacturing city, the unemployment rate jumped to 10.7% from 9.3%. Going forward, jobs dependent on trade with the U.S. are going to be squeezed.
Overall, this has to be construed as weak, given that the full impact of the trade war has not as yet been recorded. As well, election jobs may suddenly disappear. Given the negativity of tariffs, many are now expecting the BofC to lower rates by another 25 bp at its next meeting on June 4, 2025. The Canadian dollar has been improving as an offset to a weakening U.S. dollar. Bond yields have been mixed, given the uncertainty going forward.
Chart of the Week
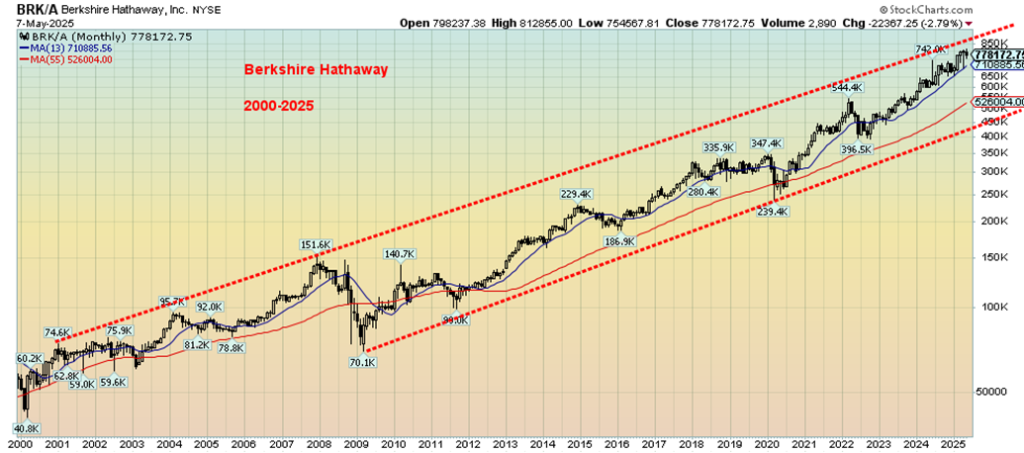
We couldn’t resist looking at the amazing Berkshire Hathaway (BRK.A and BRK.B) against the backdrop of the Oracle of Omaha Warren Buffett announcing his retirement as CEO of Berkshire, although he is to continue as Chairman. After all, Buffett is 94 but healthy and still working. Retirement? What’s that?
Throughout the 21st century, Berkshire has been on a steady rise upward. Oh yes, a few corrections along the way, notably during the 2008 financial crisis when Berkshire fell almost 54%, in line with the drop in the broader stock market. Berkshire also fell 31% during the pandemic panic of 2020, also mostly in line with the broader market. But there the similarity ends.
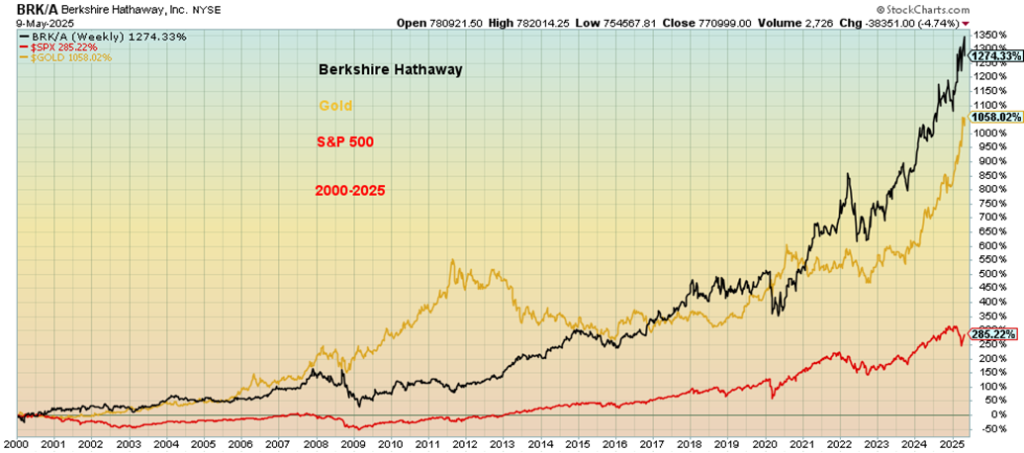
Since 2000, Berkshire is up a remarkable 1,274%, outpacing not only the S&P 500 that has only gained 285%, but also outpacing gold that is up 1,058%. Is Berkshire more valuable than gold? It seems that way. However, the price today is a daunting $771,000/share vs. gold at $3,350/ounce. Berkshire is 230 ounces of gold. If one wants a smaller share of Berkshire Hathaway, one can buy the B shares (BRK.B) that currently trade around $514. That’s less than 3/16ths ounces of gold for a share.
Berkshire pays no dividend and relies on growth of the stock. It doesn’t split, either. By market cap, Berkshire today is worth $1.533 trillion, making it the eighth largest company by market cap in the world. Buffett has a net worth estimated at $160.3 billion, making him the fifth richest person in the world, according to the Forbes billionaires list. Buffett is also a well-known philanthropist, pledging to give away 99% of his fortune to charity.
The real story on Berkshire, however, is its huge cash pile, now estimated to be about $350 billion. The suspicion is Buffett is seeing the U.S. monstrous debt and the massively growing interest payments which will be exacerbated by rising interest rates, all being pushed by the printing machine that Fed Chair Powell is trying to keep in check. Buffett is also seeing the chaos in Washington: the trade wars as well as the attacks on the
bureaucracy, on perceived enemies of Donald Trump, on the judiciary, and more. The crack is that Washington today is making Enron executives look responsible and prudent. As Buffett has said, “if something can’t go on forever, it won’t.”
“Fasten your seatbelts, it’s going to be a bumpy night!” – Margo, played by Bette Davis, All About Eve (1950).
Or, in our case, a bumpy four years.
Buffett’s rules are simple:
Rule No. 1: don’t lose money.
Rule No. 2: don’t forget rule No. 1.
Markets & Trends
| % Gains (Losses) Trends | ||||||||
| Close Dec 31/24 | Close May 9/25 | Week | YTD | Daily (Short Term) | Weekly (Intermediate) | Monthly (Long Term) | ||
| ne | ||||||||
| S&P 500 | 5,881.63 | 5,659.91 | (0.5)% | (3.8)% | up | down (weak) | up | |
| Dow Jones Industrials | 42,544.22 | 41,249.48 | (0.2)% | (3.0)% | up (weak) | down | up | |
| Dow Jones Transport | 16,030.66 | 14,040.31 | (0.3)% | (11.7)% | neutral | down | down | |
| NASDAQ | 19,310.79 | 17,928.92 | (0.3)% | (7.2)% | up | down (weak) | up (weak) | |
| S&P/TSX Composite | 24,796.40 | 25,537.74 | 2.0% | 3.3% | up | up | up | |
| S&P/TSX Venture (CDNX) | 597.87 | 683.40 (new highs) | 4.1% | 14.3% | up | up | up | |
| S&P 600 (small) | 1,408.17 | 1,264.32 | 0.5% | (10.2)% | up (weak) | down | neutral | |
| MSCI World | 2,304.50 | 2,547.03 | 1.4% | 10.5% | up | up | up | |
| Bitcoin | 93,467.13 | 103,439.38 | 6.7% | 10.7% | up | up | up | |
| Gold Mining Stock Indices | ||||||||
| Gold Bugs Index (HUI) | 275.58 | 400.12 | 6.2% | 45.2% | up | up | up | |
| TSX Gold Index (TGD) | 336.87 | 488.86 | 7.6% | 45.2% | up | up | up | |
| % | ||||||||
| U.S. 10-Year Treasury Bond yield | 4.58% | 4.39% | 1.9% | (4.2)% | ||||
| Cdn. 10-Year Bond CGB yield | 3.25% | 3.18% | (0.6)% | (2.2)% | ||||
| Recession Watch Spreads | ||||||||
| U.S. 2-year 10-year Treasury spread | 0.33% | 0.49% | 2.1% | 48.5% | ||||
| Cdn 2-year 10-year CGB spread | 0.30% | 0.64% | 3.2% | 113.3% | ||||
| Currencies | ||||||||
| US$ Index | 108.44 | 100.38 | 0.4% | (7.4)% | down (weak) | down | down | |
| Canadian $ | 69.49 | .7178 | (0.9)% | 3.3% | up (weak) | up (weak) | down | |
| Euro | 103.54 | 112.57 | (0.4)% | 8.7% | up (weak) | up | up | |
| Swiss Franc | 110.16 | 120.29 | (0.6)% | 9.2% | up (weak) | up | up | |
| British Pound | 125.11 | 133.09 | 0.3% | 6.4% | up | up | up | |
| Japanese Yen | 63.57 | 68.81 | (0.2)% | 8.2% | neutral | up | neutral | |
| Precious Metals | ||||||||
| Gold | 2,641.00 | 3,329.31 | 2.8% | 26.1% | up | up | up | |
| Silver | 29.24 | 32.77 | 2.2% | 12.1% | neutral | up | up | |
| Platinum | 910.50 | 994.90 | 3.6% | 9.3% | up | neutral | neutral | |
| Base Metals | ||||||||
| Palladium | 909.80 | 975.50 | 2.7% | 7.2% | up | neutral | down | |
| Copper | 4.03 | 4.61 | (0.9)% | 14.4% | down | up | up | |
| Energy | ||||||||
| WTI Oil | 71.72 | 61.02 | 4.2% | (14.9)% | down | down | down | |
| Nat Gas | 3.63 | 3.79 | 3.8% | 4.4% | up | up | neutral | |
It was a waffle week as the Fed did nothing as expected and there were potential talks to resolve trade between the UK/U.S. and China/U.S. The UK deal was underwhelming and the wide expectation is the China talks will go nowhere fast. This week we get the inflation numbers. That it was a waffle week after the rather sharp rebound from the Liberation Day mini-crash should be no surprise. Not surprisingly, the indices are at resistance. As well, straight-up moves are not sustainable.
On the week, the S&P 500 fell 0.5%, the Dow Jones Industrials (DJI) was off 0.2%, and the Dow Jones Transportations (DJT) was down 0.3% as was the NASDAQ. The mid and small indices were actually up, but not by much. Both the S&P 400 (Mid) and the S&P 600 (Small) were up 0.5%. However, both remain well off their highs. The S&P 500 Equal Weight Index was up about 0.4% while the NY FANG Index fell 1.3%, thanks to Google.
Bitcoin continued its upward run back over $100,000, gaining 6.7% on the week as excitement mounted over the Trump cryptocurrency plays. These plays along with a plethora of new hotels etc. benefits not only the Trump organization but Trump himself. We note that Bitcoin continues to make what appears to us as a huge topping pattern. We don’t expect new highs and view this as a retest for a possible double top. However, until we do, we can’t rule out new highs.
In Canada, the TSX, thanks to the Materials sector, gained 2.0% while the junior TSX Venture Exchange (CDNX) once again made 52-week highs, up 4.0% on the week. In the EU, the London FTSE fell 0.5% but on the continent they gained. The Paris CAC 40 was flat, the German DAX made slight all-time highs (the only one), up 1.8%, and the EuroNext was up 0.5%. In Asia, China’s Shanghai Index (SSEC) was up 1.9%, the Tokyo Nikkei Dow (TKN) gained 1.8%, while Hong Kong’s Hang Seng (HSI) was up 1.6%. North America off, Europe and Asia up. Is capital flowing out of the U.S. to the EU and Asia? Foreign owners of U.S. stocks is 18% plus foreigners own roughly 25% of the U.S. Federal debt.
The April collapse was driven by Liberation Day and the raft of tariffs. The rebound was driven by Trump changing his mind and delaying and attempts to reconcile with the U.S. trading partners. But remember the U.S. has to make deals with 190 countries. All other countries only have to do one. However, global trade was based on rules through the World Trade Organization (WTO), an organization now neutered and rendered useless by the U.S. Everyone may say that tariff wars are a lose-lose situation, but that seems to matter little to the Trump administration as they continue their quest to reshape not just the U.S. but the world in their image. Irrespective of this, there is considerable resistance alone in the U.S. that could yet explode into violent clashes.
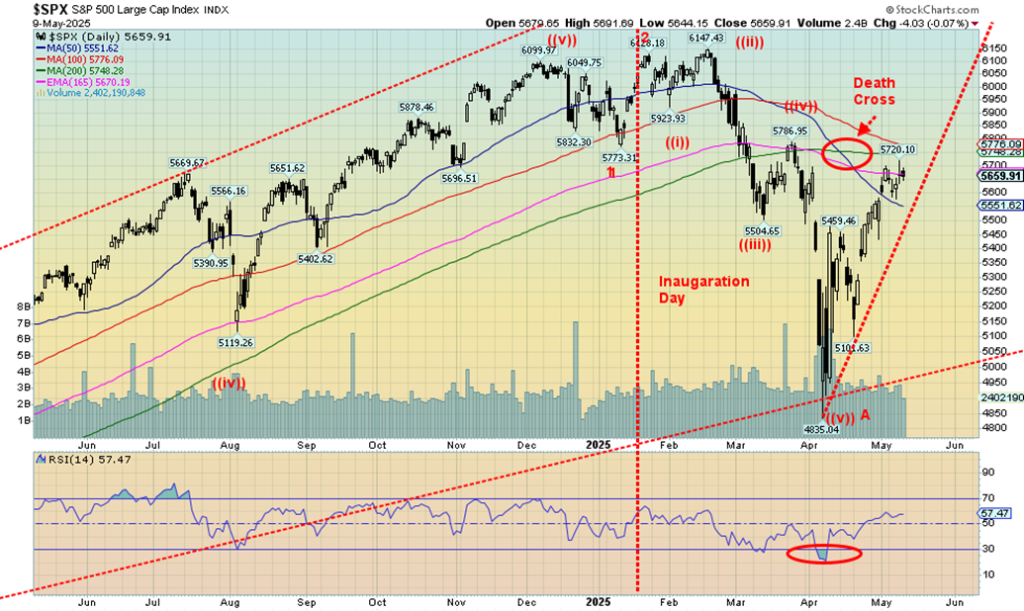
We continue to believe this rebound is the B wave of a much larger ABC pattern. The A wave bottomed in early April while the rebound has been virtually a straight-up affair. These types of moves are usually unsustainable. We note that the A wave appears to have fallen in five waves to the downside, telling us that a potential primary move to the downside is underway. The A wave crossed briefly into bear market territory; i.e. down 20% plus. Many believe that a secular bear market is underway. They tend to average at least 2 years in length.
The breakdown now appears to be around 5,500. Under 5,000 new lows are possible. There is considerable resistance here up to 5,800. Above 5,850 new highs are possible. B waves can be tricky and on very rare occasions we have seen them make new highs, fooling everyone. That’s why we call them sucker rallies. The likelihood is no new highs. Otherwise, new highs might be construed as a continuation of the bull market. We don’t see that happening, but await confirmation instead that the B wave is over before saying never. The biggest sign to us of a potential further bear is the huge cash pile of Berkshire Hathaway.
To us, the 90-year cycle is alive and well. The last one was the Great Depression. The 18-year cycle is due around 2027 and the 6-year cycle comes in 5–8 years after the last one in 2022. The more popular 4-year cycle was probably the 2022 mini-bear as that was four years after the drop in 2018. There is, as one can note, a lot of overlap with these cycles. The big ones, like the 90-year, can last years as it did in the Great Depression and the one before that in the late 1830s to 1840s when there was another depression. Yes, there can also be big rallies within the context of the larger bear market. The Great Recession of 2007–2009 was probably the 72-year cycle, given it was 77 years from the 1932 low and the dot.com low was 70 years from the 1932 low.
As to the 90-year cycle, we have the perfect conditions with the trade wars along with geopolitical tensions and a loss of faith in government. Perfect conditions for gold.
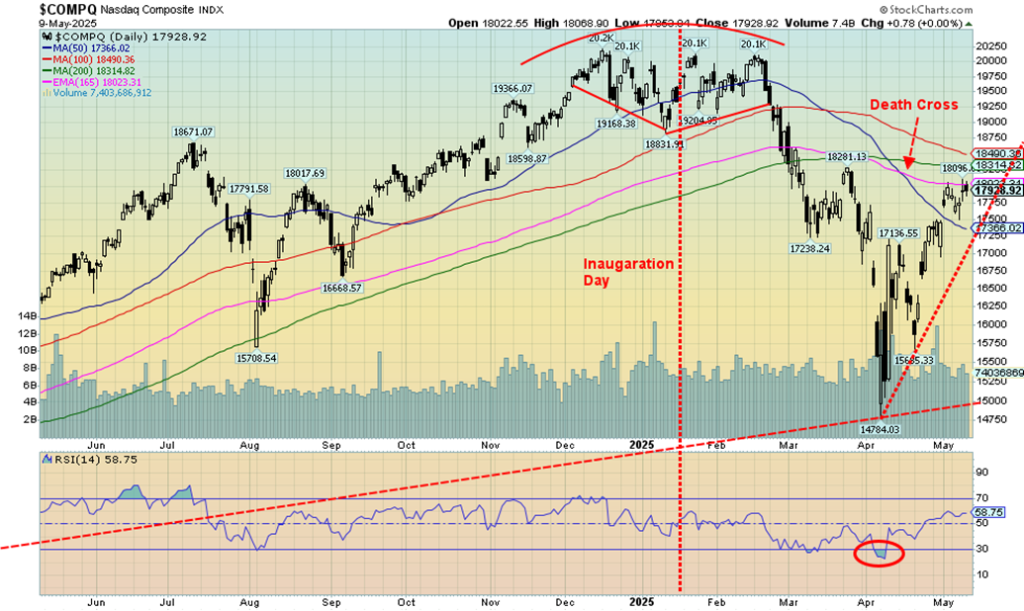
With other indices waffling this past week, it was no surprise that the NASDAQ also waffled. It fell 0.3%. We can’t help but notice that the NASDAQ is now at or near the 200-day MA and the 165-day EMA. They could prove to be tough hurdles to break over, at least initially. What the NASDAQ hasn’t done yet is to break down once again. To start a breakdown, we have to first break and close under 17,300. Under 17,000 we could accelerate. The MAG7 was weaker this week as well with the NY FANG Index down 1.3%.
The big loser was Google, down 6.9%. Irrespective of this, five of the MAG7 were up and two down. MAGS fell 0.3%. All small. It’s consolidation time after that big up move. But could it prove to be the top? Given the resistance that is near, we expect at least a pullback. We’d have to break under 15,550 to suggest to us that new lows lie ahead. We figure that as long as we remain above 16,500, this consolidation with an upward bias should continue. B waves are not usually one up and done. We could test back before rising again. New highs are possible above 18,900.
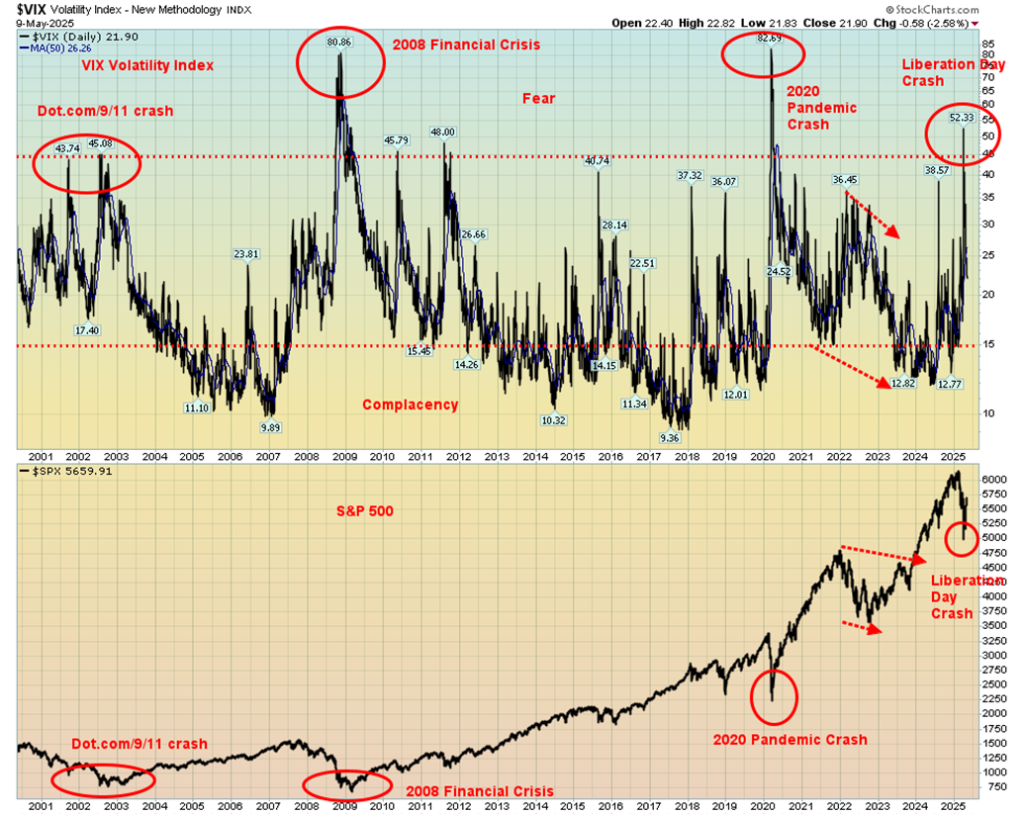
Volatility is thy name. We promised volatility, along with chaos, in 2025. We’re getting both. In the recent tariff crash after Liberation Day, the VIX volatility indicator spiked as high as 52.3. That was the highest level seen since the pandemic crash of 2020. It was even higher than the dot.com crash of 2001–2002. No, not as high as in the financial crisis crash of 2008. Gone are the days of low volatility that we saw in 2004–2007, 2012–2020, and 2023–2024. Even today at 21.9 that’s still pretty high. Don’t expect it to come down any time soon, although one can never say never. Maybe we’ll see a pivot towards calming the markets, but we’re not counting on it.
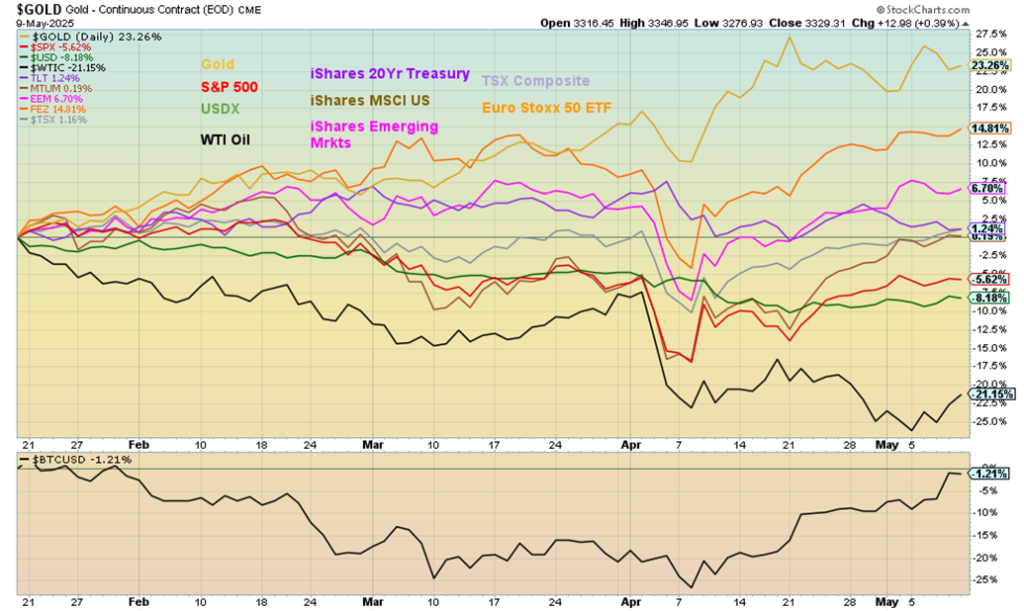
Our 2025 scorecard still has gold comfortably in the lead, up 23.3% since Inauguration Day. Euro Stoxx representing the EU is second, up 14.8%. WTI oil languishes at the bottom, down 21.2% on the year. Low oil prices do little for Trump’s “drill, baby, drill” mantra as they need higher oil prices, preferably around $80 or more. Bitcoin’s recent recovery has now put it on the cusp of turning positive. Most remain down.
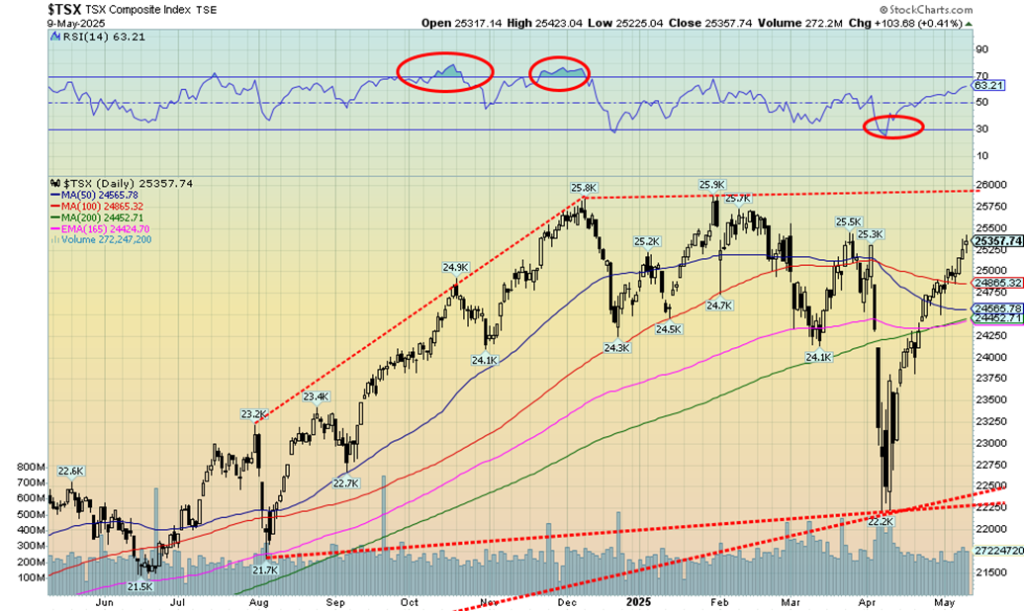
Thanks to Materials, the TSX chugged higher this past week, outpacing the U.S. indices. The TSX was up 1.3%. Even better was the TSX Venture Exchange (CDNX) continuing to show some life, up 4.1% to fresh 52-week highs. Still, the CDNX has a long way to go just to get back to the February 2021 highs near 1,100. That’s nearly a double from current levels. Nonetheless, we’ll take the encouragement where we can get it. Of the 14 sub-indices, only three were down. The worst was Health Care (THC), down 4.2% and now down 26.7% in 2025.
The best was Golds (TGD), up 7.6%, followed by Materials (TMT), up 5.8%, and Metals & Mining (TGM), up 4.8%. Best on the year is the TGD, up 45.1%. The rise of the TSX from that April low has been almost straight up. Surprisingly, it is still not particularly overbought with an RSI at 63. That suggests further room to rise. We are approaching major resistance at 26,000.
We could even make new highs as we have already passed the point that suggests new highs are very possible. Golds, Materials, and Metals have proven that they remain the sectors to be in so far in 2025, all up over 15% in 2025. Of all the others, Consumer Staples (TCS) is the closest and it is up only 7.2% in 2025. Breakdown only occurs under 24,400 and even 23,750.
U.S. 10-year Treasury Note, Canada 10-year Bond CGB
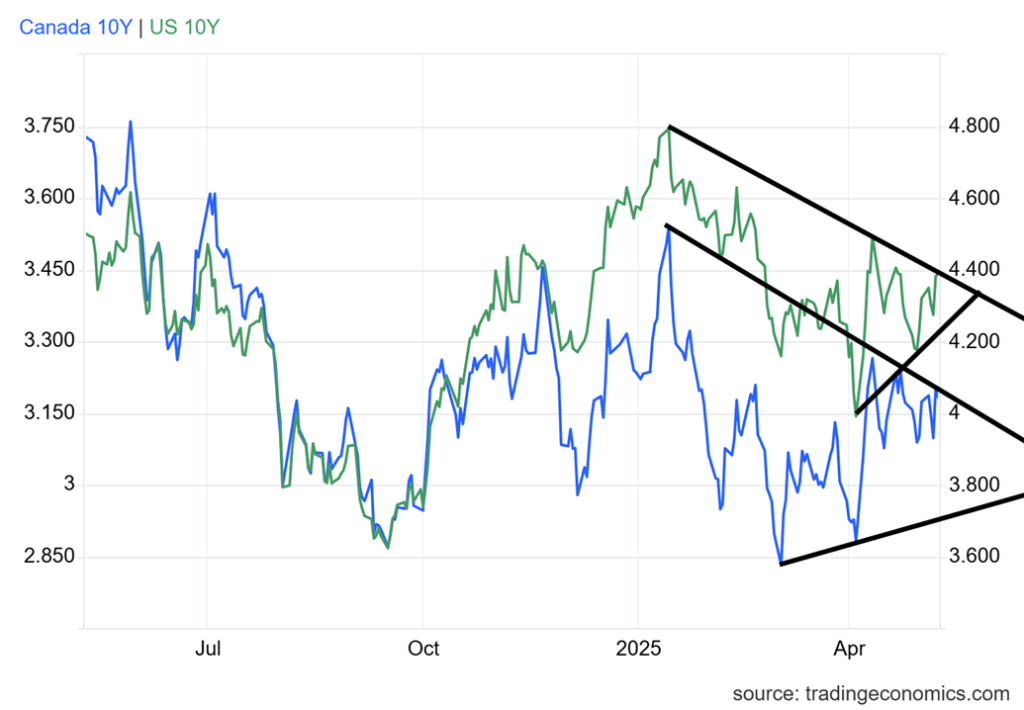
As the Fed stood pat, the bond market yawned. Okay, it firmed a little. This past week saw the 10-year U.S. Treasury note rise to 4.39%, up from 4.31%. A breakout now over 4.40% could send yields even higher towards 4.60%. Not what Trump wants. But the bond market is not controlled by the Fed as is the short end of the curve. The 2–10 yield spread widened to 49 bp, up from 48 bp. Doesn’t seem like much, but it is wider. In Canada, the 10-year Government of Canada bond (CGB) slipped slightly to 3.18% from 3.20%.
The 2–10 spread was 64 bp, up from 62 bp. So not much movement on the week. Maybe we’ll get more excitement this coming week with the release of the April inflation numbers, CPI, and PPI. The market is expecting the CPI to be up 2.5% vs. March’s 2.4%. The PPI is expected to 3.1% vs. 2.7% y-o-y. Retail sales are also out this coming week and the expectation is for a fall of 0.1%. All eyes will be on Fed Chair Jerome Powell next Thursday as he speaks.
Bond yields have remained elevated. There remains the threat of foreign countries unloading their treasury bonds, even as it makes little sense to do so. The U.S. bond market remains the largest and most liquid market in the world. There remains some fear of a potential downgrade for U.S. debt to AA from the current AA+.
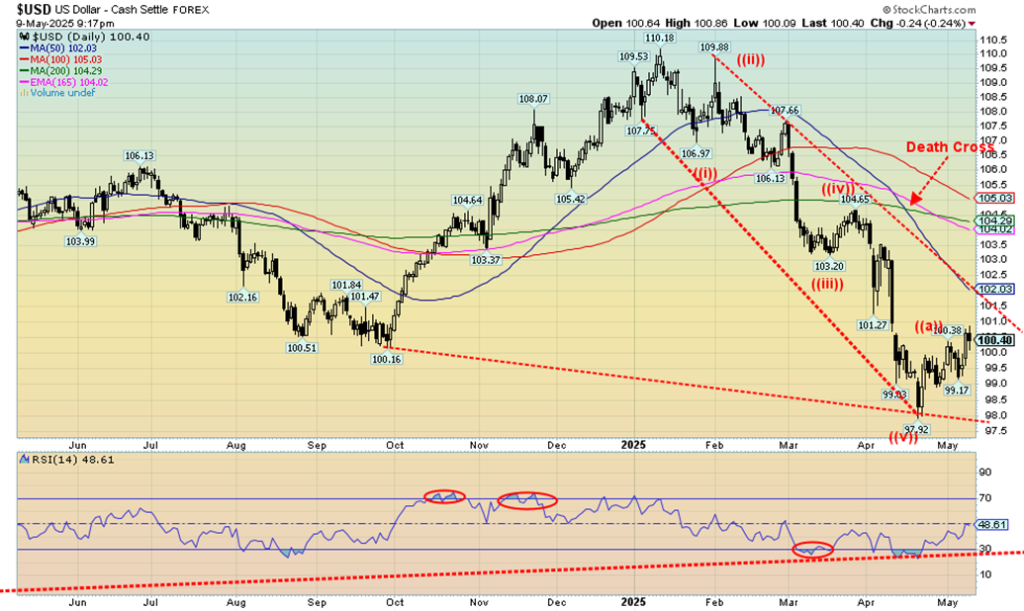
The US$ Index rose slightly this past week on news of some sort of trade deal (underwhelming) with the UK and talks underway with China over tariffs. Despite that small rise, gold managed to rise in face of U.S. dollar strength. The US$ Index rose 0.4% this past week, the euro fell 0.4%, the Swiss franc was down 0.6%, the pound sterling gained 0.3%, while the Japanese yen fell 0.2%. The Canadian dollar fell 0.9% on weak oil prices, even as oil bounced upward this past week.
The US$ Index appears to be chugging its way toward downside resistance near 102. A firm break above 102 could take us to stronger resistance at 104/105. For the longer term, we remain bearish on the U.S. dollar, but in the interim a countertrend rebound could be underway. Trouble only starts under 99 and is over under 98. We see this rebound as corrective only, but admit it could be with us irregularly into June, even July.
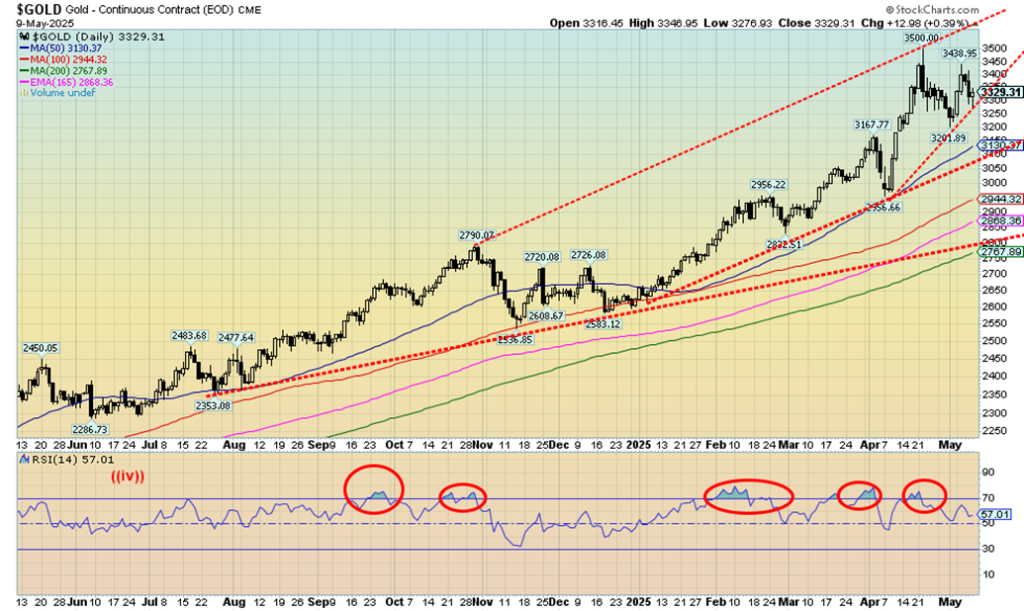
The often contradictatory comments from Trump about tariffs leave the market confused. Despite it all, gold managed to rise this past week with a gain of 2.8%. The on-again, off-again talk about tariffs has the market hesitant, gold confused, long interest rates elevated, and Jerome Powell on the sidelines awaiting data before cutting interest rates. Otherwise, he ignores Trump. Nonetheless, for the gold bugs, the rise was good as silver also rose, albeit not as much, up 2.2%. The gold stocks had a good week with the Gold Bugs Index (HUI) up 6.2% and the TSX Gold Index (TGD) up 7.6%. Gold stocks have had a stellar year so far. We’re even seeing a bit of movement in the junior exploration stocks.
Despite ending the week higher, we remain below the $3,500 high seen earlier. After falling 8.5%, gold bounced back at 7.4%. This may very well be a B wave so we shouldn’t get too complacent yet. We need to not only be seeing new highs above $3,500 but simultaneously we need to see silver and the gold stock indices also making new highs. A failure here is not a disaster but another break of $3,300 could see us fall towards the 50-day MA near $3,130.
A break under the recent low of $2,957 could in theory take us back to $2,750 where the 200-day MA is. A test of the 200-day MA is not unusual. Foreign demand has been strong, particularly in China, even as India appears to have pulled back. The tariffs, which were not as yet fully through the economy, are going to spike inflation, making it difficult for the Fed to cut rates. Slow growth and rising unemployment suggest stagflation.
However, as we have noted many times, gold will go up because of geopolitical tensions, economic uncertainty, and a loss of faith in government. All three are present, which helps explain gold’s rise as a safe haven. It has, after all, been around for 3,000 years and has been a store of wealth, currency, and money. A supposed halt in the fighting between India and Pakistan could lean on gold on Monday (easing of geopolitical tensions). Talks on tariffs with China could also alleviate some economic uncertainty. However, we note that don’t expect the India/Pakistan cease fire to hold (already failing) nor we do expect anything substantial from the U.S./China talks.
New highs with everyone (silver, gold stock indices) making new highs will confirm that the next leg up is underway. A failure means a test of support below. But we’d have to break down under $2,600 to suggest to us that the gold bull may be over.
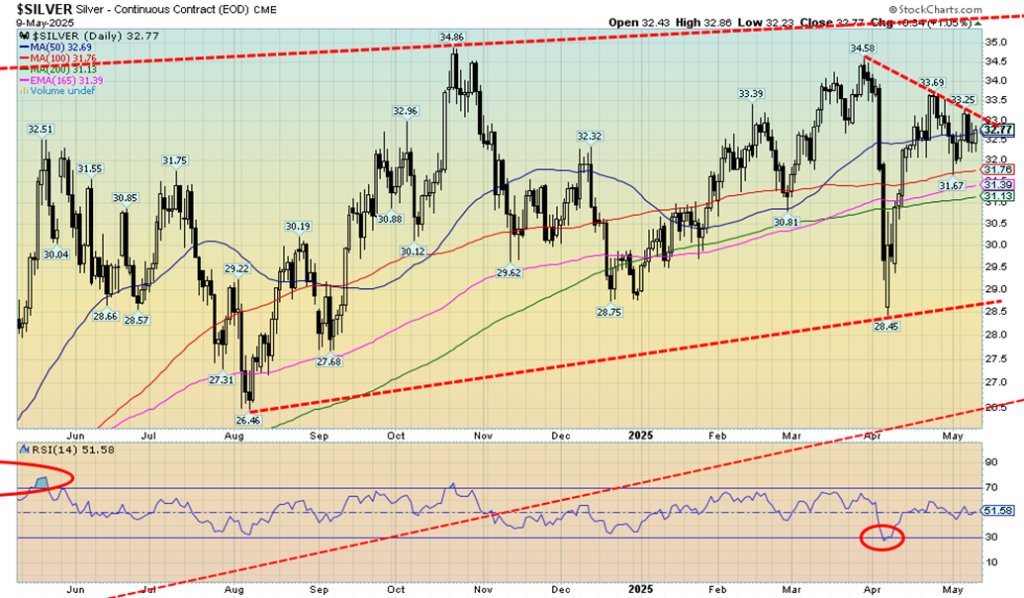
Until we see silver firmly leading the way up we’ll continue to be cautious about the next move for gold, silver, and the gold stocks. Gold stocks had a good week as did gold, but silver’s 2.2% gain for the week was below gold’s 2.8%. And on the year, gold is up 26.1% to silver’s 12.1%. Yes, the paper market seems to be keeping silver down given it’s a key industrial metal. Yes, gold is recognized as a monetary metal more than silver. But in previous big run-ups silver outperformed. The 2009–2011 rise saw silver rise 489%, compared to gold’s 181% rise. The HUI rose 326% and the TGD was up about 200%. All outpaced gold and silver was the leader. This time? Meh!
The only thing we are feeling encouraged about is that silver is making a series of rising bottoms with a potential for a relatively flat top. That’s a rising or ascending triangle, which is ultimately bullish. Certainly, we hear all the time forecasts that silver is going to explode, silver is going to $300, etc. But the reality is we need to get through $35 first, and preferably through $36. While gold makes new highs, silver is still below its October 2024 high of $34.86. We remain hopeful. If we do break $36, then the target becomes $44. However, we prefer we at least remain above $31 and especially above $30. With an RSI of 52 we have a lot of room to move higher.
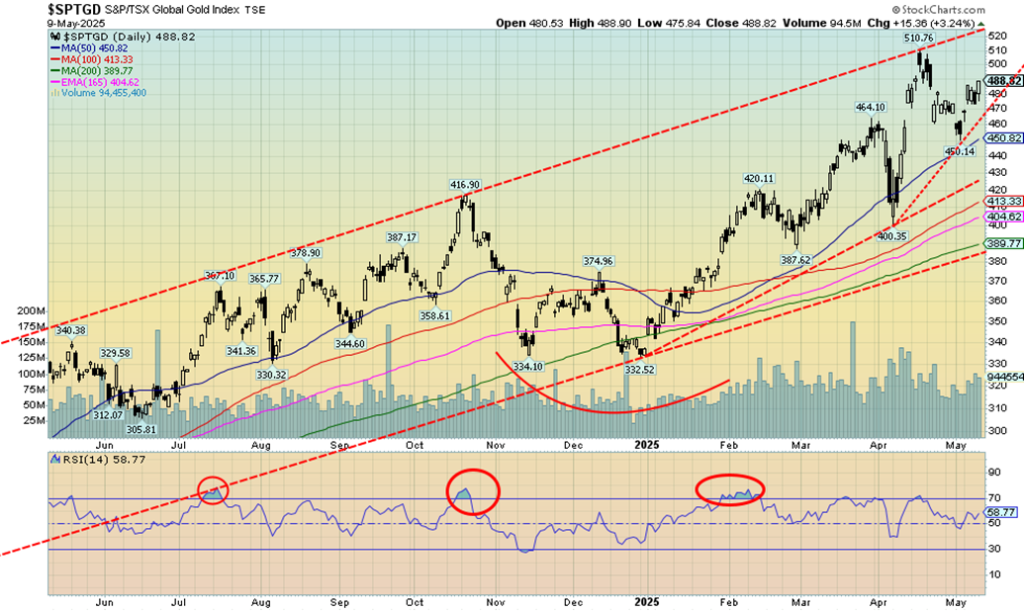
The gold stocks continue to prove they are the place to be in 2025, thanks to all the chaos and volatility. With gold up 26%, it should be no surprise the gold stocks are up almost double what gold is up. Too bad silver doesn’t catch up; if so, we’d be up even more. Despite the rise this past week, we remain off the recent highs. The TSX Gold Index (TGD) gained 7.6% this past week while the Gold Bugs Index (HUI) was up 6.2%. As we have noted, we are not sure this is the start of a new upleg or just a B wave in the current correction pattern.
New highs above 511 should calm the markets, but we’d prefer to see new highs above 520 to fully convince us we are on another upleg. Otherwise, a breakdown under 450 could signal a decline to 410/420. Even at that level we’d still be up on the year. So far, it’s been a golden year. Now if only the junior exploration stocks would start to move. Okay, we are seeing a bit of life as the junior TSX Venture Exchange (CDNX) continues to make new 52-week highs. The CDNX is over 50% junior mining stocks in gold, silver, and metals. And it is still cheap at these levels. Major long-term support for the TGD is at around 390.
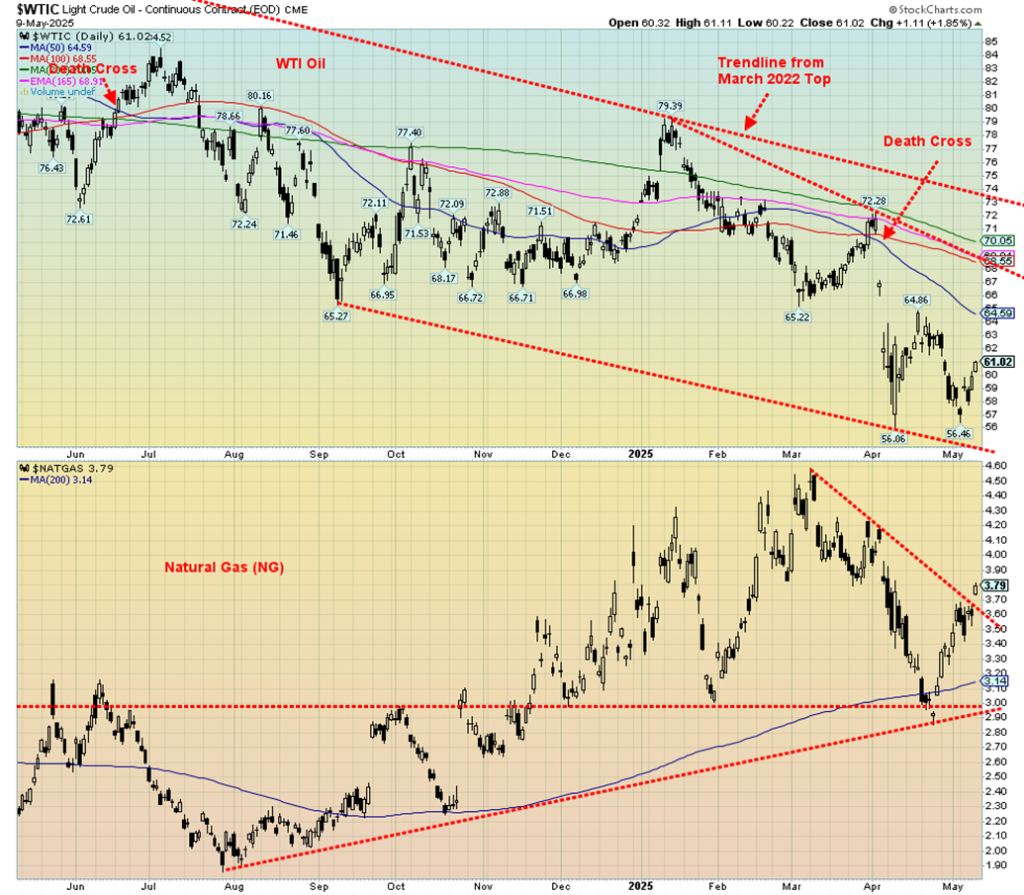
WTI oil rose this past week, primarily because of thoughts that trade deals might be worked out. Cited was the U.S./UK deal and attempts to resolve the U.S./China trade frictions. Except the U.S./UK deal wasn’t as a big of a deal as being made out, and any deal with China appears to be distant. Nonetheless, that helped WTI oil gain 4.2% this past week and Brent crude jump 3.7%.
Despite all the talk of trade deals, lurking in the background are still threats to hit Iran. Natural gas (NG) also rose, primarily because of production drops even as LNG exports rose. NG at the Henry Hub appears to have broken out, gaining 3.8% this past week while NG at the EU Dutch Hub jumped 6.1%. Energy stocks also gained as the ARCA Oil & Gas Index (XOI) was up 1.6% and the TSX Energy Index (TEN) gained 3.5%.
WTI oil has potentially made a double bottom at $56.06 and $56.46. A firm break above $65 could project up to about $75. After languishing for months, that would be positive for oil and put it on the cusp of a major breakout or more. New lows, however, would end that discussion. Production increases by OPEC that are still lurking in the background could help push oil prices lower. Initially here, at least, there are thoughts that we could break out, but we have a way to go.
Oil is relatively cheap at these levels. While good for car drivers it is not necessarily good overall. U.S. production has been falling, oil rig counts are down and investment is falling. We can’t help but notice that oil and gasoline stocks are also low. That could help prices if they decide to refill. If this period of low oil prices persists then the U.S. (and others too such as Canada) will be ill-prepared to gear up. That in turn could help spur higher prices still.
Finally, we note that Warren Buffett is eying an investment in Occidental Petroleum (OXY). Maybe he spots an opportunity.
__
(Featured image by Michael Steinberg via Unsplash)
DISCLAIMER: This article was written by a third party contributor and does not reflect the opinion of Born2Invest, its management, staff or its associates. Please review our disclaimer for more information.
This article may include forward-looking statements. These forward-looking statements generally are identified by the words “believe,” “project,” “estimate,” “become,” “plan,” “will,” and similar expressions, including with regards to potential earnings in the Empire Flippers affiliate program. These forward-looking statements involve known and unknown risks as well as uncertainties, including those discussed in the following cautionary statements and elsewhere in this article and on this site. Although the Company may believe that its expectations are based on reasonable assumptions, the actual results that the Company may achieve may differ materially from any forward-looking statements, which reflect the opinions of the management of the Company only as of the date hereof. Additionally, please make sure to read these important disclosures.
David Chapman is not a registered advisory service and is not an exempt market dealer (EMD) nor a licensed financial advisor. He does not and cannot give individualised market advice. David Chapman has worked in the financial industry for over 40 years including large financial corporations, banks, and investment dealers. The information in this newsletter is intended only for informational and educational purposes. It should not be construed as an offer, a solicitation of an offer or sale of any security. Every effort is made to provide accurate and complete information.
However, we cannot guarantee that there will be no errors. We make no claims, promises or guarantees about the accuracy, completeness, or adequacy of the contents of this commentary and expressly disclaim liability for errors and omissions in the contents of this commentary. David Chapman will always use his best efforts to ensure the accuracy and timeliness of all information. The reader assumes all risk when trading in securities and David Chapman advises consulting a licensed professional financial advisor or portfolio manager such as Enriched Investing Incorporated before proceeding with any trade or idea presented in this newsletter.
David Chapman may own shares in companies mentioned in this newsletter. Before making an investment, prospective investors should review each security’s offering documents which summarize the objectives, fees, expenses and associated risks. David Chapman shares his ideas and opinions for informational and educational purposes only and expects the reader to perform due diligence before considering a position in any security. That includes consulting with your own licensed professional financial advisor such as Enriched Investing Incorporated. Performance is not guaranteed, values change frequently, and past performance may not be repeated.


The TopRanked.io Weekly Digest: What’s Hot in Affiliate Marketing [++ KuCoin Affiliate Program Review]
X now allows people to block certain topics from their feed. This week, we're going to tell you how to...


Hotel Stay Project Supports Wildlife Conservation in Japan
Iwate Prefecture launched a project linking hotel stays to conservation through Morioka Zoological Park Zoomo. A themed room at Yunomori...


Bitcoin Leads Modest Crypto Rebound Amid Mixed Signals
Bitcoin rose 2 percent to above 77000 as ETFs saw 15 million inflows and April gains of 12.2 percent. Ethereum...


Major Pharma Advances: EU Approvals, Vaccine Progress, and Breakthrough Clinical Results
Johnson & Johnson has EU approval for nipocalimab for generalized myasthenia gravis, showing superior control and sustained benefits. Sanofi reported...


Agential Cannabis 2026 to Drive APAC Market Growth and Global Industry Collaboration
Agential Cannabis 2026 will take place September 23–24 in Bangkok, bringing global experts together to advance the APAC medical cannabis...
 |
|
 |  |
 |
|
-
 Crypto1 week ago
Bitcoin Strong as Market Sentiment Turns Bullish Amid Industry Developments
-

 Markets3 days ago
Sugar Markets Rise as Global Supply Outlook Strengthens
-

 Crypto2 weeks ago
Bitcoin Holds Steady as Institutions Move In and Crypto Markets Stay Neutral
-
 Crowdfunding7 hours ago
Hotel Stay Project Supports Wildlife Conservation in Japan