Markets
Governments Subvert the Principle of the Market
Government interventions like central bank liquidity injections have inflated market bubbles, setting us up for inevitable busts which are only further exacerbated by government policies and bloated bureaucracies. The Dow Jones is experiencing significant daily volatility, indicating potential market shifts with a major bear market being a real possibility if it falls below a certain threshold.
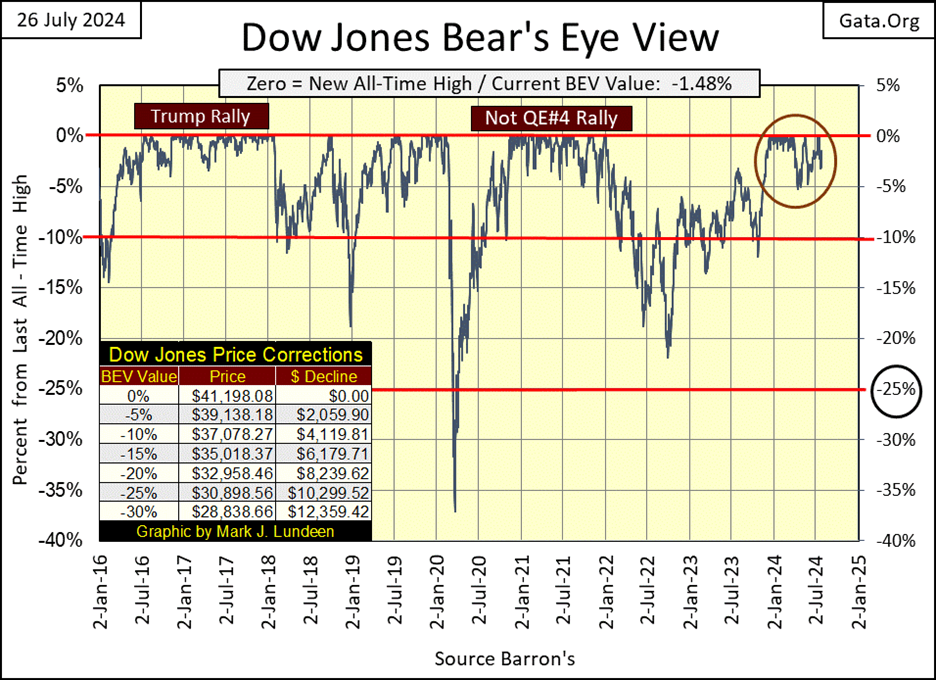
This week, the Dow Jones closed everyday in scoring position, not one day below its BEV -5% line. So, we continue assuming the advance that began last November (red circle below), has additional all-time highs coming in the weeks and months to come.
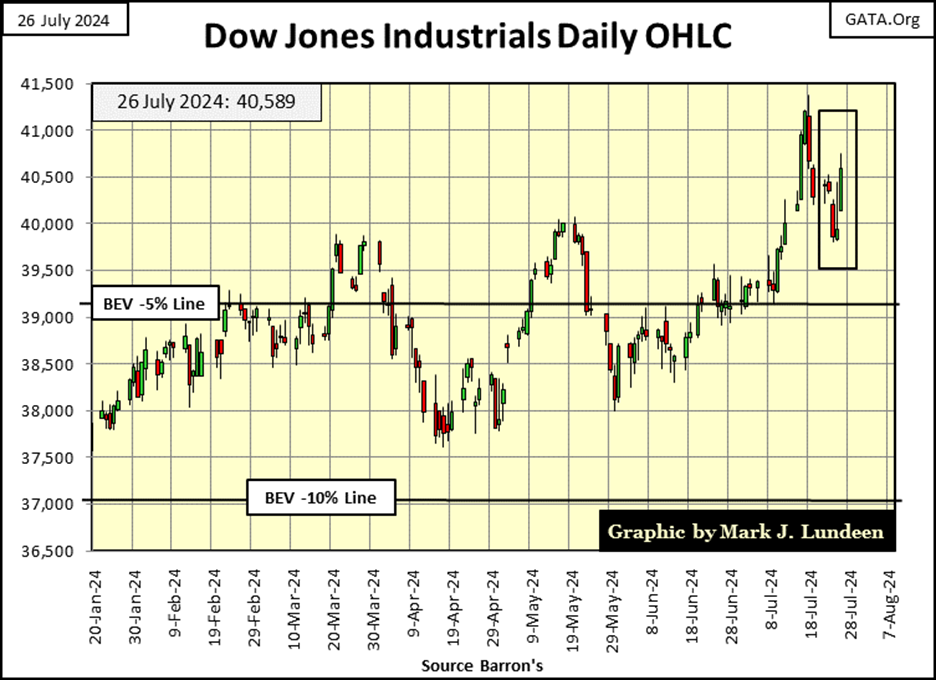
One drawback of looking at the Bear’s Eye View (BEV) for a market-data series is, the lack of drama the market frequently has. In the past two weeks, the Dow Jones certainly has seen some drama, in its daily bar chart below.
By Tuesday’s close, I was anticipating a close below the Dow Jones’ BEV -5% line. But Thursday and Friday’s trading corrected that error in judgement on my part. One thing to note about the trading for the last two weeks seen below, is the many large daily moves in the Dow Jones. Big bear markets frequently begin this way, with a big increase in daily volatility, exactly as seen below.
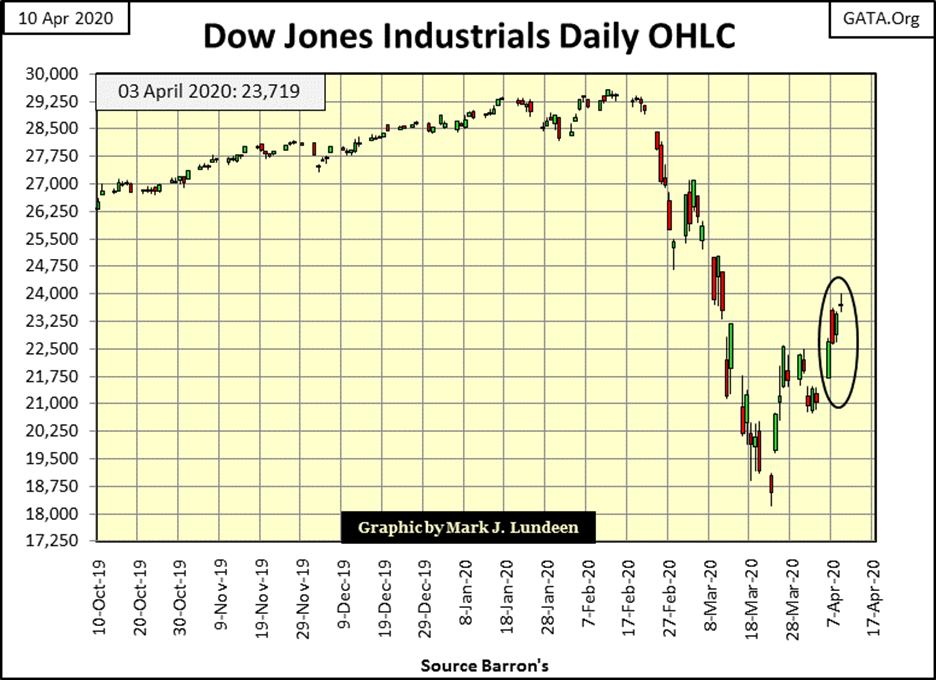
Below is the Dow Jones daily bar chart from my 10 April 2020 article, just after the FOMC “injected” a few trillions-of-dollars into the financial system.
It’s easy seeing when the panic selling of the March 2020 flash crash began, by noting the increase in daily volatility – oversized daily moves to the up and downside. So, bear markets also see big daily advances? Yes, they do! During the Great Depression Market Crash, the Dow Jones saw daily Advances of 10%, and more from a previous day’s close. But in the depressing 1930s, that didn’t mean the bear market had bottomed.
So, are we at the beginning of a massive bear market for Wall Street? Until the Dow Jones closes below its BEV -5% line in the charts above, I’m not going to even consider such a possibility.
But the day is coming when the Dow Jones will close below scoring position (BEVs of -0.01% to -4.99%). Should the Dow Jones then approach, and break below its BEV -10% line, with large daily moves seen these past two weeks; oh yeah, I’ll be a big bear once again.
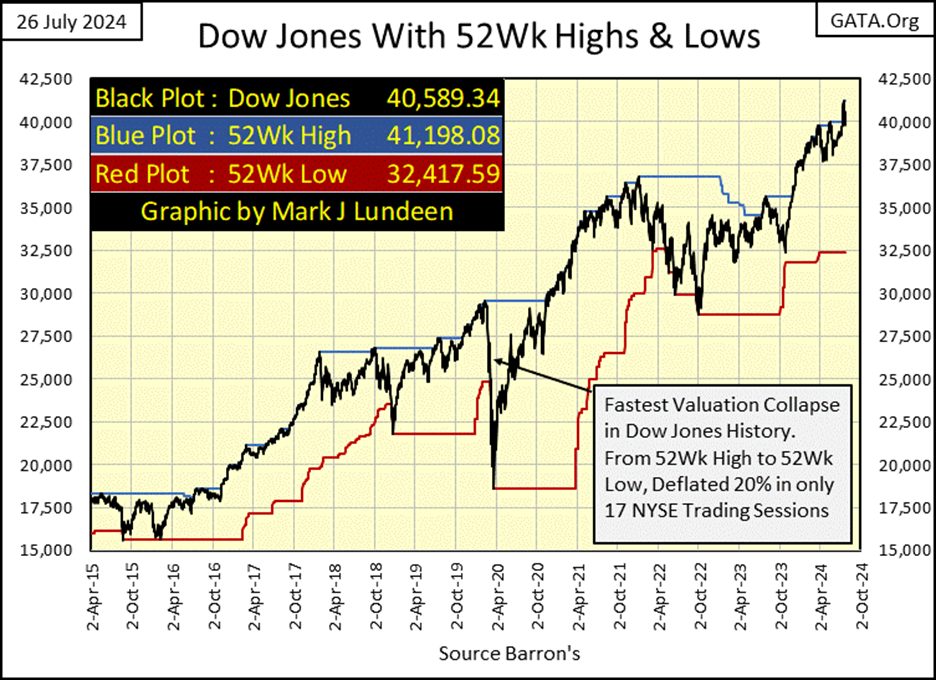
Here is a chart I haven’t published since last winter; the Dow Jones with its 52Wk High and Low lines. The last time the Dow Jones pushed down on its 52Wk Low line was in October 2022. But since last November, it has pushed its 52Wk High line to well over 40,000.
To once again push down on its 52Wk Low line, at this week’s close, the Dow Jones would have to close below 32,417.59, a decline of 21.31% from its last all-time high.
Such a decline could be a correction in a bull market. But this bull market began in August 1982, when the Dow Jones last closed below 800. In the following forty-two years, the Dow Jones has advanced over 40,000 points, thanks to the tsunami of “liquidity” flowing from the Federal Reserve System, making this market advance, one I really don’t like.
Currently, I’m content just watching the market from my vantage point high above, in the market’s peanut gallery. I feel no need to make any prediction for this or that, or when said this or that is to happen.
However, there is no shortage of potential domestic and global events that could have a massive impact on the stock and bond markets. In the years to come, could the Dow Jones advance to something above 50,000? Sure, why not? It’s not as if one day, the FOMC will run out of “liquidity” to “inject” into the market.
I’m just keeping it in mind, these massive gains are only the result of a massive bubble being inflated into the market, and with every inflationary boom, comes its deflationary bust.
So, for you bulls out there, have fun for as long as the Dow Jones remains above its BEV -5% line, or above 39,138 in dollar terms. Should (when) it closes below that, or maybe its BEV -7% level (38,300), I’d get the hell out of Dodge City, and sell everything that wasn’t a precious metals asset. Doing this would get an investor out within 10% of the top of a major bull market, a market feat only a few investors accomplish, something one could boast about for years to come.
So, how did the week go for the other major market indexes I follow below? Looking at their BEV values, the market was down this week, with only one new all-time high on Friday, for the NASDAQ Insurance Index, this week’s #1.
The NASDAQ Banking Index maybe at #20 in the table below, but it’s moving up smartly towards its last all-time high, closing the week only 18.32% from it.
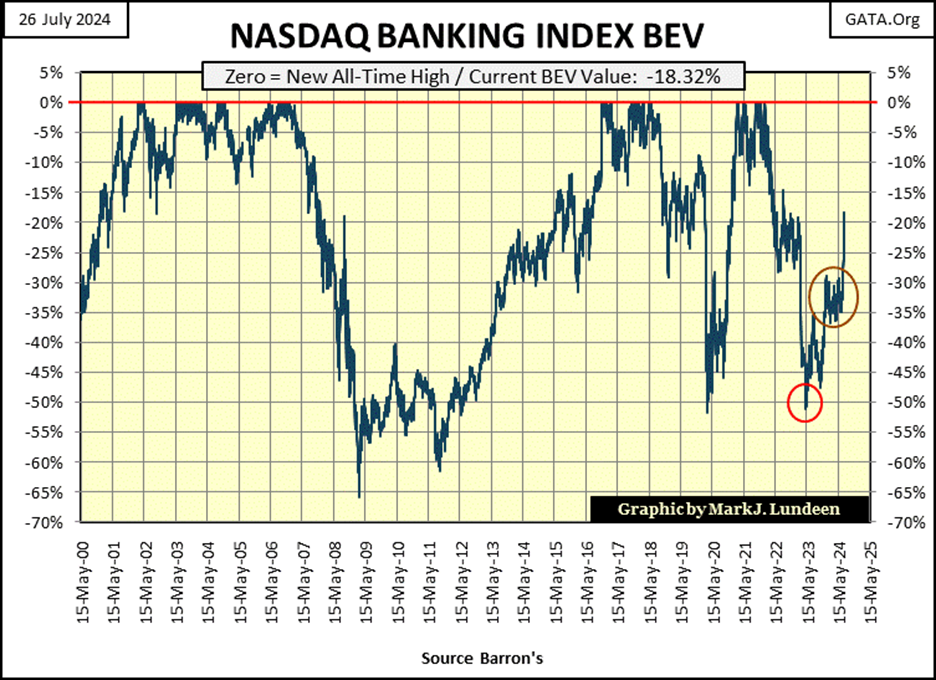
A year ago, in May 2023, these banks had a BEV in the -50%. They had lost half of their valuation from their last all-time high of November 2021. The problem was rising bond yields drove bond valuations down – a lot. Some banks had runs on their deposits, which they couldn’t cover as their reserves invested in the bond market had been greatly reduced.
So, why is the NASDAQ Banking Index now advancing off its lows of May 2023? Are bond yields once again declining, bond valuations once again advancing? Not really, so I don’t know what is going on here. I do know this; accounting standards from decades ago have been lowered. This is especially so following the 2007-09 Sub-Prime Mortgage Debacle.
If the accounting standards from the 1950s were once again imposed on the financial system, how many banks could keep their doors open? I suspect not many, if any could. Not that anyone important in finance, or in “market regulation” in 2024 would care about that. With banking stocks’ valuations now rising so nicely, why should they?
Mark, why should you care about the banking stocks?
The banks are important. When the banks are in trouble, everything else is too, except maybe gold and silver bullion. But it’s a market psychology thing for me. When I think it’s a bear-market bottom, I’m looking for reasons to buy, and continue looking for reasons to buy during the bull market advance. But at bull-market tops, I begin looking for reasons to sell, and can be very petty with my faults on the market; finding faults where I can, seeking reasons to get out, and stay out of the market.
Being prudent, investors can exit the market too early, leaving them to stand aside as they watch the market go higher. But better out to early, leaving with your profits, than out to late, exiting the market with nothing to show for it, but your losses taken.
I think this is a market top. That part of the market cycle where risks are maximum, and the rewards for assuming those risks minimum. So, don’t expect much in the way of positive opinions on the stock market from me. Now for precious metal assets, they are far from a market top. So, for them, I’m always looking for a reason to buy, and I don’t lose any sleep holding them.
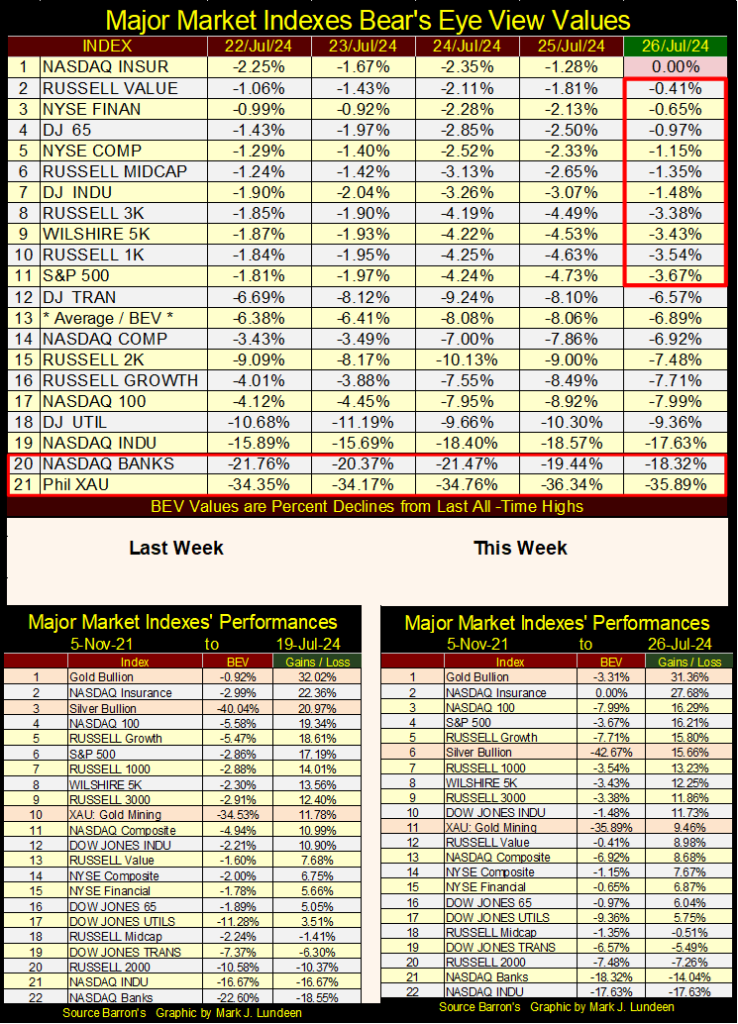
Looking at my performance tables above, gold is holding on to #1, but silver and the XAU slipped down this week in the rankings. And what is with the NASDAQ Insurance Index? Is it going to knock out gold from its #1 position in the weeks to come. If gold doesn’t see a new all-time high anytime soon, that just might happen.
Edmund Burke; Anglo-Irish statesman, political theorist, and conservative philosopher (1729–1797), long ago made the following comment on markets;
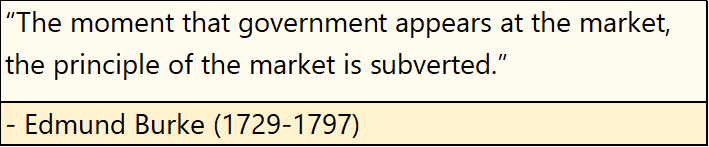
And what is that “principle of the market?” That market prices are set by the give and take of those who bring to the market something they desire to sell, and those who take from the market something they desire to buy, free from any interference from those who neither produce nor consume this something offered in the market, as per Burke: government.
So, is it bad when government comes to the market to purchase something for sale? Not necessarily, if the money the government uses isn’t counterfeited cash from its central bank.
Finance as an industry is hugely influenced (regulated) by “government policy,” as mastery over finance (credit creation) allows “the policy makers” to accomplish amazing things. As noted by Daniel Defoe from the 18th century, a quote I got from Niall Ferguson’s excellent book “Empire.”
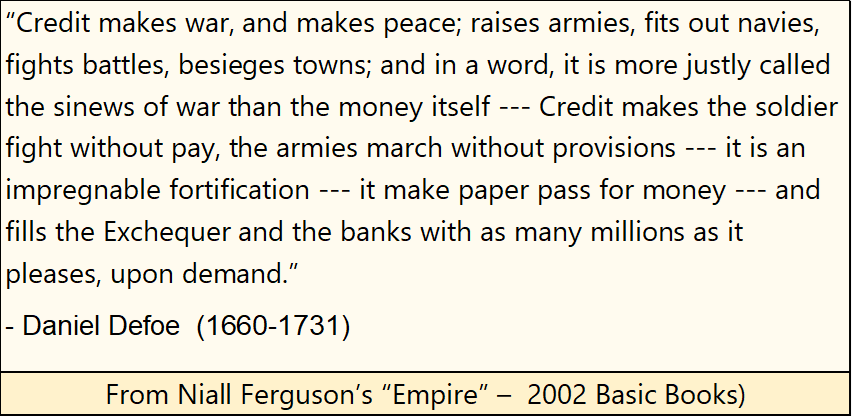
This is why it is often said that money is always the first casualty of war, because to accomplish all the above, it takes a lot of monetary inflation to make the above happen.
It can be argued that much of our current economic, social, and political problems we struggle with today, are the result of the monetary inflation from WWI, which knocked the world off the gold standard over a century ago.
Before WWI, money was gold and silver, and government on a global scale was small, almost invisible to their average citizen. Following WWI, government around the world grew ever larger, and more intrusive into the lives of their citizens, as the paper money issued, and managed by these growing governments only lost purchasing power.
This connection between the growth in government and its wars, and the monetary inflation to fund government’s wasteful ways is an ancient one, going back to Athens of the Peloponnesian War, and Rome during its Empire period.
Following WWII, the United States, and other countries declared war on many things, wars that have dragged on for decades, wars with no end in sight. Endless wars on;
- Poverty,
- Illegal Drugs,
- Homelessness,
- Terrorism,
- Etc, Etc, Etc.
Each of the above wars required massive amounts of credit creation to finance the huge government bureaucracies they created. Bureaucracies that once created, have * ZERO * desire to find solutions to any problem government instituted them to solve.
And why would these government bureaucracies want to solve, whatever problem they were created to eradicate? If they did, there would be no reason to send additional billions-and-billions of dollars to them. Here is the purpose for government post WWI; to spend billions-of-dollars on things its citizens would not, year after year.
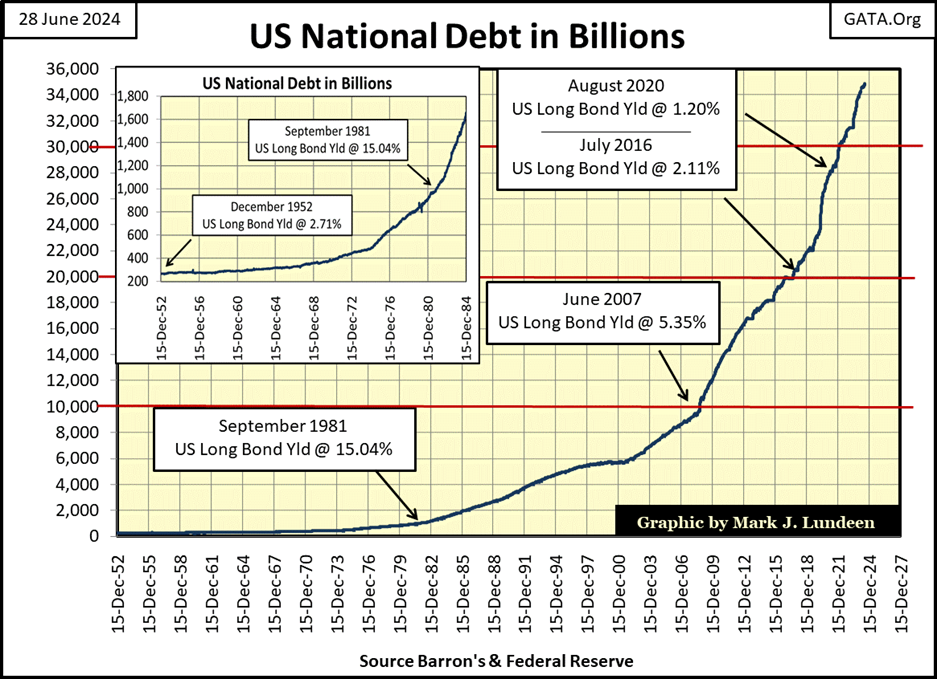
How much of growth in the American national debt seen below, was created to finance these totally inept government bureaucracies? These deep-state bureaucracies have institutionalized each, and every problem they were created to solve.
I don’t know, but I believe much of this fraud, waste, and abuse seen below, was used creating these government bureaucracies, that do little to alleviate society’s problems. In time, I believe people will come to understand that these bureaucracies are the problem, we will soon be struggling with.
The national debt soared to over $34 trillion dollars in early January of this year. In eight months’ time (August 2024), it will be over $35 billion dollars, and certainly over $36 trillion dollars sometime in early 2025.
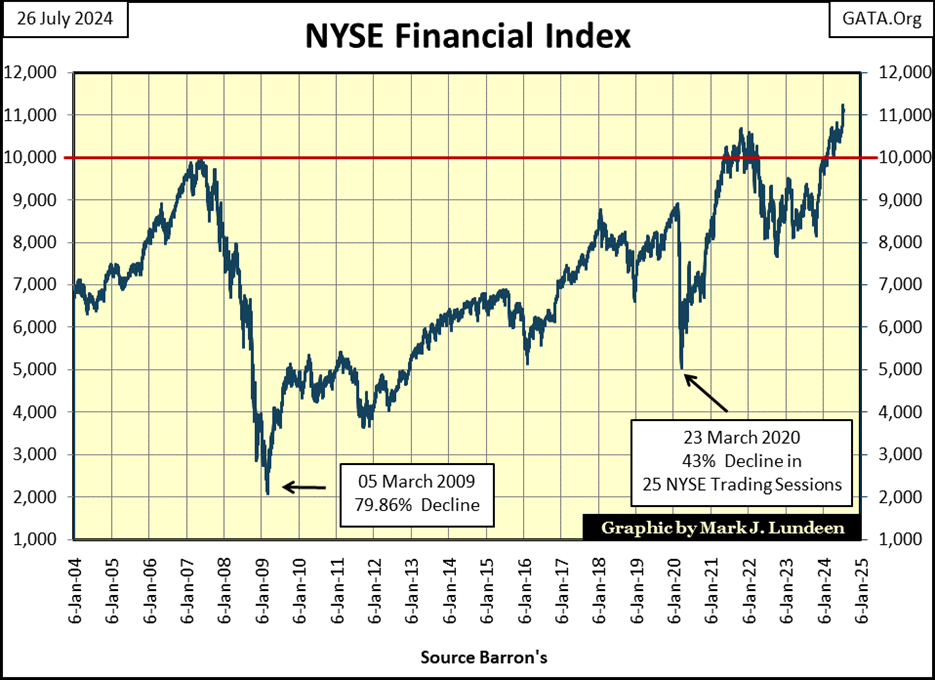
Keeping the above in mind, now let’s look at the NYSE Financial Index, as it is with these companies, that much of the monetary-magic noted above happens.
In the past two years, the NYSE Financial Index’s valuation has finally inflated above its highs of the Sub-Prime Mortgage Fiasco (2002-2007). At the bottom of the following Sub-Prime Bear Market, this index deflated by a whopping 80%, something not seen in finance since the depressing 1930s. This situation was not acceptable to the “policy makers,” who then began “stabilizing market valuations” with FOMC Idiot Primate Bernanke’s three QEs.
In March 2020, during the March-2020 Flash Crash, in a selling panic this financial index deflated by 43% from its highs of the previous month, in only twenty-five NYSE trading sessions. I suspect the NYSE Financial Index would have deflated much more over the next twenty-five NYSE trading sessions, had not in March 2020, FOMC Idiot Primate Powell began his Not QE#4.
This “injection” of trillions-of-dollars of monetary inflation into the market in just a few months, terminated this Flash Crash’s deflation, and drove the NYSE Financial Index to new all-time highs in late 2021.
In early 2022, the idiots at the FOMC began talking about a new QT, to drain some of their “liquidity” from the financial system, the NYSE Financial Index soon began correcting from its recent all-time highs. Though the QT began in May 2022, and continues to this day, the NYSE Financial Index began advancing yet again in late 2023, taking these financial companies to new all-time highs.
Below is the Bear’s Eye View (BEV) of the NYSE Financial Index, looking at the same data seen above, but as Mr Bear sees things; in terms of new all-time highs (BEV Zeros = 0%) and percentage claw-backs from those new all-time highs.
Note the difference between the NYSE Financial Index’s BEV plot from 1996 to 2002, six years of high-tech boom and bust, and from 2002 to 2009, seven years of sub-prime mortgage boom and bust.
During the high-tech boom, the NYSE Financial Index did make BEV Zeros (new all-time highs), but also saw claw-backs of 25% and greater. During the high-tech bust, this financial index was clawed back by Mr Bear by over 30% from its last all-time high. About the same as the deepest correction it saw during high-tech boom.
During the sub-prime mortgage boom, the NYSE Financial Index from 2003 to 2007 saw many more BEV Zeros than it did during the high-tech boom, and every time the index deflated to its BEV -10% line, it soon roared back to new all-time highs. This is what a bubble looks like in a BEV chart; lots of BEV Zeros without a proper correction below its BEV -20% or -25% lines, for a prolonged period.
How extreme the boom in sub-prime mortgages was to these companies, can be seen in the bust that followed the boom. In October 2007, the NYSE Financial Index saw its Terminal Zero (TZ = Last BEV Zero of an advance). For the next eighteen months, the NYSE Financial Index’s valuation deflated by a massive 80%, from this TZ.
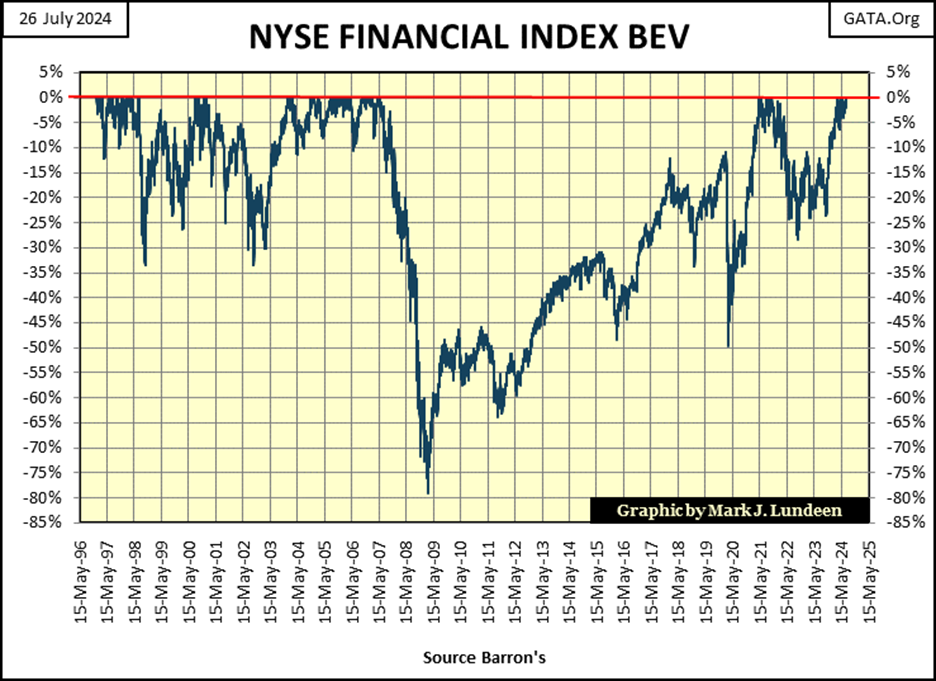
Since March 2009, the NYSE Financial Index has advanced, seeing proper corrections as it has. But this advance was made possible by four QEs implemented by a bunch of idiots at the FOMC. Where it, and the entire stock market would be today without this tsunami of “liquidity” flowing from the FOMC, no one can really say.
In the years to come, I believe Mr Bear has some unfinished business with the NYSE Financial Index, and the stock market as a whole. Seeing BEV values in the major stock market indexes I follow, well below -60% seems to me a distinct possibility.
And how depressing would that be? Hopefully I’ll never know, because I’m in precious metal assets, assets that historically have benefitted from massive deflation in the financial markets. So, let’s move on to my BEV chart on gold.
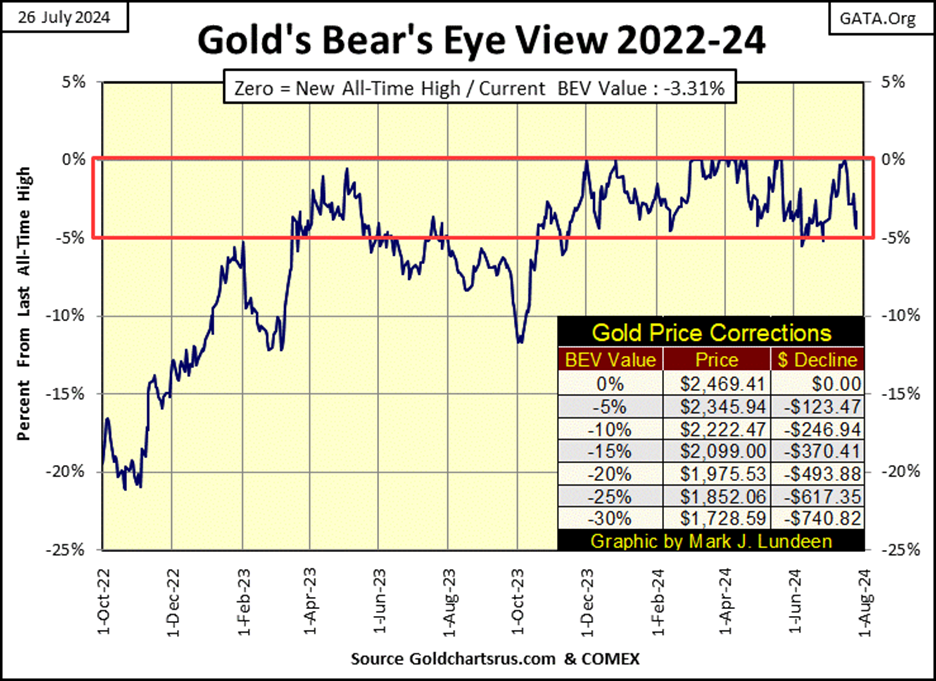
Gold made a new BEV Zero (new all-time high; $2,469) on July 16th, and has gone down since, but not so far as to fall out of scoring position (Red Box). So, I remain bullish on gold. And as market psychology for the precious metals in my mind is that the old monetary metals are far from a historic market top, that part of the market cycle where risks are low, and the potential for rewards for assuming those risks high, even should gold go down, and then below its BEV -20% line ($1,975), I would find that a reason to buy even more, if I could, which sadly I can’t.
As for silver and the mining companies that extract the old monetary metals from the Earth, for the same reasons I like them too.
The big problem with gold, silver and their miners, is one of time. The bull market in precious metal assets isn’t advancing as fast as investors would like them to be. Let it be known that I’m sick of waiting too, but it is what it is – damn it.
Looking at gold’s step sum table below, gold’s 15-count increased to a +7 on July 10th, just days before its last all-time high on July 16th. A 15-count of +7 says the gold market is overbought, and markets don’t like being overbought.
Note the number of down days in the gold market soon increased, bringing the gold’s market’s 15-count down to a +1 at the close of this week. The price of gold since its last all-time high is down about $100, and on Thursday, saw its BEV decline to -4.36%, not far from closing outside of scoring position.
We may see additional selling in the weeks to come, possibly taking gold’s 15-count into negative territory, and its BEV below scoring position. But in the give and take of the market, soon the overwhelming down days that followed gold’s +7 count seen below, will be followed by a period where advancing days will overwhelm declining days. Will the bulls then take gold to a new all-time high? I’m thinking that, and we’ll soon see if I’m right.
One factor that would really help that happen; seeing gold close at new all-time highs, would be seeing golds’ daily volatility’s 200D M/A begin advancing towards 1.00%. But so far in 2024, gold’s days of extreme volatility, days where gold moves up (or down) by 3%, or more from a previous day’s closing price, is only 1, as seen in the chart below.
This chart of annual extreme days in the gold market makes clear the difference between the 1969 – 1980 bull market, and our current bull market that began in 2002. The bull market from five decades ago was an exciting bull market, with huge daily swings in the price of gold, both up and down, daily moves in excess of 3% from a previous day’s closing price.
Since this bull market began in 2002, volatility, and excitement in the gold market has been greatly muted. Why would that be? I take it that Edmund Burke had it exactly right when he said;

To see gold and silver soar higher in a huge bull market, is not in the favor of the government that demonetized them. The government that replaced the old monetary metals with paper, and digital money that very predictably, is rapidly becoming worthless.
This dearth in gold’s 3% days since 2002, seen below, indicates the government and its “regulators,” have been very successful in keeping a lid on any excitement in the precious metals market, intent on keeping money now circulating on Wall Street, far from the gold and silver market.
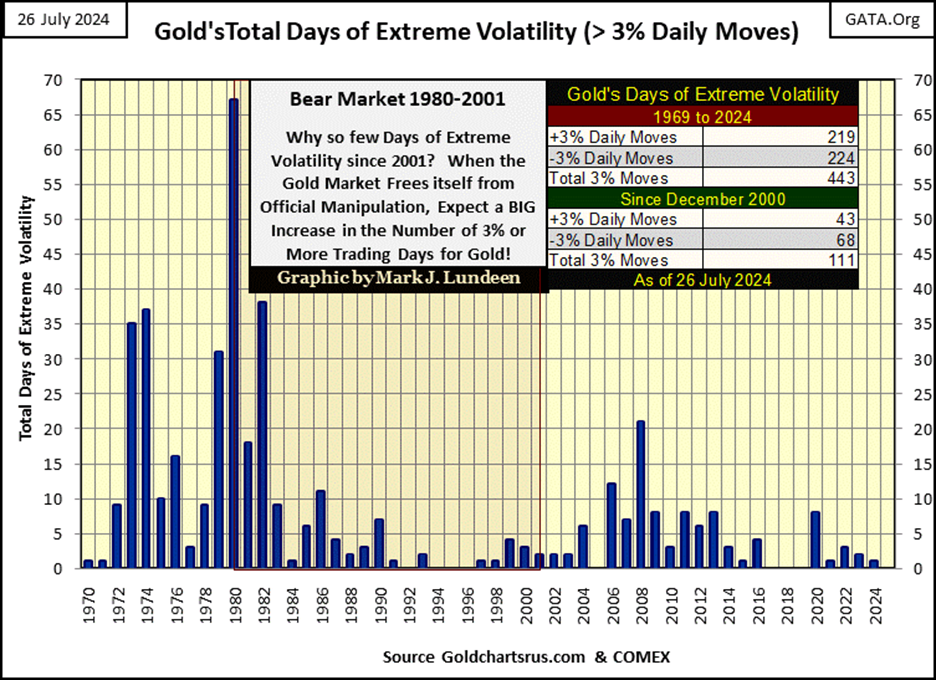
When gold and silver finally break free from their “market regulators” grasps, I predict we’ll see a spike in 3% days in gold, similar to what can be seen above during the 1970s. With gold’s 3% days total for 2024 so far only 1, I’m thinking so far in 2024, that hasn’t happened yet.
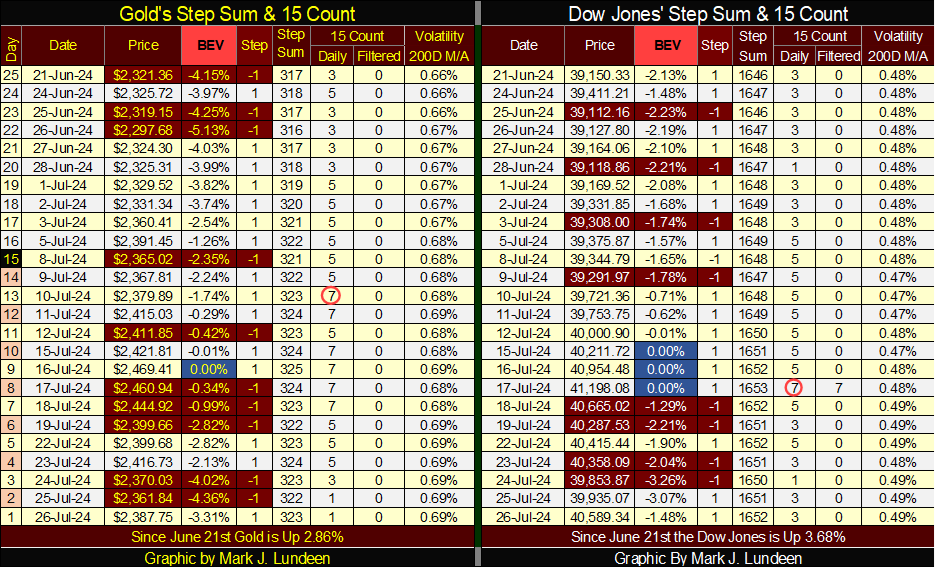
Like gold, the Dow Jones also saw a 15-count of +7, making the Dow Jones an overbought market, or for one day it was. Since then, the NYSE saw seven trading sessions, with four of these sessions taking the Dow Jones down, and only three of them advancing the Dow Jones. But the week still closed with the Dow Jones’ BEV of -1.48%. We’ve not seen the last Dow Jones all-time high of this advance just yet.
__
(Featured image by Alexander Grey via Unsplash)
DISCLAIMER: This article was written by a third party contributor and does not reflect the opinion of Born2Invest, its management, staff or its associates. Please review our disclaimer for more information.
This article may include forward-looking statements. These forward-looking statements generally are identified by the words “believe,” “project,” “estimate,” “become,” “plan,” “will,” and similar expressions, including with regards to potential earnings in the Empire Flippers affiliate program. These forward-looking statements involve known and unknown risks as well as uncertainties, including those discussed in the following cautionary statements and elsewhere in this article and on this site. Although the Company may believe that its expectations are based on reasonable assumptions, the actual results that the Company may achieve may differ materially from any forward-looking statements, which reflect the opinions of the management of the Company only as of the date hereof. Additionally, please make sure to read these important disclosures.


The TopRanked.io Weekly Digest: What’s Hot in Affiliate Marketing [++ KuCoin Affiliate Program Review]
X now allows people to block certain topics from their feed. This week, we're going to tell you how to...


Hotel Stay Project Supports Wildlife Conservation in Japan
Iwate Prefecture launched a project linking hotel stays to conservation through Morioka Zoological Park Zoomo. A themed room at Yunomori...


Bitcoin Leads Modest Crypto Rebound Amid Mixed Signals
Bitcoin rose 2 percent to above 77000 as ETFs saw 15 million inflows and April gains of 12.2 percent. Ethereum...


Major Pharma Advances: EU Approvals, Vaccine Progress, and Breakthrough Clinical Results
Johnson & Johnson has EU approval for nipocalimab for generalized myasthenia gravis, showing superior control and sustained benefits. Sanofi reported...


Agential Cannabis 2026 to Drive APAC Market Growth and Global Industry Collaboration
Agential Cannabis 2026 will take place September 23–24 in Bangkok, bringing global experts together to advance the APAC medical cannabis...
 |
|
 |  |
 |
|
-

 Crypto4 days ago
Germany’s Crypto Tax Rules and Bitcoin Outlook Shape Investor Strategy
-
 Business2 weeks ago
The TopRanked.io Weekly Digest: What’s Hot in Affiliate Marketing [Monetizing AI Agents 2.0]
-
 Cannabis1 day ago
Agential Cannabis 2026 to Drive APAC Market Growth and Global Industry Collaboration
-

 Africa1 week ago
Record State Funding Strengthens Support for Moroccan Associations in 2024