Featured
Has the stock market topped?
This past week the S&P 500 and the NASDAQ both made new record highs then reversed and closed lower making an outside trading week. Key reversal? Also seen on a number of the high tech stocks that led the market up. Verification is needed so direction in the coming week or two is important. September is the cruellest month with bottoms coming in October/November.

The current stock market keeps reminding us of that old blues song. The question is, what kind of train is it? Unstoppable (2010) or Runaway Train (1985)? Or maybe it is just like Silver Streak (1976) or The Taking of Pelham One Two Three (1974). But maybe the best one is Snowpiercer (2013). Snowpiercer is a sci-fi film based on a French graphic novel from Korean director Bong Joon-ho. The film depicts the last remnants of humanity hurtling around the earth like a snowball express, after an attempt at climate engineering to stop global warming has disastrously failed. The passengers of the train are all segregated with the poor (Main Street) in squalid tail compartments controlled by armed guards (police) while the elite (Wall Street) live in extravagant front cars in the lap of luxury. No surprise: the poor revolt and overpower the guards. Eventually, they reach the front. Hopefully, none of this turns into Train to Busan (2016).
It is not that we are expecting revolts to break out, but the reality is that a pandemic, combined with rising inequality and a steep recession (depression?), has opened up fissures in society that could easily lead to civil wars, revolts, and wars. Sharply rising stock markets don’t price these events in until usually it is too late. The current U.S. election is a case in point. Despite the election taking place against the background of the U.S. at its most divided since the Civil War of 1861–1865, the stock market appears to be almost oblivious to what is going on.
While battles rage on the streets and garner all the attention, there are other battles going on in the courts that may be more important and play a huge role in what happens before and after the election. According to an article in The Economist (“The Supreme Court may tip the 2020 elections”—August 31, 2020), the raft of lawsuits before the election is hitting record proportions. Currently, there are 226 separate lawsuits across 43 states. Most involve Democratic moves to expand voting opportunities vs. Republican efforts to quash or suppress voting opportunities. More people voting helps the Democrats while fewer people voting helps the Republicans. The two sides are also locked in a nasty battle as to how the Post Office is going to handle a deluge of ballots sent by mail.
All of this is occurring against the backdrop of recently appointed Postmaster General, Louis DeJoy who has set in motion changes to the United States Postal Service (USPS) that have resulted in huge backlogs of mail. With an upcoming election in the midst of a pandemic, many fear that mail-in ballots won’t reach their destination on time, if at all, resulting in the disenfranchisement of potentially millions.
None of this bodes well for the election where, if the Republicans lose, they are already setting up cries of fraud because of the mail-in ballots and if the Democrats lose, they could also cry fraud because of the mail not getting through and millions of ballots not counted. Again, The Economist has weighed in on the dispute (“America’s Ugly Election”—September 3, 2020). Both sides are lined with a bevy of lawyers (estimated at around 600 per side) to potentially contest the election results. The election may not be decided on November 3, 2020 and may not even be decided by January 20, 2021, inauguration day.
What could go wrong? Given the potential for millions of mail-in ballots there could be unsigned ballots, non-postmarked ballots, ballots mailed without postage, ballots not delivered by the USPS. It could be a mess, particularly in battleground states. Both sides are also potentially poised for violence that could lead to clashes both before, during, and after the election. A heavily Conservative leaning Supreme Court could, as they did in the 2000 election Bush vs. Gore, side with the Republicans, if things reach that far. Yet the stock market appears to take it all in stride.
There are signs that the market could become a mania not dissimilar to what we saw in 1995–2000 with the dot.com/high-tech bubble. Easy money through record ultra-low interest rates, coupled with trillions of dollars through direct liquidity injections into the financial system and bond-buying programs directly by the Federal Reserve, keep Wall Street flush with cash. The funds, as they have before, are not finding their way into the economy (Main Street) but instead are going into the stock market. A sharply rising stock market attracts more funds, particularly international funds fleeing problems elsewhere. The NASDAQ, along with the S&P 500 and the Wilshire 5000, have all soared to new all-time highs. But could other indices soon join them? Falling stock markets are not friendly to incumbent presidents. The Fed and others might try to do what it takes to keep the stock markets rising.
In our August 31, 2020 Technical Scoop, we mused in our “chart of the week” as to whether the stock market led by the NASDAQ could enter a mania phase. There was some evidence that we have already entered the phase as the NASDAQ had broken out into a channel last seen during the 1995-2000 mania phase. What was missing was a test of the break line similar to what was seen in 1998 during the Russian default/LTCM 20% decline. However, what if the March 2020 coronavirus panic was the setup for a mania phase instead?
We have often noted that while the NASDAQ, S&P 500, and Wilshire 5000, along with a few other select indices have soared into record territory, notably the Dow Jones Industrials (DJI) and Dow Jones Transportations (DJT) have not. However, both indices have soared past the point that might suggest that they too could soon enter record territory. No, this is not saying they will, but instead that they could. Interesting that on the 91st anniversary of the top in 1929 (September 3) the stock markets fell. The NASDAQ made its top on September 2 before falling on September 3. Only time will tell as to whether the market regroups and makes another assault on the highs, or whether a more serious correction will set in as many have expected. We now muse, is this a correction similar to what we saw in June 2020 or the setup to a crash into October, as we saw in March 2020.
The Fed has made historic changes to its monetary policy framework when it adopted an “average inflation targeting”. While the Fed’s aim is still 2%, the way they have changed their approach suggests that they have actually raised their inflation outlook. Currently, inflation has been running below 2% with core inflation (less food and energy) last at 1.56% (July 2020).
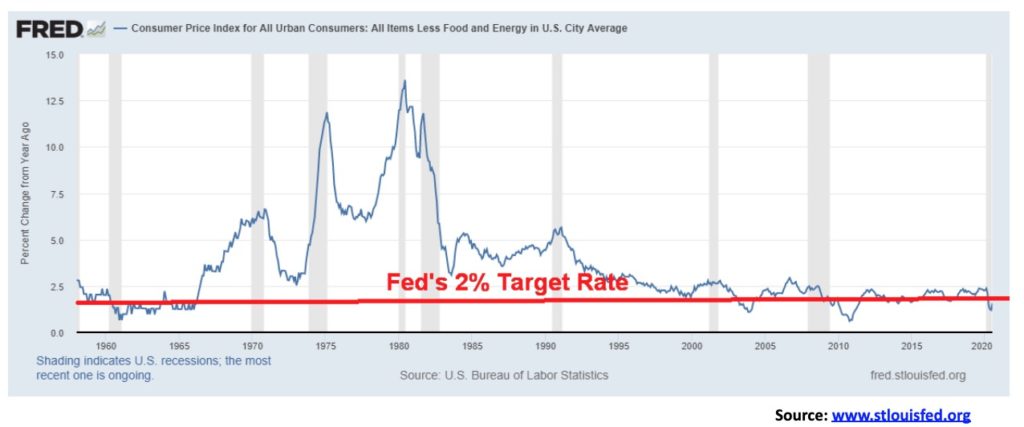
The trouble is the Fed has little or no intention of allowing interest rates to rise any time soon. Nominal interest rates will remain near zero. With the core inflation rate last at 1.56% it is noteworthy that the 10-year U.S. treasury note is currently at 0.72%, giving us a negative yield of 0.84%. Savers continue to be punished. All this implies is that the Fed may allow inflation to rise and they would do little to stop it unless, of course, labour market conditions tightened to the point that they were forced to hike interest rates. The market may instead do it for them, but that implies that the long bond yields would have to rise if inflation were to rise.
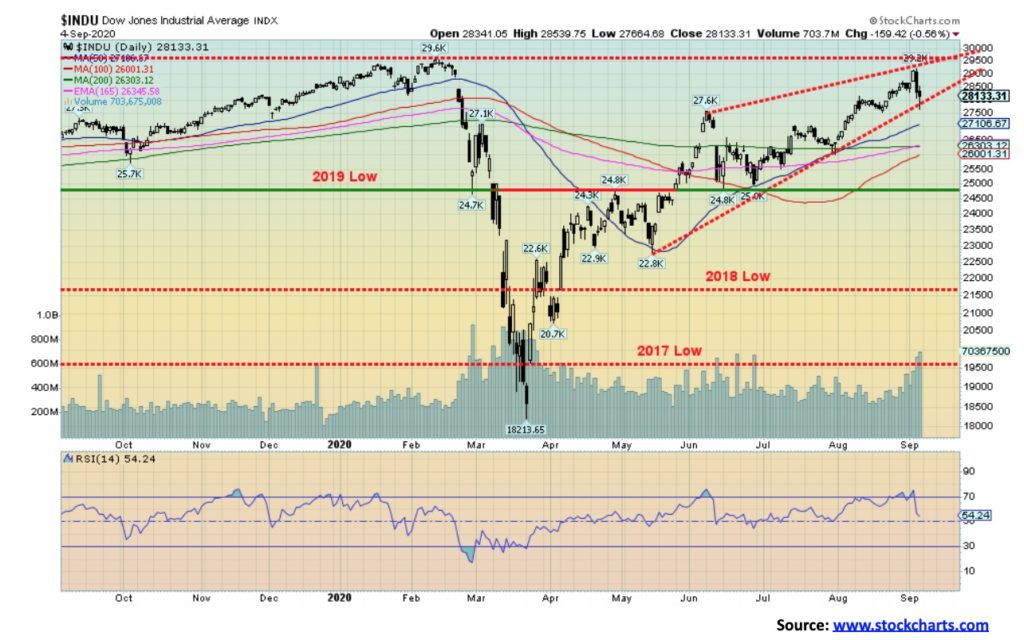
With a higher inflation outlook, this favours real assets (i.e., equities, gold, commodities, etc.) and would make holding bonds unfavourable (short-term maturities excepted). The question that is on our mind is, does the stock market rally further now into the election or do we have the pullback that many have expected. The initial breakdown point for the DJI is at 28,000. That was penetrated briefly during Friday’s plunge. Long-term support appears to be down at 25,000 as our chart of the DJI below shows. The DJI could now be forming an ascending wedge triangle, but how it plays out is too early to tell. Resistance is at the former high near 29,600.
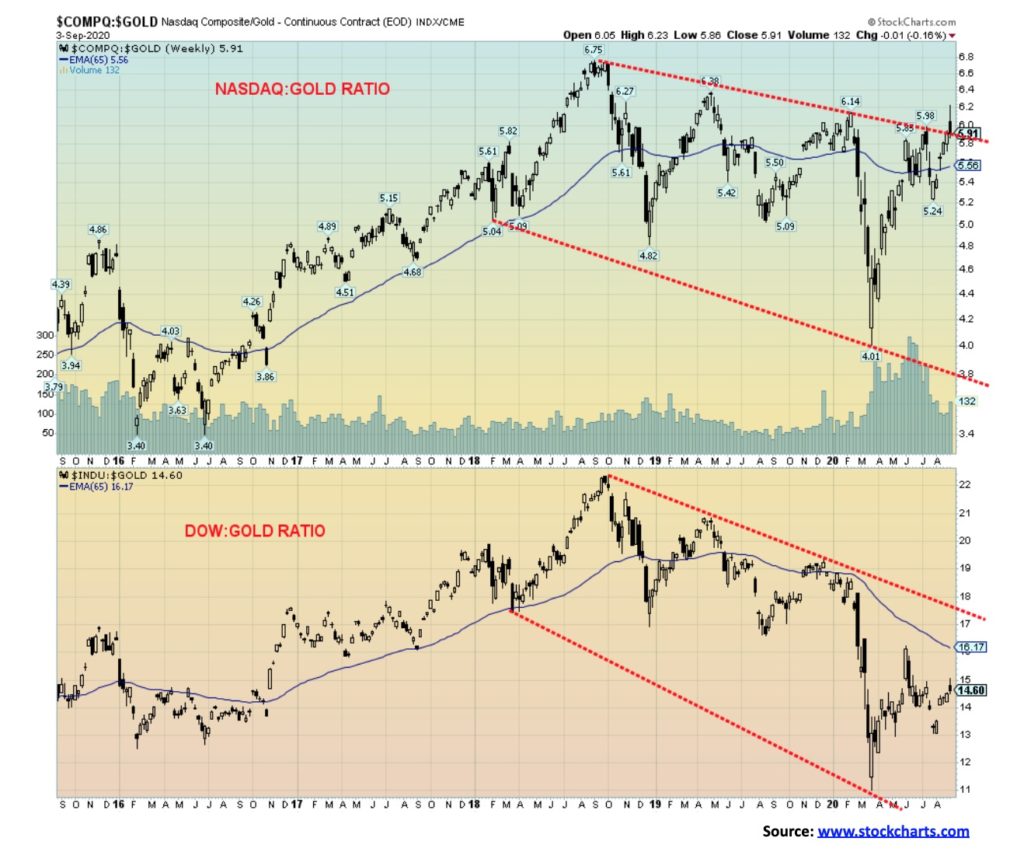
When one looks at equities vs. gold, one discovers that the shift is already on for gold. Our dual chart below shows both the NASDAQ/Gold ratio and the more common DJI/Gold ratio. Both are in clear downtrends favouring gold since topping back in September 2018. However, the down channel is volatile and the swings are considerable. Most recently, the climb from the depths of the March 2020 crash has favoured equities over gold despite gold’s rise to $2,000/ounce. This is particularly true of the NASDAQ since the March low as the ratio rose from 4 to 6 in favour of the NASDAQ. The all-time high for the NASDAQ/Gold ratio was seen in 2000 at 17.8 and for the DJI/Gold ratio the high was at 44.5 back in August 1999. These were multi-year generational highs for equities. Since then, gold has solidly outperformed both the NASDAQ and the DJI with a rise of 571% since 2000 compared to the NASDAQ up 182% and the DJI up 147%. Gold did underperform during the period 2012–2018.
There has been a lot of hype in this market. Interesting that we have seen considerable ads and articles pointing to September 8, 2020, the day that Apple is to announce its 5G phones. Somehow this is supposed to drive Apple to double or even triple from current levels and drag the rest of the market with it to new heights. However, the hype seems misplaced as 5G will merely replace 4G. As some pundits have pointed out is this a classic “buy the rumour; sell the news” situation.
An unstoppable train? Or an impending train wreck?
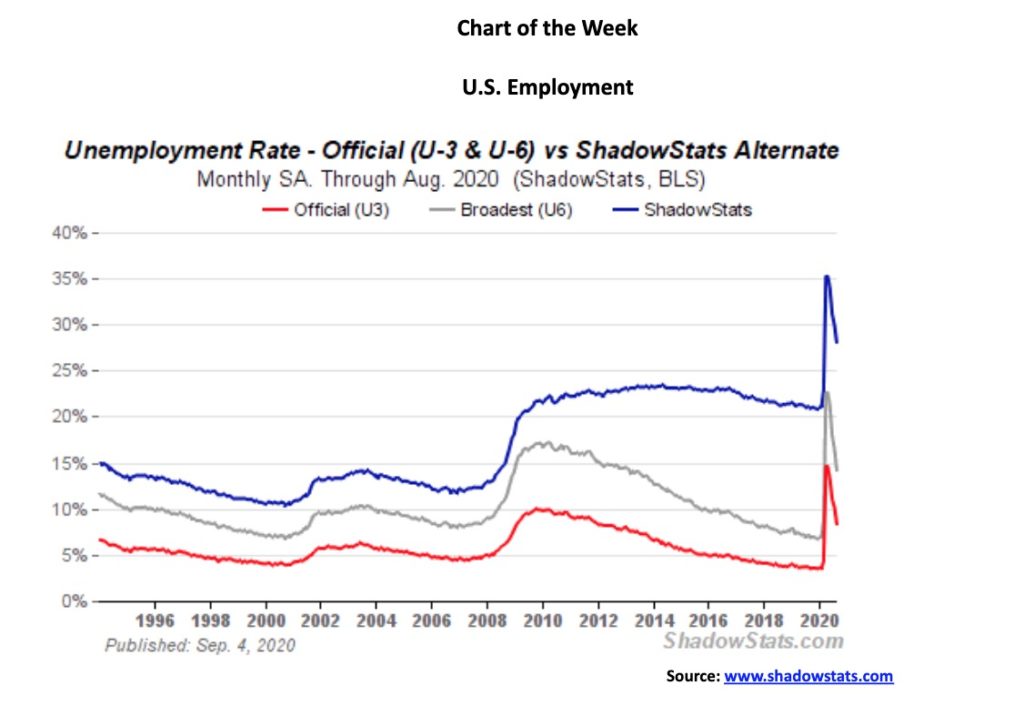
The U.S. economy added 1.37 million jobs in August, slightly below expectations of 1.4 million. The increase included 238 thousand temporary census jobs. The unemployment rate (U3) fell more than expected to 8.4%, down from 10.2% in July. The peak was 14.7% in April. The U.S. lost 22.16 million jobs in March and April. The U.S. is still 11.5 million jobs short of recouping that. Economic forecasts had suggested that the unemployment rate would fall to only 9.8%, so the drop to 8.4% was a bit of a surprise. The labour force participation rate rose to 61.7%, up from 61.4% in July. The employment population ratio rose to 56.5% from 55.1%. The low was at 51.3%. But that is still well short of the pre-pandemic level of 61.2%.
The U6 unemployment rate, the Bureau of Labour Statisitics’ broadest measurement of unemployment (that is U3 plus short-term discouraged workers under one year and marginally employed workers plus those working part-time who want full time) fell to 14.2% from 16.5%. U6 peaked at 22.8%. The Shadow Stats (www.shadowstats.com) unemployment number (that is the U6 plus long-term discouraged workers over one year plus those defined out of existence in 1994) fell to 28.0% from 30.0%. Again, the peak was in April at 35.4%. For the record, the pre-pandemic levels were U3 3.5%, U6 7.0%, and Shadow Stats 21.1%.
Those defined as not in the labour force was at 100.7 million vs. 101.5 million. Before the pandemic, that number was 95.1 million. There are roughly 7 million not in the labour force who want jobs vs. 7.7 million in July. There were 4.8 million back in February. Of those not in the labour force 55.1 million are retired and 9.8 million are disabled. The remainder are those choosing not to work or students. There are officially 35.8 million defined as living in poverty, 28.3 million who have no health insurance, and 44.2 million on food stamps. At the other end, there are listed 18.2 million millionaires in the U.S. and 614 on the Forbes list of billionaires.
Are these troubling numbers? The number of permanent job losers in the U.S. rose roughly 500 thousand in August to 3.4 million. Many are on temporary layoff, but could that become permanent? While this is below the levels seen during the 2007–2009 recession, it is the worst level since 2013. The labour force has contracted as its size is 160.8 million vs. 164.5 million pre-pandemic. The number of job losses could rise as a number of companies have announced layoffs that will soon take effect. Amongst those are airline companies (American Airlines, United Airlines) and others such as Ford Motor and Bed Bath & Beyond. Extensions to unemployment benefits are coming, but they will be lower ($300 vs. $400/week) and fewer will be elgible. There is already rising homelessness in the U.S. and here in Canada as well, as tent towns spring up. Overall, there are an estimated 26.7 million unemployed, although the official number of those unemployed is only 16.2 million. The total number employed is 147.3 million vs. 143.5 million in July. Pre-pandemic that number was 158.8 million. There are an estimated 14 million more unemployed than there are job vacancies and that number could be even higher. Hardest hit groups for unemployment are (no surprise) young people aged 15–24, and minorities: Blacks, Asians, and Hispanics.
The best gains in employment were in the government with the aforementioned census workers. Retail trade and business services also saw gains. Leisure and hospitality continues to be weak.
Initial claims this past week dropped to 881 thousand from 1,191 thousand the previous week. The market had expected 950 thousand. However, the Labour Department changed the methodology for seasonal adjustments, so it automatically lowered it more than expected. The trouble is, they didn’t go back and restate earlier numbers so comparing it with previous reports is rather meaningless. Still, even that number is higher than any seen during the Great Recession 2007–2009. Shadow Stats has calculated that if they hadn’t revised it the actual number would have been at least 130,000 higher.
It’s an improved report, but it is still pretty bad. The stock market added to its previous day losses because of the report.
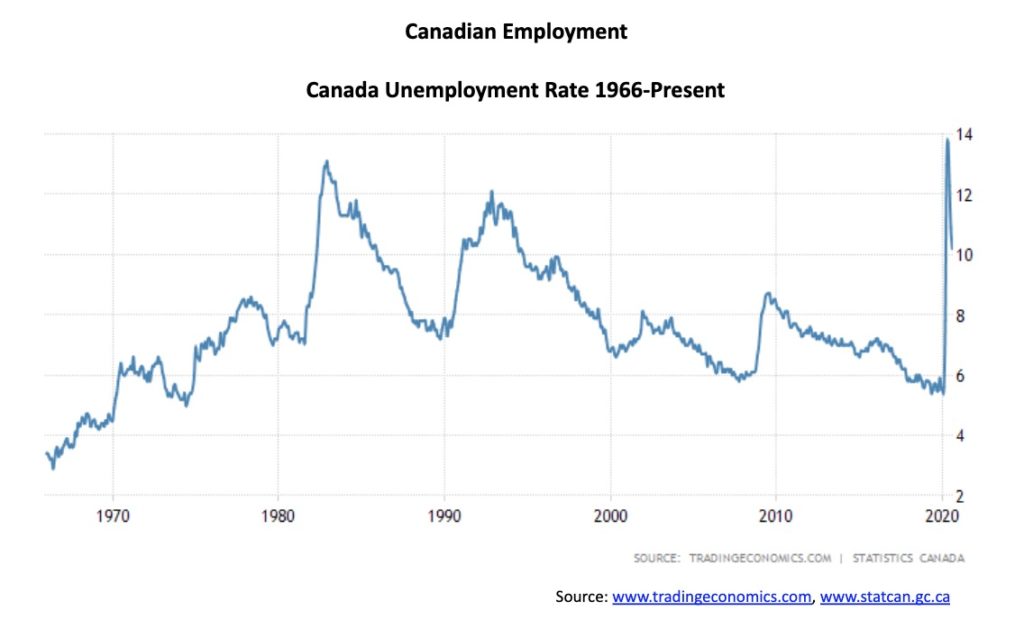
Canada added 245,800 jobs in August 2020 vs. an expectation of 275,00 and an addition of 419,000 in July. In March and April Canada lost 3,004.5 thousand jobs. According to statistics, they have now recouped 1,865.0 thousand jobs, leaving Canada still short 1,139.5 thousand (38%) of the original jobs lost. The official unemployment rate fell to 10.2% from 10.9%. However, if one includes discouraged job searchers plus involuntary part-timers (R8), the rate rises to 14.5% vs. 15.6% in July. At the peak, that rate reached 18.2%. The unemployment rate remains high, initially surpassing the peak seen during the early 1980s recession. When one looks at the total number of Canadians impacted by the economic shutdown, the number reaches 1.8 million. However, that is down from 5.5 million in April when there 3 million unemployed and 2.5 million just temporarily laid off.
Of the jobs that were added, 205.8 thousand were full-time and 40 thousand were part-time. The labour force participation rate was 64.6% vs. 64.3% and 65.5% in February before the rise in unemployment got underway. But it is well up from the 59.8% rate in April. Back in April some 3.4 million Canadians found themselves working from home. That number has now fallen to 2.5 million. The ones most impacted by the rise in unemployment were women and youth aged 15–24. As well, visible minorities have been more negatively impacted by the rise in unemployment. Unemployment rates for select groups include Arabs 17.9%, Blacks 17.6%, and South Asians 16.6%.
Full-time employment now stands at 93.9% of pre-pandemic levels while part-time employment is at 96.1%. When one adds in the number of people who want to work but who did not look for work in August because of the lack of available jobs, the unemployment rate rises to 13.0% from 10.2%. That’s down from the 13.8% in July 2020. Employment growth has been best in the service sector vs. the goods-producing sector. As well, employment growth in accommodation, food services, and retail trade remains slow. But employment in educational services has jumped substantially as back to school gets underway. There has also been growth in personal services (beauty salons, etc.).
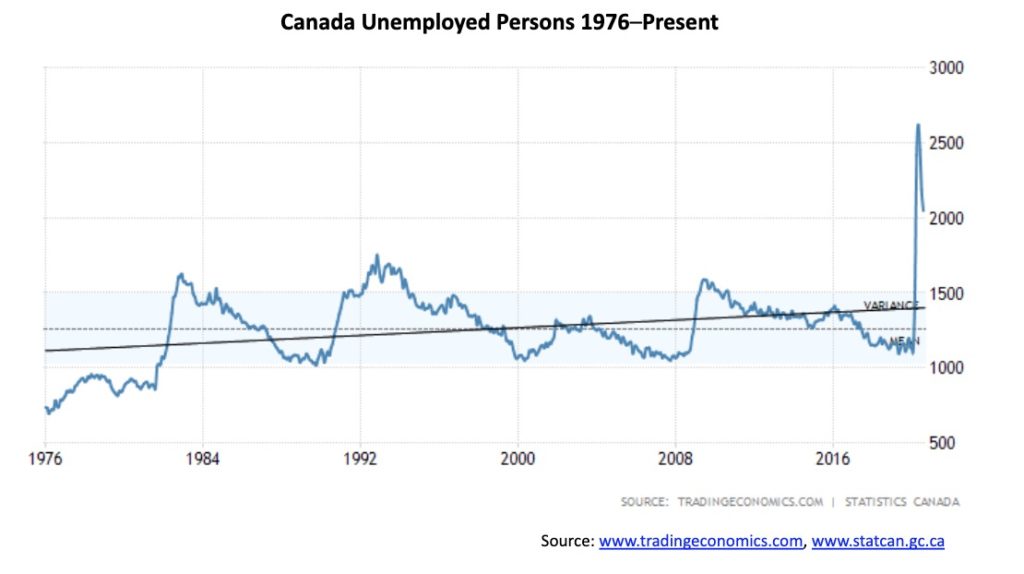
The largest gains in employment have been in Ontario and Quebec, with Alberta and New Brunswick lagging. The Alberta unemployment rate fell only because fewer people were looking for work as the oil and gas industry has been hit hard. Employment levels for low-wage earners and youth, especially males, lag badly from pre-pandemic levels. Summer students had a very hard go of it this past summer; however, many are returning to school. The total number of persons unemployed in Canada stands at 2,046.9 thousand vs. 2,183.6 in July. That remains in record territory, even surpassing the highest levels seen during the early 1990s recession and the financial crisis recession of 2007–2009.
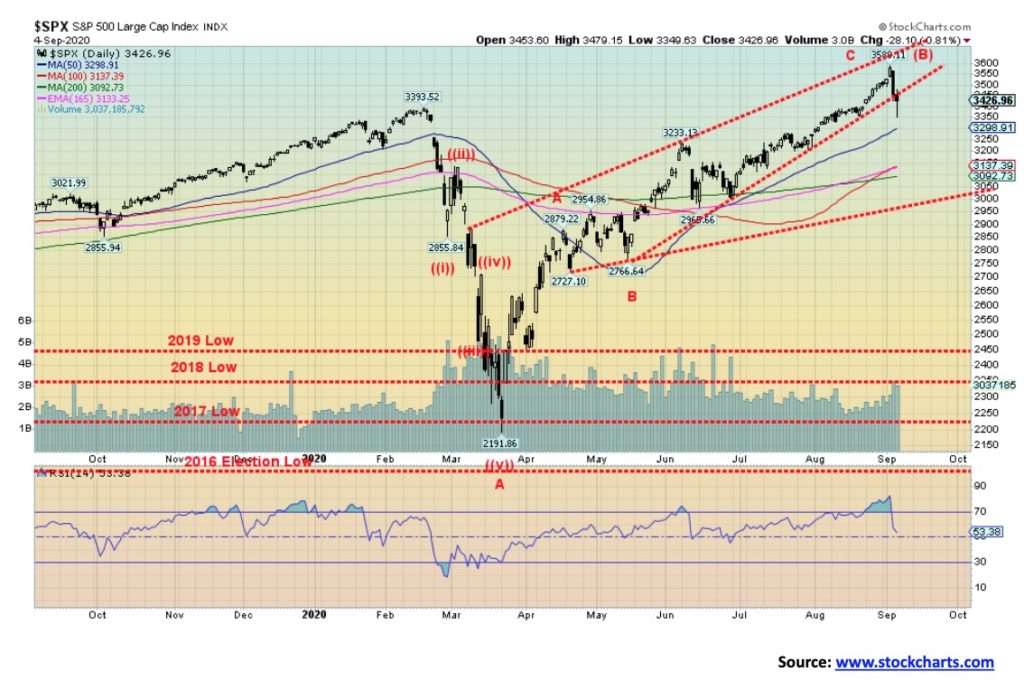
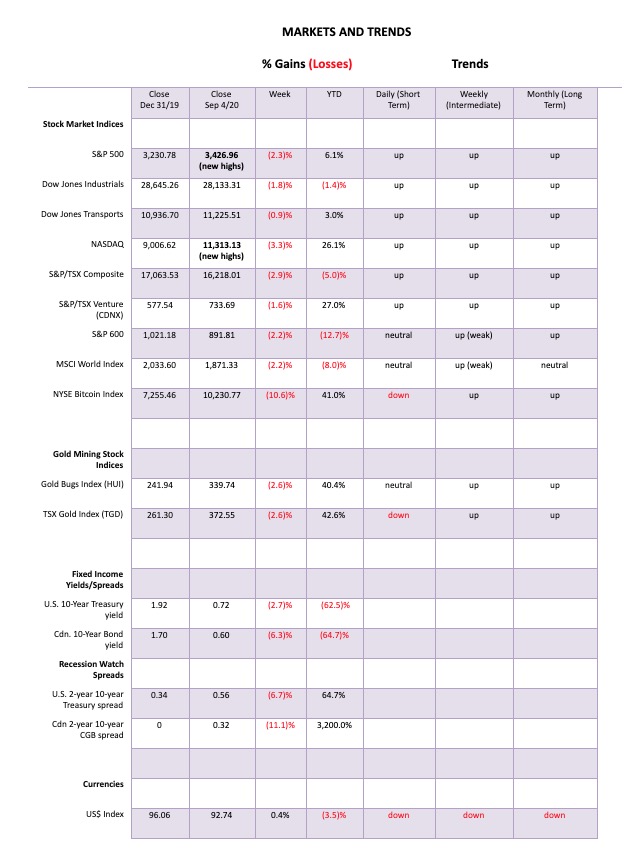
Is the party over? That is the question that will now be on everyone’s mind, given the outside week reversal (possible key reversal) this past week. The S&P 500 made new all-time highs on September 2, then reversed and closed the week lower, down 2.3%. The catalysts were many, including Fed Chair Powell’s musings on inflation, some stronger than expected economic numbers, particularly in manufacturing, and some weaker than expected job numbers. And, as we have noted, things are heating up on the election front and maybe the stock market is beginning to pay attention to the divisiveness.
Everyone lost this past week. The NASDAQ also made new all-time highs, then reversed, closing lower, off 3.3%; the Dow Jones Industrials (DJI) did not make new all-time highs but was down 1.8%; the Dow Jones Transportations (DJT) dropped 0.9%; and the S&P 600 small cap index lost 2.2%. The equal weight S&P 500 dropped 1.3%. In Canada, the TSX was down 2.9% and the TSX Venture Exchange (CDNX) was off 1.6%. In the EU, the London FTSE fell 2.8%, the Paris CAC 40 was down 0.8%, and the German DAX down 1.5%. In Asia, China’s Shanghai Index (SSEC) fell 1.4% but the Tokyo Nikkei Dow (TKN) bucked the trend and gained 1.4%. Could Japan be a safe haven? Or was it helped by Warren Buffet’s Berkshire Hathaway investing in Japanese stocks? Maybe a bit of both?
We couldn’t help but notice that the high this past week was made on September 2 and 3 which was the 91st anniversary of the 1929 high. Could history repeat itself? But the big crash didn’t come until the end of October—starting October 24 and ending on October 29 with the DJI down 25% alone on October 28 (Black Monday) and October 29. Ironically, this is just before the November 3 election. There was no election in 1929. We’ll be watching for any crash setup going forward.
Right now, the question on our mind is, the party really over or is this just a temporary pullback? Certainly, the indicators were high and they were diverging. RSI had been over 70 since August 21, peaking on September 2 over 80. The uptrend line from the May low was broken, but the uptrend line from the March low is below at around 3,000. That level is the major line in the sand. If that level were to fall, then the odds favour a test of the March low or even new lows. The point of no return is under 2,500. We couldn’t help but notice that the DJI had an important low in May 1929, then rose almost 30% into the September top. The S&P 500 made an important low in May 2020, then rose about 30% into the September top. Coincidence?
There is support down to around 3,200, but below that level a drop to 3,000 most likely is underway. New highs could change all of this. But, given the backdrop of the most divisive election in U.S. history, the odds are beginning to shift to a September/October swoon. September is the cruelest month and the bottoms usually come in October/November.
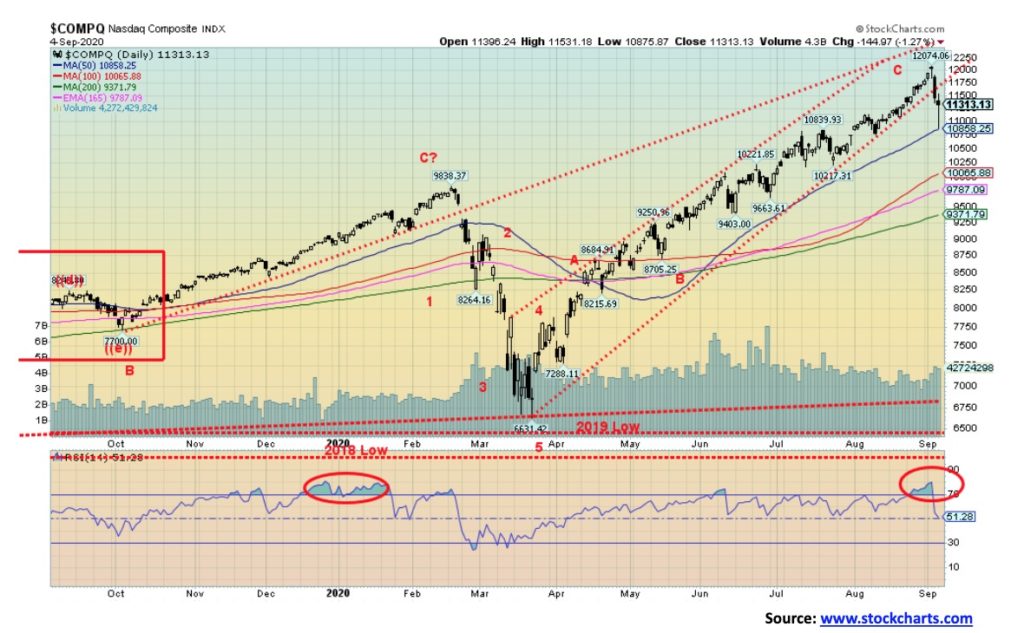
The NASDAQ put in one of its worst weeks since the pandemic panic in March 2020. This past week the NASDAQ made new all-time highs, then reversed, putting in an outside week reversal and closing lower, losing 3.3%. The high-tech stocks that had been leading the market to nirvana suffered the same fate, making new all-time highs, then reversing and closing lower on the week. Could all of these be key reversals? New all-time highs were seen for Apple down 3.1% on the week, Amazon down 3.2%, Google down 3.3%, and Microsoft down 6.4%. Tesla also made new all-time highs, then reversed and closed lower, off 5.5%. Only Facebook down 3.7% and Netflix down 1.5% failed to make new all-time highs. The old staid Berkshire Hathaway was flat on the week.
The NASDAQ has broken its uptrend line from the March low. We note Friday’s low bounced off the 50-day MA and closed down only 1.3% on the day. That is not unusual following the first good break. What’s key is what happens this coming week. A firm break of 10,860 should send the NASDAQ down to the next level near 9,800–10,000. The 200-day MA is just under 9,400 and that should also act as support. We note how the RSI that had held above 70 for two weeks at the end of August has not broken and is currently at a more neutral 51. This has provided support since early April, so breaking under 50 would be a negative sign, suggesting further losses. The NASDAQ almost doubled from the March 2020 low, so a correction is overdue. The only question on our mind is, will this be a shallow correction of, say, up to 20% or a steep one over 30%? The NASDAQ fell almost 33% during the March pandemic panic.
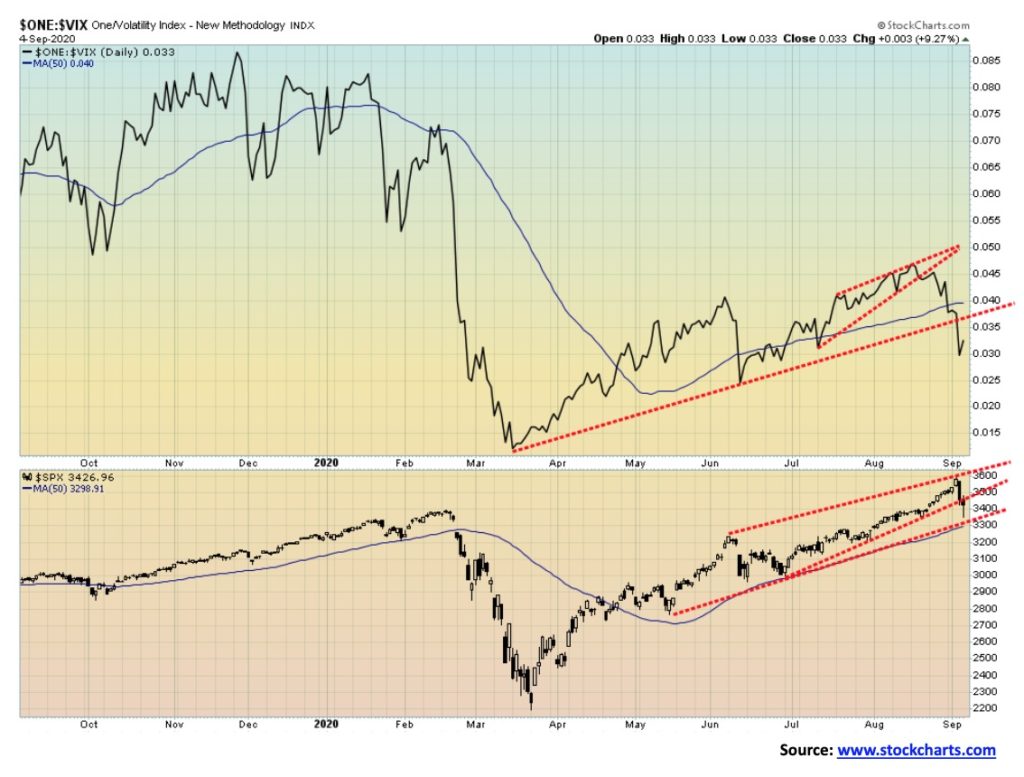
It is no surprise that with the decline this past week volatility picked up. Our inverse VIX volatility indicator fell along with the market. We note that at the end the two were beginning to diverge. The VIX topped on August 17 while the S&P 500 waited until September 2 to top. The VIX has now broken its uptrend line and has also fallen under its 50-day MA. The S&P 500 remains above the 50-day MA. Could the S&P 500 soon break the 50-day MA as well? We note that didn’t happen in June when the VIX broke its 50-day MA but the S&P 500 held firm and did not break. Both broke down in March 2020. Indeed, the S&P 500 was making new highs even as the VIX was making lower highs, a divergence that suggested that a decline could soon be coming. It did. Note the VIX topped way back in November 2019 but the S&P 500 did not make its final high until February 2020. These types of divergences are not unusual at significant tops (or bottoms either—note that the VIX bottomed March 16 while S&P 500 didn’t bottom until March 23 as the VIX made a higher low).
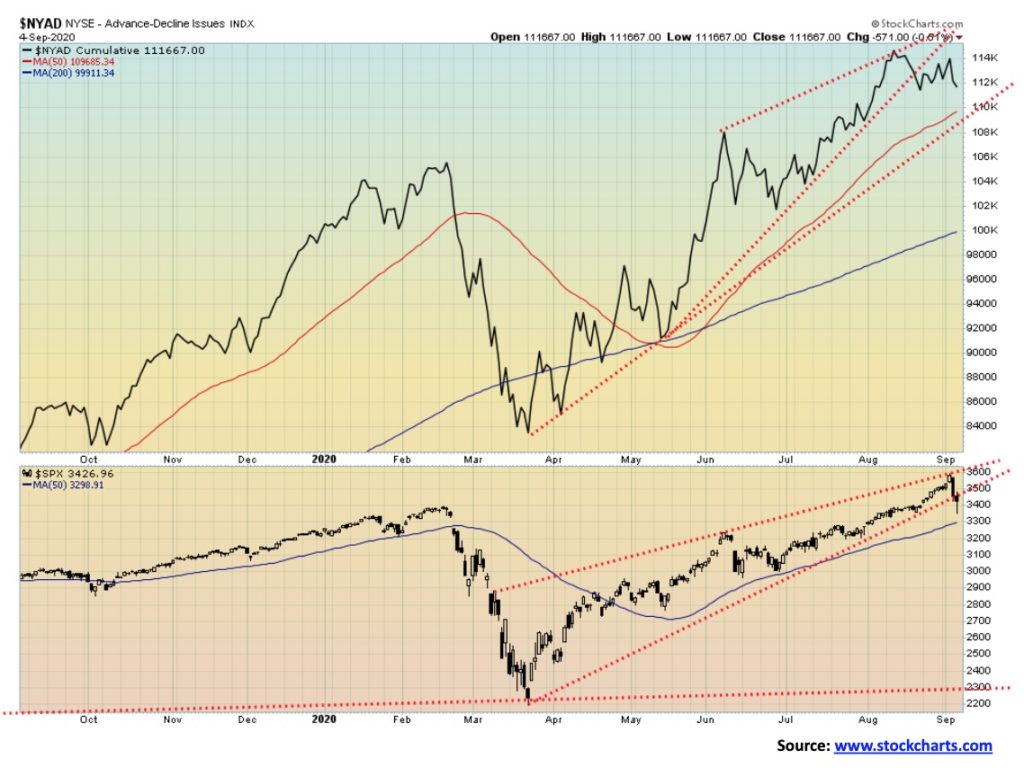
Back in mid-August the NYSE advance/decline line began to break its uptrend even as the S&P 500 continued higher. We noted the potential divergence. This week, the S&P 500 broke its uptrend line and the AD line continued its recent decline. The two appear to be back in sync again, only this time they are pointed down, not up. The AD line peaked August 12 while the S&P 500 waited to peak on September 2. The AD line could next be establishing a downtrend. But we note key support for both just below. For the S&P 500 support is visible near 3,000 and for the AD line near 109,690.
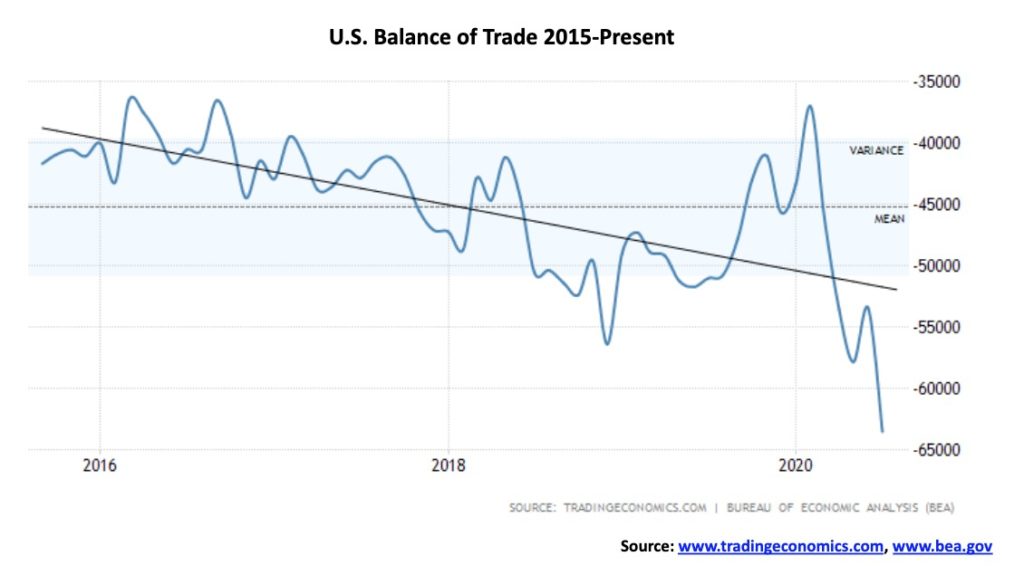
Well, this isn’t going in the right direction. The U.S. trade deficit for July widened by $10.1 billion to $63.6 billion. This is starting to approach some of the worst levels seen back in the first decade of the 2000s. And it can’t all be blamed on China. The record low was $68.3 billion in August 2006. Apparently, there were surging imports of vehicles from Canada amongst the reasons. The U.S. already hits Canada over softwood lumber and aluminum. Canada wins at the WTO but the U.S. ignores it. That ought to receive the wrath of someone and Canada could have another target. It is putting the annualized trade deficit on track for $1.086 trillion. That in turn would have a negative impact on the Q3 GDP by lowering it.
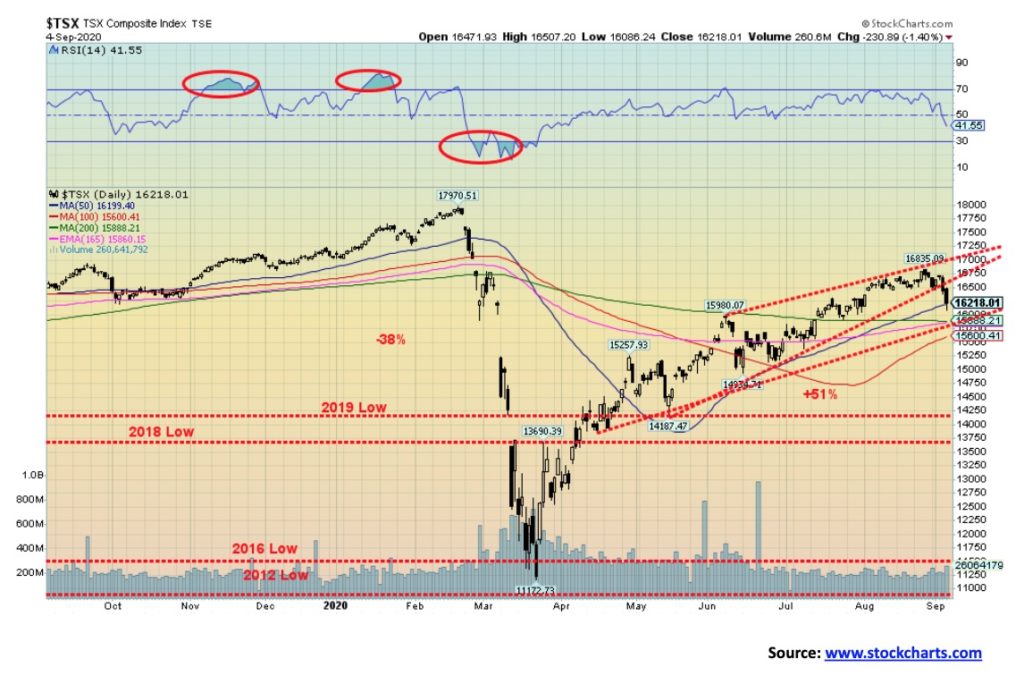
As with the U.S. indices, is the party over for the TSX? It wasn’t a good week. The TSX fell 2.9%, breaking what appears to be an ascending wedge triangle (bearish). The bearish implications are only for a drop to around 15,000. A firm break under that level and especially under 14,900, then under 14,200 could set up a test of the March lows. The TSX had gained about 51% from the March lows, recouping over 83% of the February/March decline. That was suggesting to us that there was a good chance we could see new all-time highs above 17,970. That could still happen despite the drop this past week. But first we would have to regain the recent high at 16,835. A firm breakdown under 15,800 could spell the end of the bull run. Below that level we believe the odds of new highs are slim at this time and the focus would shift to the downside.
Nobody was spared this past week. The TSX Venture Exchange (CDNX) fell 1.6%, outperforming the TSX. All 14 sub-indices were down on the week, led by the TSX Energy Index (TEN) down 5.4%. Other big losers were Information Technology (TKK) down 4.3%, Financials (TFS) off 3.0%, and Health Care (THX) down 3.8%. Given the heavy weight of energy and financials in the TSX, it is no surprise the TSX itself lost almost 3%. But when we survey the damage, we note that only six sub-indices out of 14 are up on the year and two of them just barely. The two barely up are Consumer Staples (TCS) +2% and Industrials (TIN) +2.3%. Firmly up are our picks as the best places to be in 2020; namely Golds (TGD) +42.6%, Metals (TGM) +19.5%, Materials (TMT) +25.5%, and Info Tech (TKK) +38.5%. We expect those four to remain firm through the end of the year.
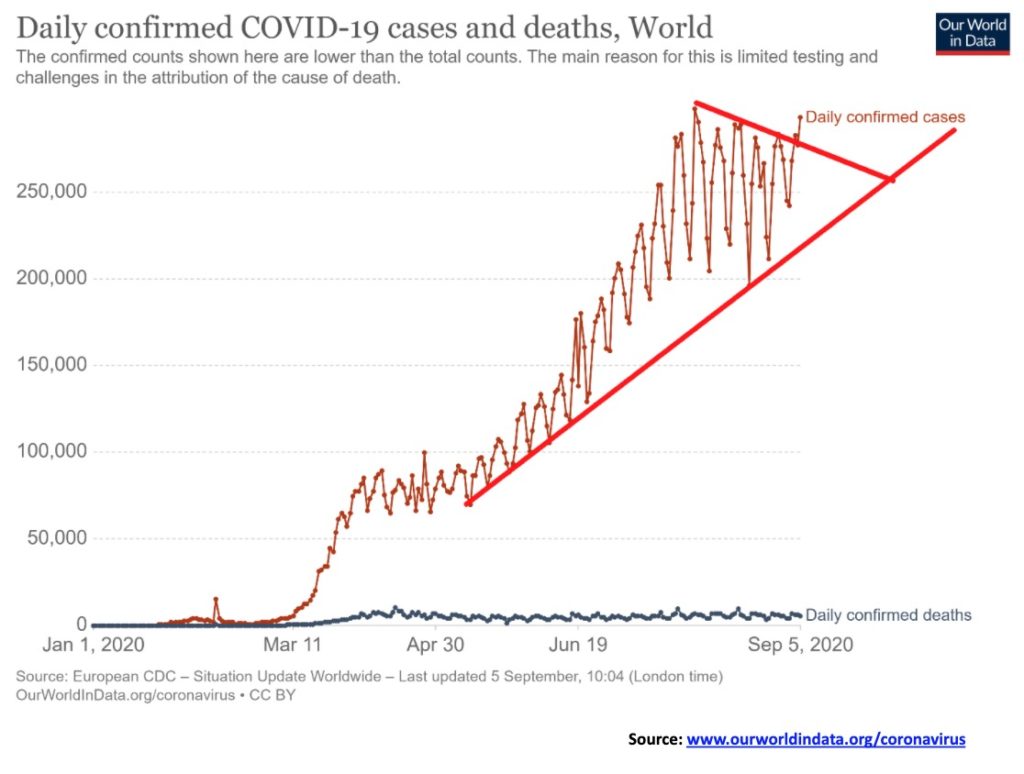
Are we breaking out for global cases of the coronavirus? Appears it might be. September 5 saw the number of cases surge to over 290 thousand. The high remains at 298 thousand. The U.S. still leads but it is now India that is surging. India will soon surpass Brazil for number 2. Both have over 4 million cases. The U.S. still leads in deaths with over 190 thousand representing roughly 3% of the cases. Globally the death rate has remained relatively steady at around 3.3% although it can vary from country to country. Still the world records roughly 5 thousand or more deaths every day and now in excess of 275 thousand cases daily. Notice how the recent pullback held the uptrend line from April. Support zones are even meaningful for the coronavirus.
Sunday September 6, 2020 8:09 GMT
# Cases: 27,079,037
# Deaths: 883,934
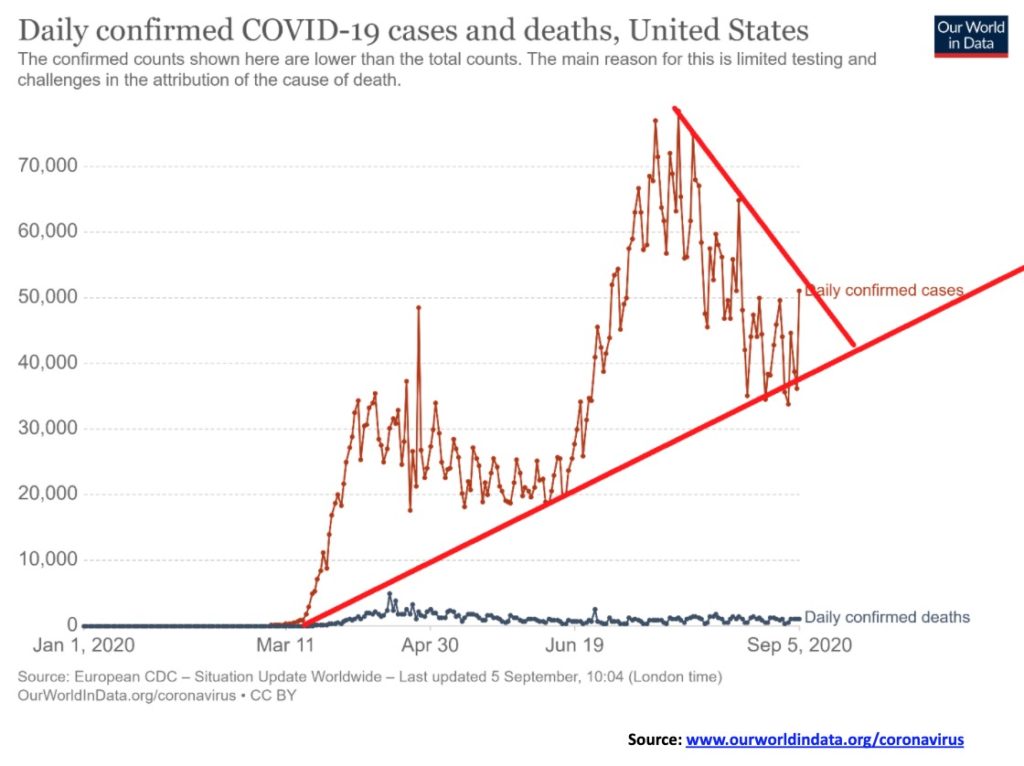
Are the number of daily cases in the U.S. threatening to breakout to the upside from the recent downtrend? With constant talk of a second wave into the fall anything is possible. The U.S .has been in a downtrend recently for cases falling from over 70 thousand daily to the 30 thousand to 50 thousand range. A break out over 50 thousand daily could set the U.S. on a new upward course. Deaths remain steady with roughly 1,000 or more daily. California leads with cases but New York leads in deaths. The number of cases and deaths in New York has been on a downward trajectory. Once the leader in cases New York has now fallen to fourth behind California, Texas and Florida.
Sunday September 6, 2020 8:09 GMT
# Cases: 6,431,160
# Deaths: 192,820
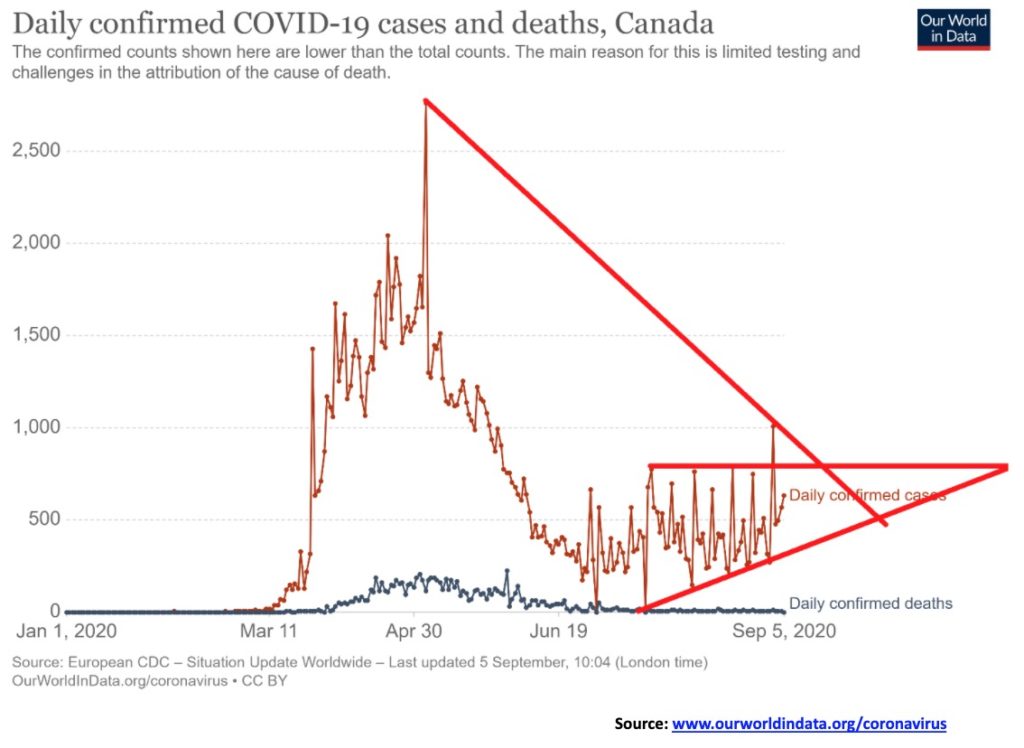
Canada like the world and the U.S. could be on the verge of breaking higher in number of cases. Canada sits at number 25 in the world with over 130,000 cases to date and over 9 thousand deaths. It’s number of daily cases has been creeping higher from roughly 300 to 500. However, active cases have fallen sharply and the number of deaths is low with under 10 daily. Canada’s deaths per number of cases is higher than the global average at almost 7%. While Canada sits at number 25 in terms of cases, they are number 18 in terms of deaths.
Sunday September 6, 2020 8:09 GMT
# Cases: 131,495
# Deaths: 9,143
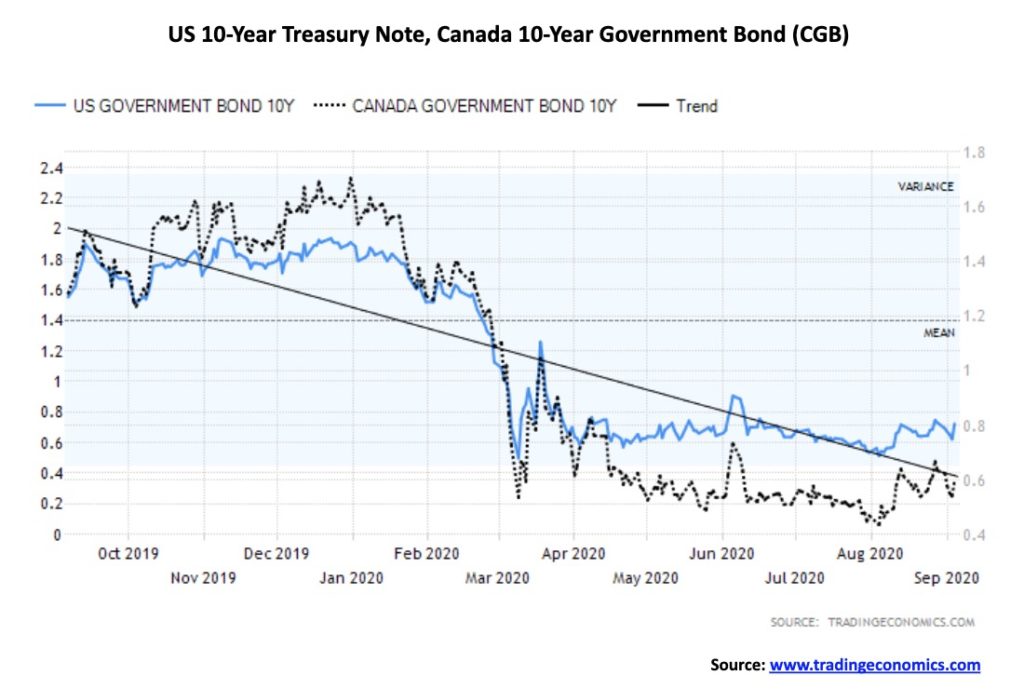
The bond markets remained largely unchanged this past week with yields falling slightly. Yields fell, then following the job numbers on Friday they popped back up a little. The yield on the 10-year U.S. treasury note slipped slightly to 0.72% from 0.74 on the week. The Canadian 10-year Government of Canada bond (CGB) dropped to 0.6% from 0.64%. Spreads were largely unchanged on the week. We could argue that the 10-years shown above are begging to base. That raises the potential for rising rates at some later date. However, we know that even if inflation were to tick up, putting some upward pressure on bond yields, the short rates will remain unchanged. Neither the Fed nor the BofC are poised to raise interest rates any time soon. The Fed has indicated that they could stay low for years. But longer dates are more market driven rather than controlled by the central banks. So they could rise. Right now, there is little sign that they are about to rise, but we do note that yields last bottomed in early August and since then there has been a slight upward tick. The U.S. 10-year would need to break firmly above 0.80% and especially over 1.00% to suggest higher while the CGB needs to break out over 0.70%. A floor for both may be forming.
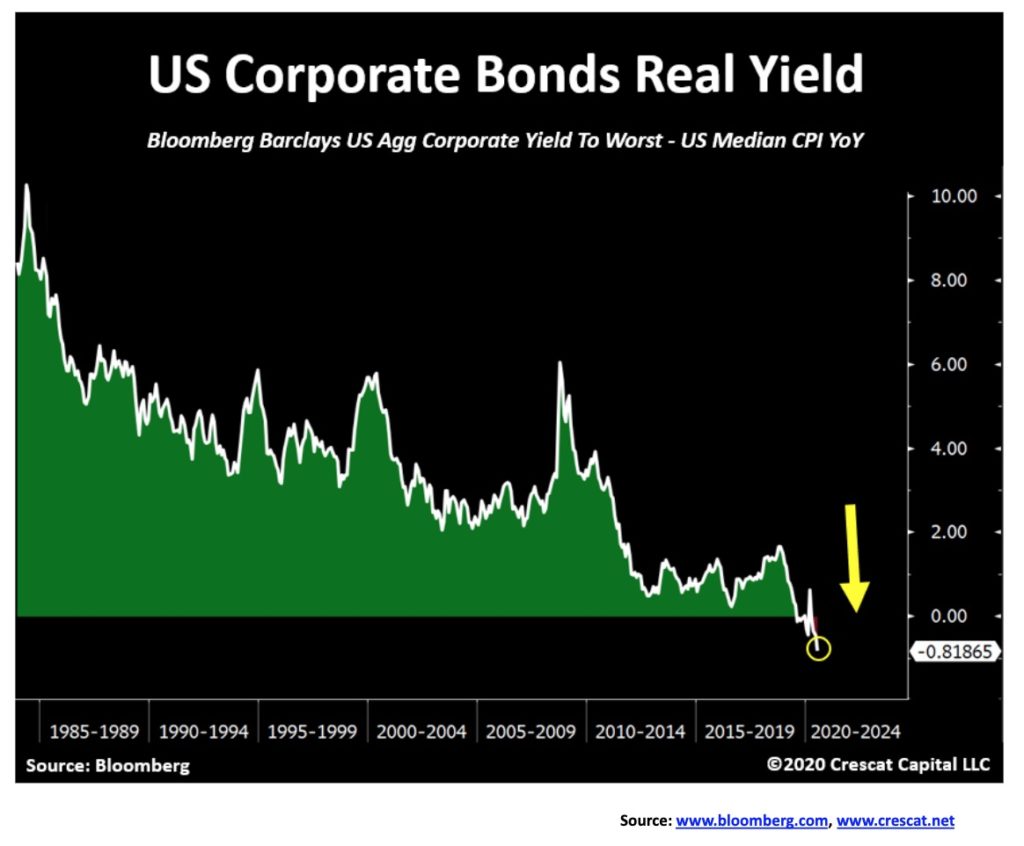
U.S. corporate bond issuance in 2020 has hit a record $1.919 trillion. At the same time, real yields in for the average corporate bond are at the lowest level they have ever been and are even turning negative. Corporate bond issuance also includes foreign borrowers. A recent one was Japanese bank Mizuho which raised $2 billion for junk bond rated hospital operator Tenet Healthcare (THC), a Dallas-based multinational health care services company. All this is against the backdrop of the pandemic. The concern is that companies are wracking up the debt despite lousy earnings. Airlines have been major fund raisers and, considering that many of them are barely flying these days, it is a rather risky proposition. There are even more issuances expected before the election as they want to take advantage of the low interest rates. Somehow, it seems there is some expectation that this is going to end well. But what if it doesn’t? This is a train that is rolling that few, if any, are paying attention to. Dare we say it could end very badly.
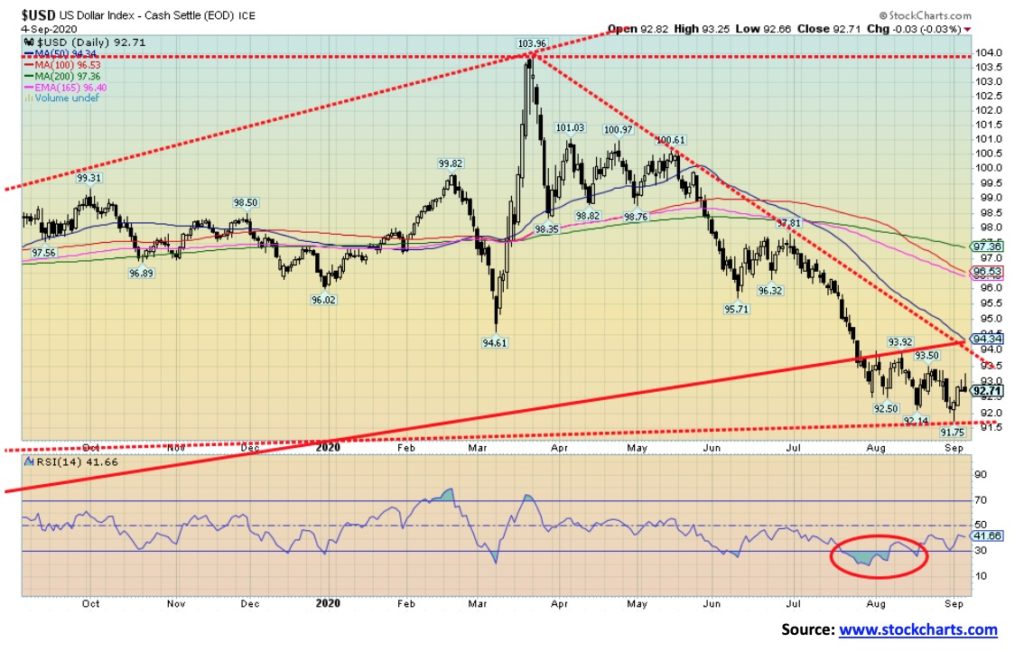
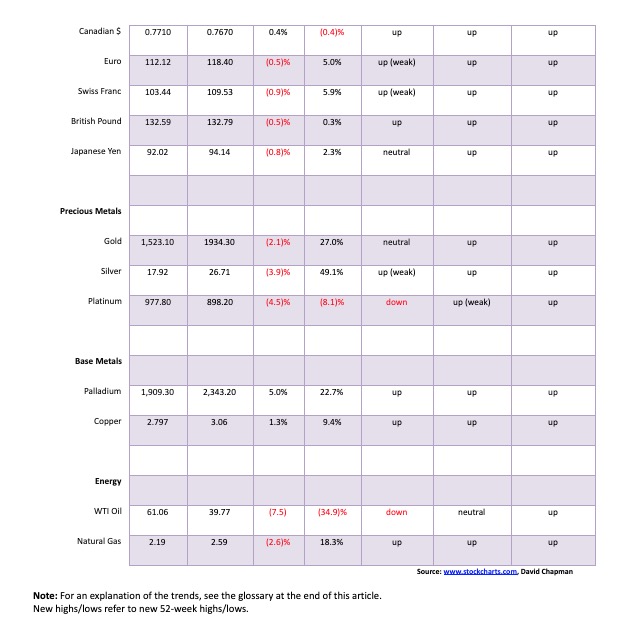
Currencies were generally weaker this past week as the U.S. dollar tried to rally. The US$ Index gained about 0.4%, but most of that was accomplished on Wednesday. On Tuesday it appeared that the US$ Index was poised to break down hitting a low of 91.75, but then it rebounded. Thursday and Friday were spent trying to rally and, in both instances, it was pushed back by the end of the day. Nonetheless, the plunge to new lows was not accompanied by new lows in numerous indicators, giving us potentially positive divergences and suggesting that the next move for the US$ Index is up, not down. Nonetheless, a small bear channel has developed since July with lower highs and lower lows. What is needed to confirm a breakdown is a firm break under 91.50. This past week the euro fell about 0.6%, the pound sterling was off 0.5%, the Swiss franc dropped 0.9%, while the Japanese yen lost 0.8%. Only the Cdn$ bucked the trend, rising about 0.4%.
Thus far, 93 appears to be resistance so a break above that level could have us test 93.50. Above 93.50, the downtrend would be broken and a rise to 94 would be underway. If, however, a downtrend is truly underway, then 91.75 and 91.50 will eventually give away. All this has implications for gold. Gold often rises and falls inversely to the U.S. dollar. So, a rise in the US$ Index could send gold prices lower and a fall in the US$ Index could send gold prices higher. The points for either up or down are now well defined.
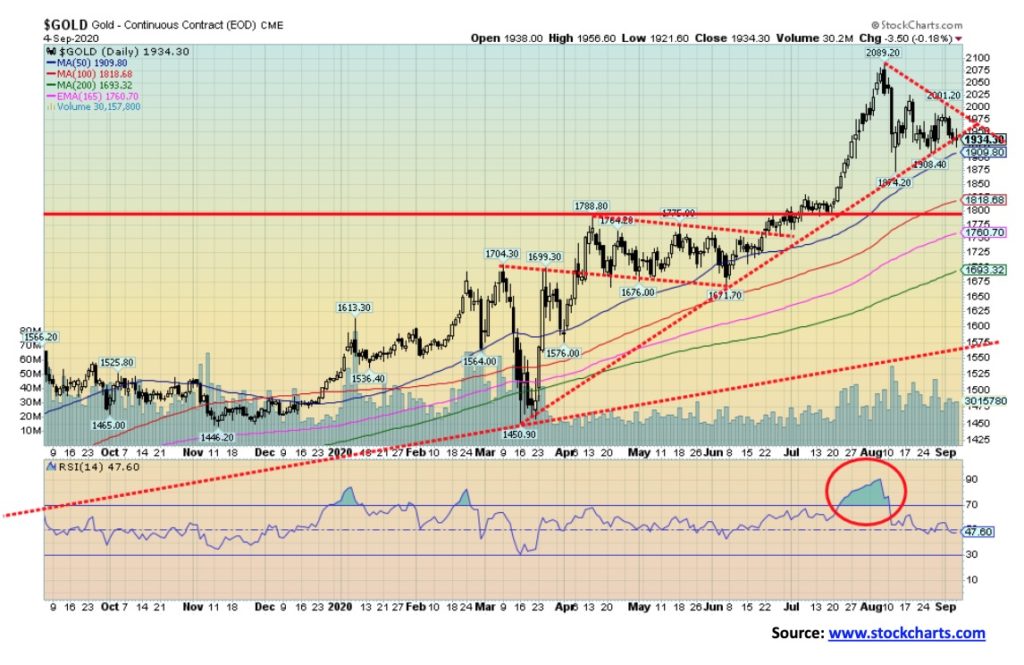
Gold’s attempts to break out to the upside were stymied this past week. An attempt was made at regaining above $2,000, only to see it fail and by week’s end gold ended down 2.1%, losing $40. For the most part the precious metals (PMs) fell as silver lost 3.9% and platinum continued its underperforming woes, losing 4.5%. Platinum is the only PM down on the year, off 8.1%. Gold remains up 27% while silver is up 49.1%. Palladium prices bucked the trend, gaining 5% while copper also bucked the trend, gaining 1.3%. Both metals are up on the year, 22.7% and 9.4% respectively. We had cited previously that gold first needed to regain above $2,000, then above $2,040 to suggest that new highs could be made above $2,090. In many ways $2,000 is a psychological level and resistance here is not surprising. Gold looked like it was about to break its uptrend line from the March 2020 low, although by the week’s end it held the line—barely. We expect that line to break this week and possibly see gold move under its 50-day MA, currently at $1,910. Key becomes the recent low at $1,874. A break of that level could send gold lower towards $1775/$1,800, a level that should provide strong support. We note that the 200-day MA is down near $1,700 and a test of that level cannot be ruled out. Gold fell roughly 15% in March and was off about 7% in June. So, a decline of around 10% or so cannot be ruled out. The decline from $2,090 to $1,874 was just over 10% so our low could already be in. Golds seasonals usually show strength in September with a low in late August to early September followed by a rise into October before another seasonal decline takes place generally into December. As we note with the US$ Index, if the US$ were to fall then that would be positive for gold. For gold to rise, first we must hold above $1,874 the recent low; second, we need to regain above $2,000, and, finally, we need to regain above $2,040/$2,050 to suggest new highs above $2,090. Targets could then be up to $3,000. Could chaos into the election be our catalyst?
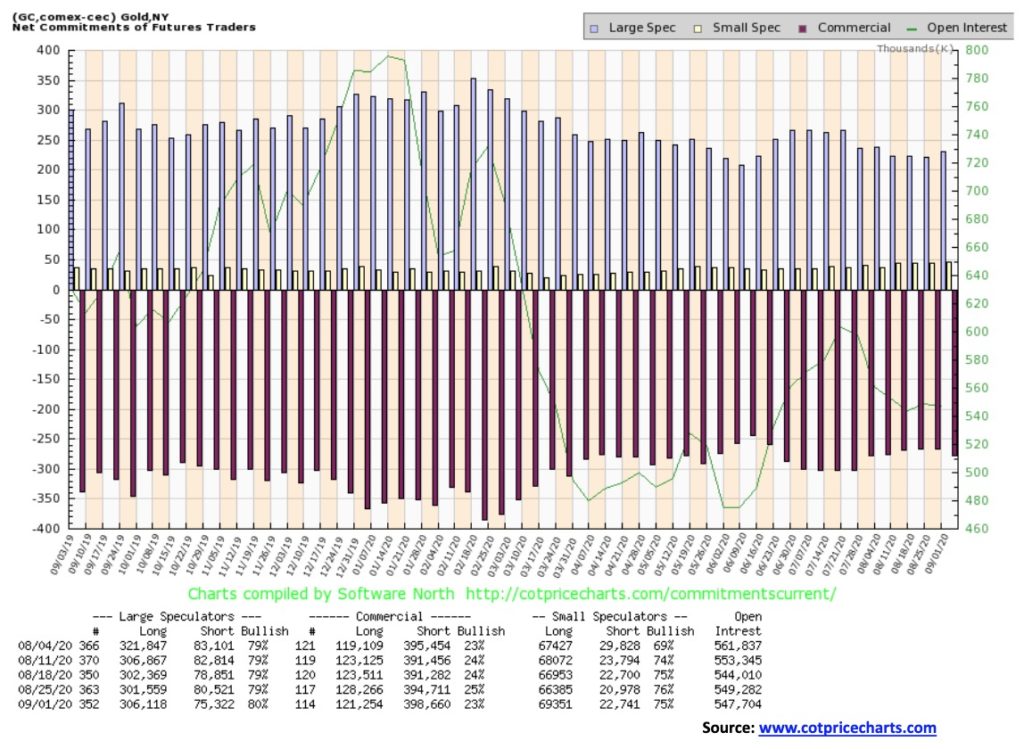
The gold commercial COT disappointed this past week, falling to 23% down from 25% the previous week. Long open interest fell roughly 7,000 contracts while short open interest rose about 4,000 contracts. Overall, open interest was down small, roughly 1,500 contracts. That suggests to us that the decline this past week wasn’t overly bearish. Nonetheless, a decline is what happened and it may be that the market has lower to go before this correction is over.
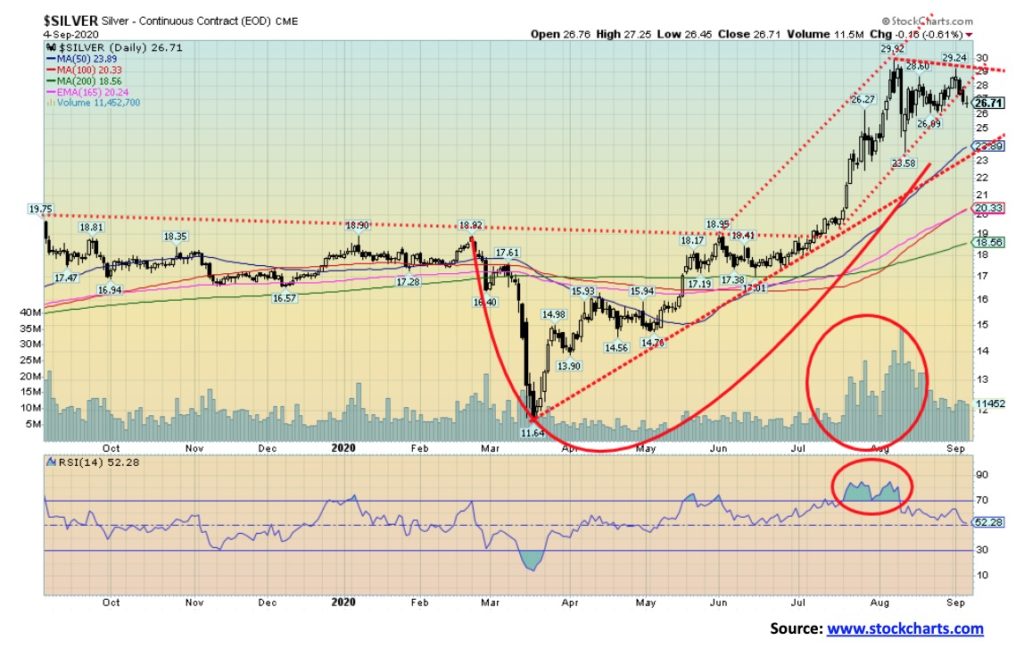
Silver prices fell this past week, losing 3.9%, but remain up 49.1% on the year. Silver broke an uptrend line and appears poised to move lower. The gold/silver ratio which hit a low this week at 68.63 closed out the week at 72.41. The area around 70 was a potential support zone. There is resistance for the gold/silver ratio up to 79 and further resistance up to 85. Only above 85 could the gold/silver ratio turn bearish once again. The 70 zone has been area of both support and resistance on numerous occasions over the past 20 years. With silver breaking an uptrend line from the June/July low there is potential for silver to fall to the next strong area of support near $23.50. As long as silver holds above $26, then the potential remains for silver to return to the upside. The high this past week was at $29.24, short of the August high of $29.91. Silver needed to regain above $28.40 to suggest it could regain the August high. However, it has failed to follow through and silver fell back through that level, suggesting we need to refocus to the downside. The previous low was at $23.58—hence, the suggestion of support near $23.50 which is also an uptrend line from the March low. A break under $23 would be quite negative and suggest further losses down to $18. We believe silver did enter a major up move once it cleared long time resistance at $19/$21. It would be unusual for a breakout of that importance and magnitude to be all over in the space of three or four months. That’s another reason we believe this current move is corrective only.
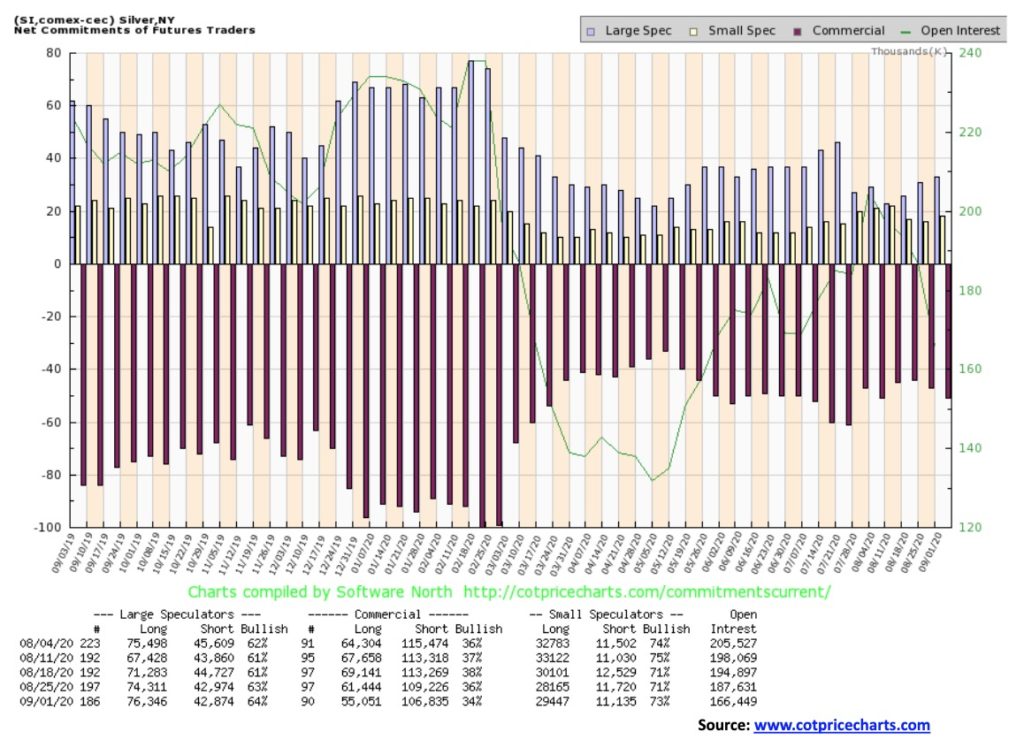
The silver commercial COT slipped this week to 34% from 36% the previous week. That is at least a mildly negative sign. Long open interest fell roughly 6,000 contracts while short open interest was down about 2,500 contracts. Overall, open interest declined over 20,000 contracts. The large speculators COT rose slightly to 64% from 63%. With falling open interest, the decline in prices this past week appears to be mildly bearish. Falling prices with rising open interest is bearish. Mildly bearish is more in line with a market poised for a correction rather than a major move down.
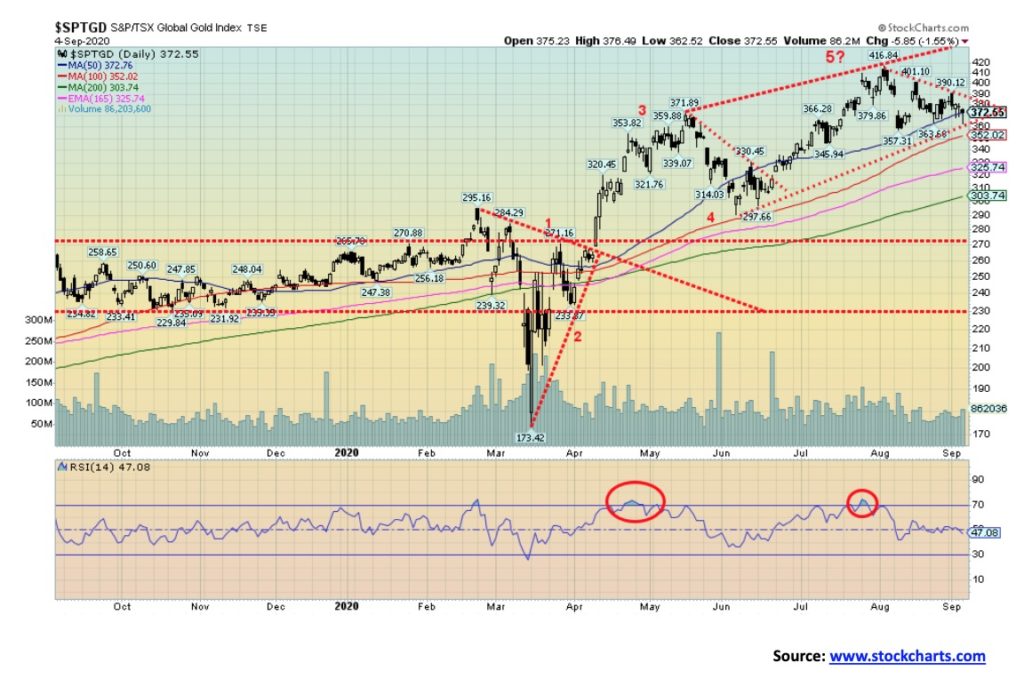
With both gold and silver down on the week it is no surprise to find that the gold stocks fell too. Both the TSX Gold Index (TGD) and the Gold Bugs Index (HUI) fell 2.6% this past week. The TGD is holding an uptrend line but it could break down under 360. The TGD went through a 40% correction in March and another 20% correction in June. Average 30%. A 30% correction now could take the TGD down to 290. The 200-day MA is currently at 304. If the TGD were to fall below 290, the correction could turn into a bear market and targets would be even lower. Currently, there is support at 350 and 325 on the way to 290/300. We note that the February high was at 295 so that should also act as support. We prefer that we do not go below that level. To the upside, the TGD needs to regain above 390 to suggest that we could at least retest the recent high at 417. Friday’s action was somewhat encouraging as, while the TGD fell as low as 362, at one point it rebounded, closing just under 373 at the 50-day MA. This highlights potential support at 360, so if that level breaks, we would know we are poised to move lower to the next level of support near 350. The RSI is currently a neutral 47. Only under 30 does the TGD become oversold. In looking at the pattern forming above, we could argue that we could be forming a potential head and shoulders top. But at this time, it is too early to tell. Nor do we believe we are finished this rally yet. On the other hand, we would not want to be dismissive of the potential. Sometimes markets just don’t do what you want or expect them to do. To keep the potential for a head and shoulders in play, the TGD would need to hold above 300 for a low, then rebound but not break out above 370. Given that our last 33-month cycle low was seen in September 2018, we know the next cycle low is due roughly April 2021 +/- 5 months. So, we are moving into that period starting in December 2020. We have had important lows in December in the past, notably in December 2015 and 2016. The cycle is mostly a gold cycle but the gold stocks tend to follow it as well.
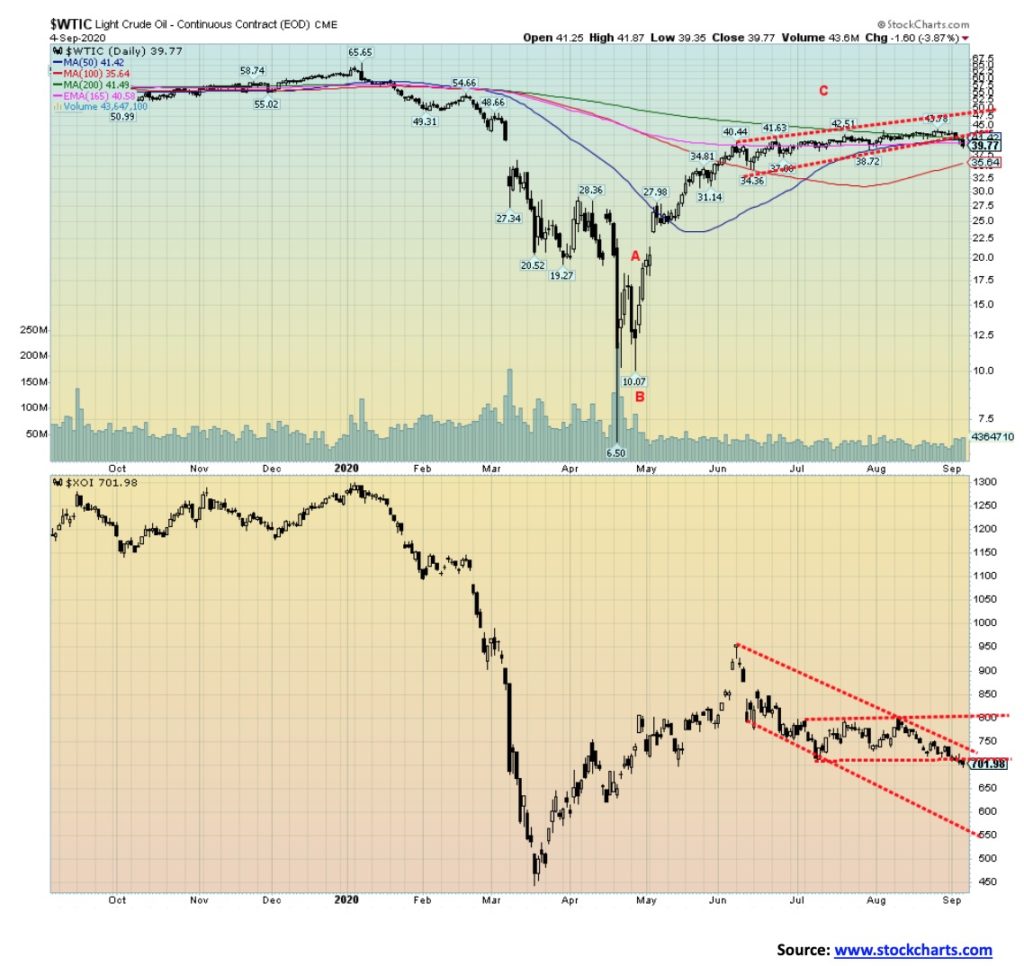
With concerns growing over the state of the economy and the stock markets faltering this past week, oil prices appear to have broken down from their multi-month slight rising sideways pattern. This past week WTI oil fell under $40, losing 7.5% and closing at $39.77. Natural gas (NG) weakened slightly, off 2.6%, and still in its uptrend. The energy stocks followed the stock market south as the ARCA Oil & Gas Index (XOI) dropped 5.0% and the TSX Energy Index (TEN) fell 5.4%. The XOI broke down from what appeared as a sideways corrective and the energy stocks have now returned into the down channel as they appear to be poised for another drop. Potential targets for the XOI are down to 620. For the TEN (not shown), potential targets are down to 55 once it breaks a recent low at 71.76.
We are picking up stories that some Middle East OPEC countries are having problems with their cutbacks to production as it is grossly impacting their budgets. Two stand out—Iraq and Kuwait. Both are suffering severe budgetary constraints and Iraq, in particular, is in dire straights.
With the hurricanes eased for the moment, this is taking away one of the areas that could spark prices higher. Given what looks like a breakdown, the question now is: how low can oil prices go? We have potential targets down to $26 once new lows below $34.35 are seen. There is support for WTI oil down to 35.50 but under that low, new lows below $34.35 (the low seen in June 2020) are probable. A further breakdown in oil prices will wear on the energy stocks and they will fall as well. To remain bullish, oil prices need to find support here, rebound, and take out $42/$43 on the upside. This period until December is a traditionally weak period for oil and the energy stocks, so the fact that we appear to be falling into weak seasonals is not a surprise.
—
(Featured image by Jason Briscoe via Unsplash)
DISCLAIMER: This article was written by a third party contributor and does not reflect the opinion of Born2Invest, its management, staff or its associates. Please review our disclaimer for more information.
This article may include forward-looking statements. These forward-looking statements generally are identified by the words “believe,” “project,” “estimate,” “become,” “plan,” “will,” and similar expressions. These forward-looking statements involve known and unknown risks as well as uncertainties, including those discussed in the following cautionary statements and elsewhere in this article and on this site. Although the Company may believe that its expectations are based on reasonable assumptions, the actual results that the Company may achieve may differ materially from any forward-looking statements, which reflect the opinions of the management of the Company only as of the date hereof. Additionally, please make sure to read these important disclosures.


PayPal’s Slowdown: From Fintech Leader to Low-Growth Dividend Stock
PayPal has shifted from fintech leader to low-growth, value-style stock, losing over 25% in market value and trading at a...


Tilray (TLRY) Falls as Bearish Momentum Persists Despite Marketing Push
Tilray (TLRY) fell 3.32% to $4.44, remaining below key moving averages and signaling continued bearish pressure. Despite a £1 million...


ESG Gap Persists as Firms Struggle to Link Sustainability to Financial Value
KPMG’s Global Survey shows a major gap between ESG awareness and financial integration. While 72% of managers understand sustainability strategies,...


Bitcoin and Ethereum Slide as Market Pressure Builds Amid Strategy Concerns and Layer 2 Disruptions
Bitcoin fell below $60,000 with heavy ETF outflows, pressured by concerns over Strategy’s finances and its STRC stock decline. Ethereum...


AI Venture Builder Launches €600K Crowdfunding Round to Scale Secure AI Solutions
AI Venture Builder, an Italian-British firm developing AI applications and vertical startups, returns to CrowdFundMe with a equity campaign. After...
 |
|
 |  |
 |
|
-

 Cannabis2 weeks ago
Cannabis Legalization in Germany: A Mixed Interim Assessment
-

 Impact Investing3 days ago
EU Weighs More Free Emission Permits in ETS Review to Boost Industry Competitiveness
-

 Impact Investing2 weeks ago
SBTi Net-Zero Standard 2.0 Enhances Corporate Climate Action
-
 Crypto23 hours ago
Bitcoin and Ethereum Slide as Market Pressure Builds Amid Strategy Concerns and Layer 2 Disruptions