Featured
How the Market Reacted to the June Job Numbers
The June job numbers were out on Friday and while they were better than expected it is noteworthy that the U.S. is still short 6.8 million jobs from a year ago. And the population has grown. Many have dropped out of the labor force. Employers still having trouble finding workers. But many of those jobs are low paying and women who normally fill them have been disproportionally hit by the job losses.

The June job numbers beat consensus with the addition of 850,000 nonfarm payrolls. The market had expected a gain of 700,000. The May nonfarm payrolls, originally reported as a gain of 559,000 were revised slightly higher to 583,000. Last March and April the U.S. lost a total of 22.4 million jobs. They have now recovered 15.6 million, leaving them still short 6.8 million jobs. That’s far from recovery, considering that the U.S. population has gone up 1.7 million since February 2020. That means they have recovered almost 70% of the jobs that were lost, even as the total population has grown 0.5%. Of the total, the private sector added 662,000 which was above consensus of 600,000. The government sector added another 188,000 which was above consensus of 80,000. The gains were primarily in leisure and hospitality with other gains in education, professional and business service, and retail trade. The number of people working part-time jumped 408,000 while the number of full-time jobs actually fell by 183,000. (Source: www.stlouisfed.org).
U.S. Job Numbers
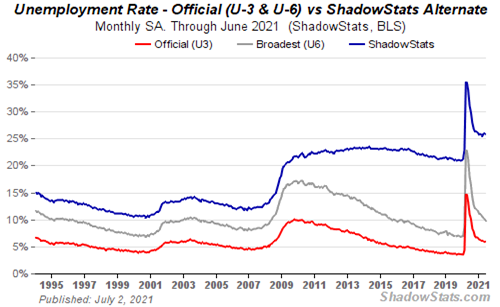
The unemployment rate (U3) rose unexpectedly to 5.9% from 5.8% in May. A year ago in February, the unemployment rate was 3.5%. Adding in the number of people who are not working but consider themselves still employed although not working, the unemployment rate rises to 6.1%. The BLS continues to note this in their monthly statement. The U6 unemployment rate fell to 9.8%, down from 10.2%. The U6 unemployment rate is U3 unemployment plus short-term discouraged workers and other marginally attached workers and those forced to work part-time because they can’t find full-time employment. The U6 is the Bureau of Labour Statistics’ (BLS) broadest measurement. Shadow Stats (www.shadowstats.com) also provides an unemployment number which is the U6 BLS number plus long-term discouraged workers and those defined out of official existence in 1994. The Shadow Stats unemployment fell to 25.8% from 26.0%. In February 2020, the Shadow Stats unemployment number was 21.3%.
The Civilian Labour Force grew by 151,000 in June to 161,086 thousand. February 2020 saw the Civilian Labour Force at 164,448 thousand so it is actually down 3,362 thousand since the pandemic got underway over a year ago. The labor force participation rate was 61.6%, unchanged from May but well down from the 63.3% seen in February 2020. The Employment-Population Ratio was unchanged at 58.0% but down from 61.1% in February 2020. The total number of unemployed rose by 168,000 to 9,484 thousand. In February 2020 the number unemployed was 5,717 thousand. Using the U6 unemployment rate, the real unemployed is 15,786 thousand. Using Shadow Stats unemployment numbers, the total unemployed jumps to 41,560 thousand. Those not in the labor force totals 100,253 thousand. Of that some 55,648 thousand are retired and 9,538 thousand are disabled. The number wanting a job now and not in the labor force fell slightly to 6,428 thousand down from 6,600 thousand in May.
A number that caught our attention was a decline in the number of hours worked to 34.7, down from 34.8 in May. But that May number was revised down from 34.9. The drop was attested to a fall in manufacturing hours due to parts shortages. That alters shifts and hours worked. Average hourly earnings rose 0.3% in June and 3.6% year-over-year. The market had expected a rise of 0.4% in June and 3.7% year over year. With continued high unemployment and wages and salaries not rising as much as expected, any concerns over wage inflation are being dampened.
The sector that saw the biggest jump in employment was leisure and hospitality with a gain of 343,000. That accounted for 40% of June’s increase. Manufacturing was up a modest 15,000 but employment fell in construction and motor vehicle assembly plants. Parts shortages were cited for the declines.
Overall, while the number was better than expected, the U.S. economy is still struggling to get back on its feet. Yes, more people are now vaccinated. That helps. But many jobs remain unfilled. Some are blaming the benefits but that has been shown to be largely bogus. Lack of affordable childcare and continued fear of COVID in the workplace keeps many, especially women, from working. Many have retired, thanks to a record stock market and surging house prices. They then become part of not in the labor force.
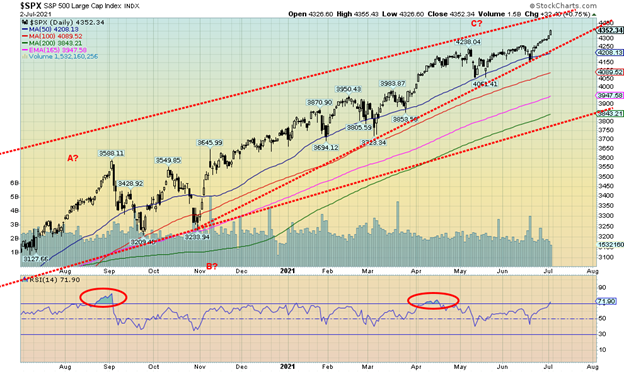
So how did the market react? The stock market surged to record levels. Okay, not all. The S&P 500 gained 1.7% to a record high while the NASDAQ surged 1.9% to a record high, thanks to shift back into risk growth stocks and out of value stocks. The Dow Jones Industrials (DJI) did not join the party but gained 1.0%. The Dow Jones Transportations (DJT) is well off its highs, gaining a small 0.4% this past week. Of the two the DJI is closer to a new all-time high than the DJT. The small cap S&P 600 actually fell 1.4% on the week and is fast fading. Small caps are usually the leaders in a bull market but underperform in a bear market. Others joining the all-time high party were the NASDAQ 100, the S&P 100 (OEX), Wilshire 5000, the Russell 1000 and 2000, and the Philadelphia Semi-Conductor Index (SOX). Notably, the S&P 500 Equal Weight Index did not once again make new highs, a divergence. Facebook, Google, Microsoft, and Nvidia all made new all-time highs as did the NYSE FANG Index. Could the S&P 500 be heading to a nirvana high over 4,400? Seems that way. However, the top of the channel looms. The index breaks down under 4,200.
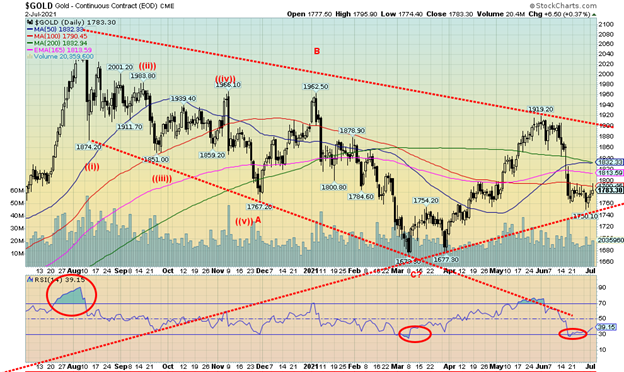
Other reactions from the employment numbers saw bonds fall as the U.S. 10-year treasury note dropped to 1.43% from 1.52% the previous week. This is significant because the cry is that there is inflation. But bond yields are falling, not rising. Inflation? What inflation? A break under 1.40% could send yields down even further. The US$ Index fell after rising earlier in the week while gold rose after falling earlier in the week. Despite the rise in gold prices, gold remains below a potential breakout to confirm a low above $1,820/$1,830. The precious metals gained on the week with gold up 0.3% and silver up 1.6%. The gold stocks gained as well with the Gold Bugs Index (HUI) up 0.5% and the TSX Gold Index (TGD) gaining 0.8%. Both were down earlier in the week. Oil prices rose to another 52-week high with WTI oil up 1.5%, closing over $75 while natural gas (NG) also hit a 52-week high, up 4.0%. But the energy stocks faltered with the ARCA Oil & Gas Index (XOI) down 1.5% and the TSX Energy Index (TEN) off 1.3%. A divergence signaling a potential top?
Overall, while the U.S. chortled that things are booming, thanks to another big rise in employment, the reality is they remain well short of where they were before the pandemic. Meanwhile, the population grew and millions remain out of work and some may never find work again. Yes, the U.S. is getting vaccinated and that helps. But the costs of the record heatwave in the West coupled with a record drought have not yet been tallied.
The U.S. infrastructure remains a disaster waiting to happen (see Surfside City) and the full effects of climate change have not been determined as the U.S. and many other jurisdictions (Canada?) remain unprepared for the consequences and the eventual soaring costs. Meanwhile, the political divide is as bad if not worse today than it was at the time of the 2020 election. The consequences of the January 6, 2021 insurrection on Capitol Hill are not resolved. How all this impacts economic growth going forward is undetermined but none of it is positive. Meanwhile, money supply (M1) grew 1.5% in May and is up an astounding 377% since February 2020. The Fed’s balance sheet grew $143 billion or 1.8% in June and is up 94% since February 2020. QE continues unabated ($120 billion/month), yet the Fed drained the financial system a record $992 billion with reverse repos on June 30, 2021. Yes, almost a trillion dollars. Something is not right.
Chart of the Week
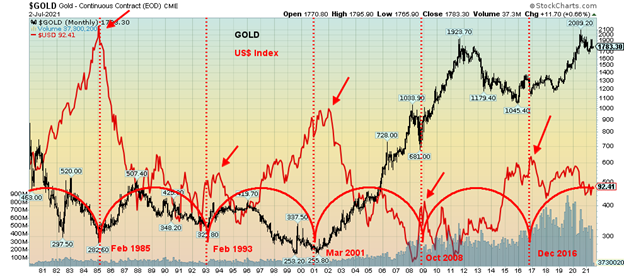
Tom McClellan of McClellan Financial Publications (www.mcosillator.com) noted an 8-year cycle for gold and the U.S. dollar in a recent “Chart in Focus.” An 8-year cycle for gold fits well with Ray Merriman’s (www.mmacycles.com) 7.83-year cycle for gold. The chart above shows our take.
Given gold’s lack of free-trading history, cycles start from the clear gold trough seen in August 1976. After that there was a significant low in February 1985 (8.5 years), February 1993 (8 years), March 2001 (8.1 years), October 2008 (7.6 years), and December 2016 (8.2 years). The range is considered to be 7 to 9 years. We centered our Fibonacci Arc cycle on the February 1985 low, then next on the February 1993 low. The cycle indicator then places where the next low is to be expected. It lined up quite well. If this is correct, then the next 8-year cycle low is due somewhere between December 2023 and December 2025. That will also be, according to Merriman a 23-25 year cycle low dating from the major low in March 2001.
We would also expect a US$ Index high somewhere in that period as well. The high with the US$ Index does not necessarily correspond exactly with the low in gold prices. We’ve indicated the high with the red arrows. Note the actual highs occur either near the low or a few months later.
Note that the December 2016 low was actually a higher low than the December 2015 low which Merriman cites as the 7.83-year cycle low. The December 2016 low was still significant in that it was a higher low, suggesting that the cycles for gold had shifted to the upside and a new 7.83-year cycle was underway. McCellan noted that gold tends to follow 3 years up and 5 years down pattern. However, the period 2001–2008 did not follow that pattern. The 2008–2016 period followed the pattern almost perfectly with a high in 2011. How is the current period doing?
So far, the high was seen in August 2020, 3.7 years after the December 2016 low. Are we now in the down period? So far, that appears to be the case. That is why this coming rally for gold out of the most recent 31-month or even 32-month cycle (8 years divided by 3) low is so important. A failure to make new highs above $2,089 will confirm the down cycle in play. New highs would suggest we could be following closer to the pattern of 2001–2008 and the final high might not be until 2022 or even 2023. Gold bulls, of course, are hoping for a repeat of the 2001–2008 pattern.
MARKETS AND TRENDS
| % Gains (Losses) Trends | ||||||||
| Close Dec 31/20 | Close Jul 2/21 | Week | YTD | Daily (Short Term) | Weekly (Intermediate) | Monthly (Long Term) | ||
| Stock Market Indices | ||||||||
| S&P 500 | 3,756.07 | 4,352.34 (new highs) | 1.7% | 15.9% | up | up | up | |
| Dow Jones Industrials | 30,606.48 | 34,786.35 | 1.0% | 13.7% | up | up | up | |
| Dow Jones Transports | 12,506.93 | 15,036.23 | 0.4% | 20.2% | down | up | up | |
| NASDAQ | 12,888.28 | 14,639.33 (new highs) | 1.9% | 13.6% | up | up | up | |
| S&P/TSX Composite | 17,433.36 | 20,226.11 (new highs) | flat | 16.0% | up | up | up | |
| S&P/TSX Venture (CDNX) | 875.36 | 968.39 | 2.1% | 9.6% | up | up | up | |
| S&P 600 | 1,118.93 | 1,369.68 | (1.4)% | 22.4% | up (weak) | up | up | |
| MSCI World Index | 2,140.71 | 2,325.08 | (0.9)% | 8.6% | down | up | up | |
| NYSE Bitcoin Index | 28,775.36 | 33,526.34 | 2.1% | 16.5% | down | neutral | up | |
| Gold Mining Stock Indices | ||||||||
| Gold Bugs Index (HUI) | 299.64 | 270.34 | 0.5% | (9.8)% | down | down | up | |
| TSX Gold Index (TGD) | 315.29 | 296.65 | 0.8% | (5.9)% | down | down | up | |
| Fixed Income Yields/Spreads | ||||||||
| U.S. 10-Year Treasury Bond yield | 0.91 | 1.43% | (5.9)% | 57.1% | ||||
| Cdn. 10-Year Bond CGB yield | 0.68 | 1.37% | (5.5)% | 101.5% | ||||
| Recession Watch Spreads | ||||||||
| U.S. 2-year 10-year Treasury spread | 0.79 | 1.19% | (4.8)% | 50.6% | ||||
| Cdn 2-year 10-year CGB spread | 0.48 | 0.92% | (8.0)% | 91.7% | ||||
| Currencies | ||||||||
| US$ Index | 89.89 | 92.41 | 0.6% | 2.8% | up | neutral | down | |
| Canadian $ | 0.7830 | 0.8100 | (0.3)% | 3.4% | down | up | up | |
| Euro | 122.39 | 118.68 | (0.6)% | (3.0)% | down | neutral | up | |
| Swiss Franc | 113.14 | 108.60 | (0.4)% | (4.0)% | down | down (weak) | up | |
| British Pound | 136.72 | 138.32 | (0.4)% | 1.2% | down | up | up | |
| Japanese Yen | 96.87 | 90.04 | (0.3)% | (7.1)% | down | down | down | |
| Precious Metals | ||||||||
| Gold | 1,895.10 | 1,783.30 | 0.3% | (5.9)% | down | down (weak) | up | |
| Silver | 26.41 | 26.50 | 1.6% | 0.3% | down | neutral | up | |
| Platinum | 1,079.20 | 1,087.70 | (1.4)% | 0.8% | down | neutral | up | |
| Base Metals | ||||||||
| Palladium | 2,453.80 | 2792.50 | 5.9% | 13.8% | neutral | up | up | |
| Copper | 3.52 | 4.28 | (0.2)% | 21.6% | down | up | up | |
| Energy | ||||||||
| WTI Oil | 48.52 | 75.16 (new highs) | 1.5% | 54.9% | up | up | up | |
| Natural Gas | 2.54 | 3.66 (new highs) | 4.0% | 44.1% | up | up | up |
—
(Featured Image by Clem Onojeghuo via Unsplash)
DISCLAIMER: This article was written by a third party contributor and does not reflect the opinion of Born2Invest, its management, staff or its associates. Please review our disclaimer for more information.
This article may include forward-looking statements. These forward-looking statements generally are identified by the words “believe,” “project,” “estimate,” “become,” “plan,” “will,” and similar expressions. These forward-looking statements involve known and unknown risks as well as uncertainties, including those discussed in the following cautionary statements and elsewhere in this article and on this site. Although the Company may believe that its expectations are based on reasonable assumptions, the actual results that the Company may achieve may differ materially from any forward-looking statements, which reflect the opinions of the management of the Company only as of the date hereof. Additionally, please make sure to read these important disclosures.
David Chapman is not a registered advisory service and is not an exempt market dealer (EMD) nor a licensed financial advisor. We do not and cannot give individualised market advice. David Chapman has worked in the financial industry for over 40 years including large financial corporations, banks, and investment dealers. The information in this newsletter is intended only for informational and educational purposes. It should not be considered a solicitation of an offer or sale of any security. The reader assumes all risk when trading in securities and David Chapman advises consulting a licensed professional financial advisor before proceeding with any trade or idea presented in this newsletter. David Chapman may own shares in companies mentioned in this newsletter. We share our ideas and opinions for informational and educational purposes only and expect the reader to perform due diligence before considering a position in any security. That includes consulting with your own licensed professional financial advisor.


The TopRanked.io Weekly Affiliate Marketing Digest [The Top VPN Affiliate Programs Roundup]
Want to be let in on a little secret about two massive affiliate opportunities you can take advantage of today?...


Sustainable Finance Faces Hurdles as Green Asset Ratio Reforms Fall Short of Full Transparency
The Green Asset Ratio (GAR) measures banks' alignment with the EU Taxonomy but remains low due to methodological flaws and...


XRP Hits New All-Time High Amid U.S. Crypto Policy Shift and Ripple’s Expansion
XRP surged past its 2018 all-time high, reaching $3.65 amid renewed political support for crypto in the U.S. under Trump....


Germany Moves to Curb Medical Cannabis Abuse, Sparking Access Concerns
Medical cannabis imports in Germany have surged, but health insurance-covered prescriptions remain low. Easy online access raises concerns about abuse...


JPMorgan’s Data Fees Shake Fintech: PayPal Takes a Hit
JPMorgan Chase will charge fintechs for customer data, threatening business models reliant on free access. PayPal’s stock plunged 5.7% after...
 |
|
 |  |
 |
|
-

 Crowdfunding1 week ago
PMG Empowers Italian SMEs with Performance Marketing and Investor-Friendly Crowdfunding
-

 Markets5 days ago
Markets Wobble After Highs as Tariffs Rise and Commodities Soar
-
 Markets2 weeks ago
The Big Beautiful Bill: Market Highs Mask Debt and Divergence
-

 Africa2 days ago
ORA Technologies Secures $7.5M from Local Investors, Boosting Morocco’s Tech Independence