Featured
How the markets will perform in 2020
Stock markets may have seen an important moment on January 2, 2020. Gold soared and bond yields fell as safe havens were sought. 2019 was a very good year. But can 2020 match it? The New Year and new decade has started off with a bang. However, years ending in zero have a poor losing record for stock markets. It is an election year in the U.S., one that promises to be very controversial.
The New Year started off with a bang. One cannot ignore politics when it comes to markets. And some like the assassination of Iran’s most powerful general Qassem Soleimani sparked a market firestorm. At one-point WTI oil was up almost 5%. It settled up 3.1%. Gold leaped settling up $24 for the near futures contract. That the U.S. dollar leaped was probably not a surprise. But it didn’t last long and the US$ Index closed unchanged and flat on the week. Bonds rallied as the U.S. 10-year Treasury note fell 8 bp to 1.80%. Canada’s 10-year Government of Canada bond (CGBs) also fell 5 bp on the week and also 8 bp overnight closing at 1.54%. Finally, the stock markets as the Dow Jones Industrials (DJI) dropped 234 points or 0.8%. The DJI along with the S&P 500 and the NASDAQ had closed the prior day at all-time record highs.
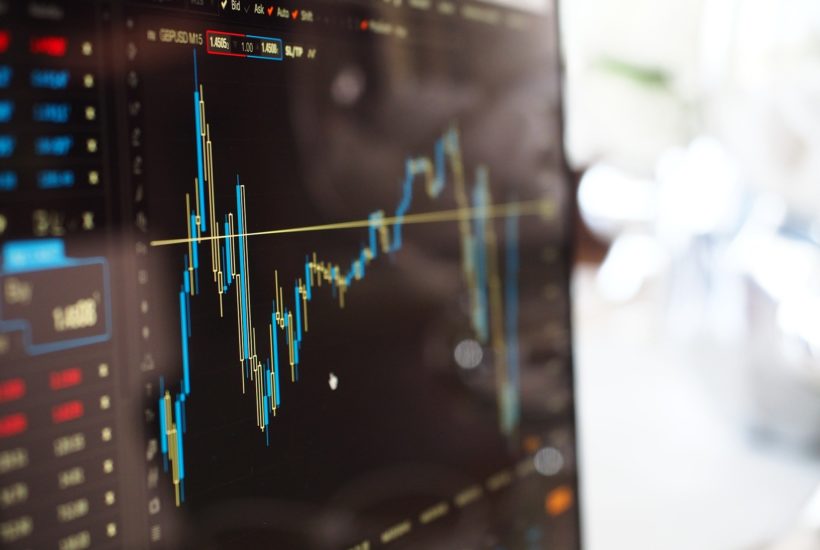
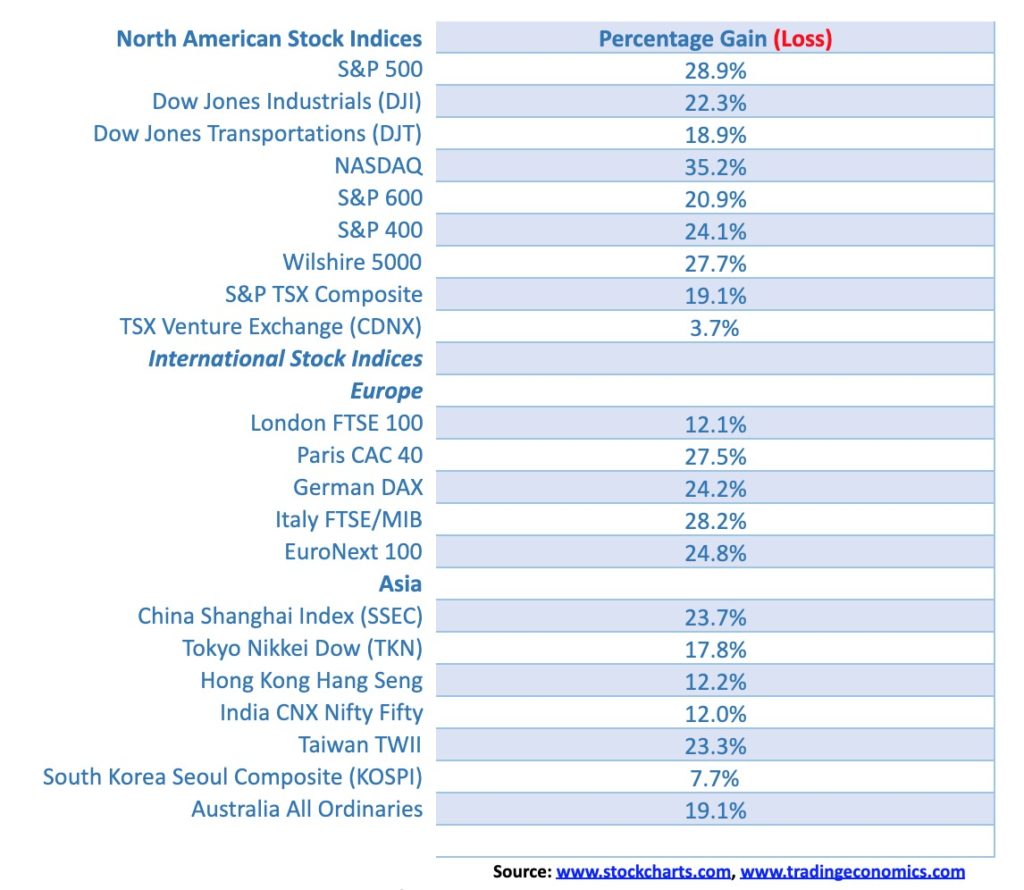
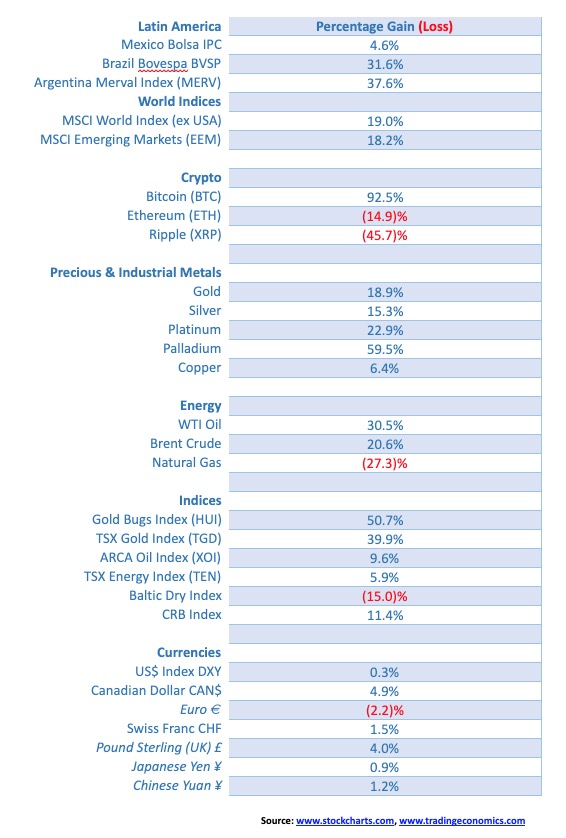
2019 – The Year in Review
No doubt it could have been worse. But then what this has sparked is a leap into the unknown. No one knows what is going to happen next. Maybe everything and maybe nothing. Although the latter is unlikely given Iran’s statement vowing “harsh revenge”. Trouble is we don’t know when, how or against what. And that brings us market uncertainty. It has raised security concerns all around the world.
Political risk is nothing new. From Brexit to the election of Trump to the trade wars with China, the EU and others, the protests in Hong Kong, Chile and many more. The first year of the new decade promises to be one filled with political risk particularly leading up to the U.S. election in November. Markets may embark on a roller coaster ride if the start to the New Year is an example. Yes, it could have been worse but the possible muted reaction may just be a cautious one to the events and further assessment is required of the risks involved.
“……. there are known knowns; there are things we know we know. We also know there are known unknowns; that is to say we know there are some things we do not know. But there are also unknown unknowns—the ones we don’t know we don’t know. And if one looks throughout the history of our country and other free countries, it is the latter category that tend to be the difficult ones.”
Donald Rumsfeld, American politician, Secretary of Defense 1975-1977, 2001-2006, U.S. congressman 1963-1969, Director of the Office of Economic Opportunity 1969-1970, counsellor to the President 1969-1973, U.S. permanent representative to NATO 1973-1974, White House Chief of Staff 1974-1975, American businessman b. 1932
We are reminded of Donald Rumsfeld’s famous saying. The assassination of Soleimani is a classic example. Will the markets shrug it off figuring nothing will come of it? Or will the markets take a turn for the worse realizing that this is a serious threat? The problem is we don’t know and that makes the markets a potentially risky endeavour going forward. Global shipping is already in a decline. It could get even worse. A third of the world’s liquified natural gas and a quarter of the world’s oil goes through the Straits of Hormuz. The straits are only 39 km wide bordering Iran on one side and Qatar and the U.A.E. on the other. Attacks have previously taken place against tankers. 64.5% of the world’s proven oil reserves lie in the vicinity of the Middle East. A reminder that sharply rising oil prices have preceded every recession since the 1970’s.
The ISM purchasing managers Index peaked back in August 2018. It has been falling ever since. For the past five months it has recorded steady readings under 50 indicating that the U.S. manufacturing sector is already in a recession. In December 2019 the ISM PMI came in at 47.2 the lowest since June 2009.
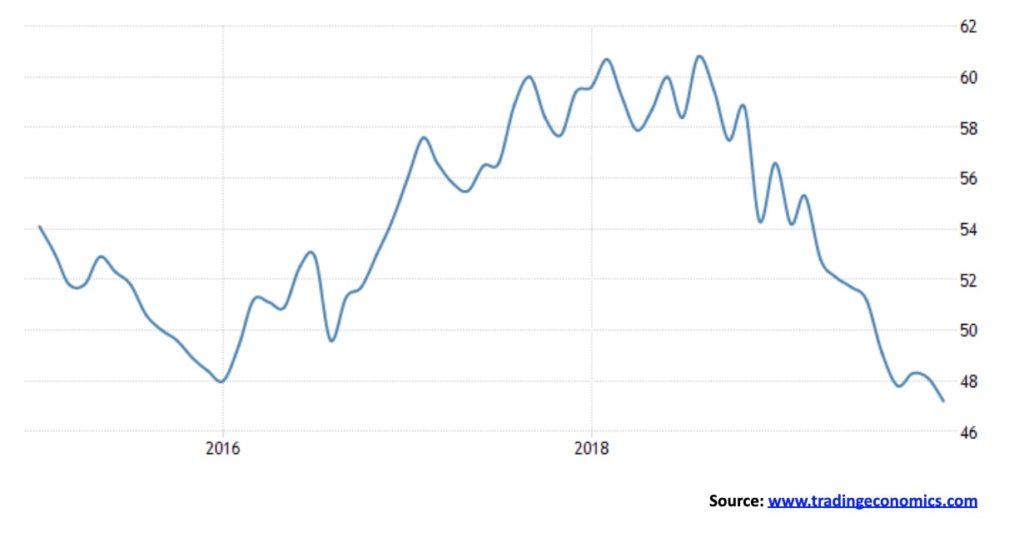
U.S. ISM Purchasing Managers Index (PMI) – ©David Chapman
This coming week we’ll get our first sense of the U.S. economy going into 2020 with the release Friday of nonfarm payroll and unemployment for December 2019. The market consensus is a gain of 160,000 vs. November’s surprise gain of 266,000. The unemployment rate (U3) is expected to remain at 3.5%.
The decade may also see the bills come due as a result of climate devastation. The world is watching Australia burn. Fires have already consumed an area the size of Massachusetts and the summer is just beginning. The death toll and economic devastation is just starting to be realized. And the smoke has cast a pall over the continent and beyond even covering the glaciers of New Zealand that would hasten melting. In Indonesia rains have flooded cities including one of the world’s largest Jakarta along with others. The death toll is mounting. One cannot live in such conditions. The region holds millions. The real costs of fighting climate devastation are just getting underway and it will be in the trillions. The question is what, who and where will it hit next. No area of the world is immune.
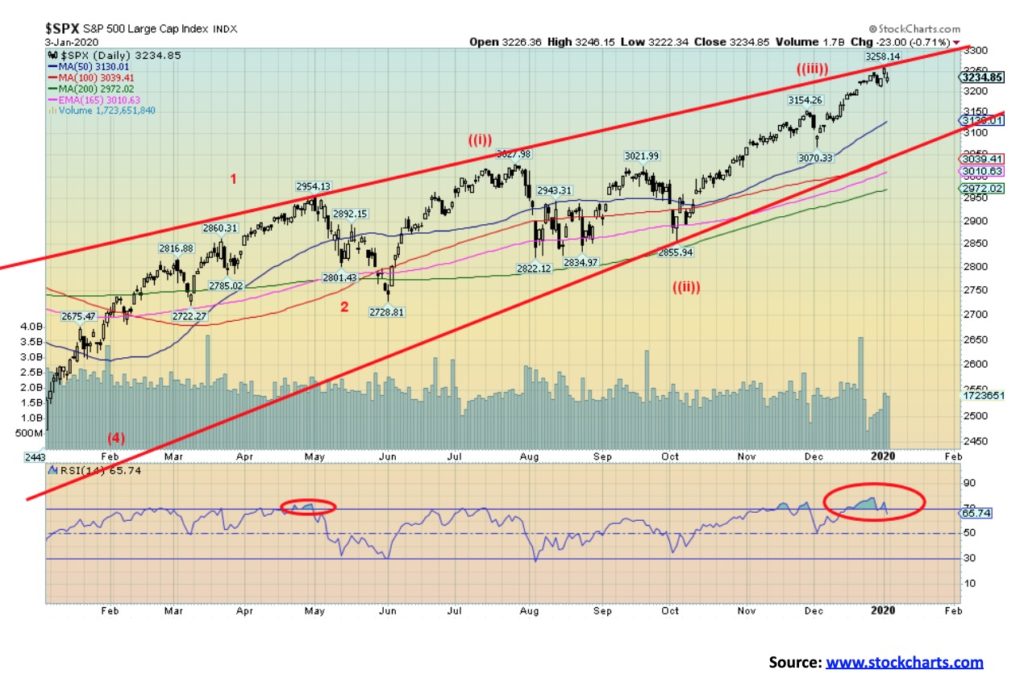
With those cheery thoughts behind us we couldn’t help but notice that the spike to new all-time highs on the S&P 500 came right at the top of the channel on January 2, 2020. In looking back, it reminded us of the final high of the Tokyo Nikkei Dow (TKN) that came – you guessed it – on January 2, 1990. It’s never been close since a period of 30 years. On January 3, 2020 the S&P 500 opened below the low of January 2, 2020. We sense that the markets are about to leave a little island above behind. The first good sign of a breakdown would be break under 3,200. Bigger fireworks and downside erupt under 3,100 and 2,950. Note how the RSI held over 70 throughout the latter part of December. We also note that CBOE put/call ratio was at a level favouring calls over puts rarely seen over the past 20 years. Those levels were always seen at significant market tops.
For the past twenty years seasonality patterns have shown that January is not a very good month for markets. Seasonals show that rallies get underway in October and tend to peak the first week of January before bottoming late in the month and another rally gets underway. The unanswered question of course is this a temporary top or is this something bigger. If the S&P 500 were to breakdown under 2,950 it might be moving into something bigger. Confirmation would come under 2,850 and especially under 2,700.
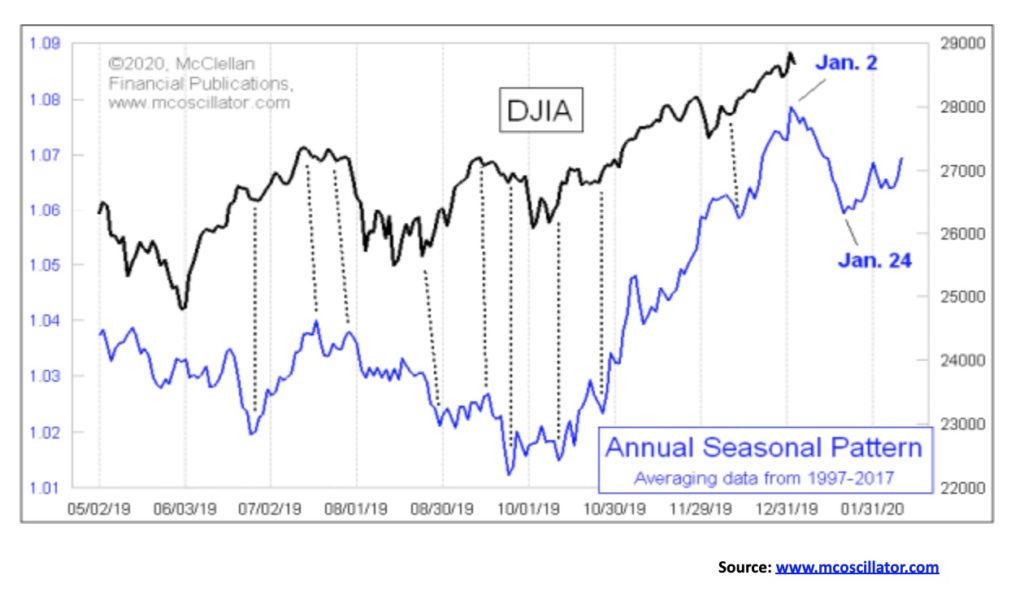
The bulls will argue that there is probably nothing to be worried about. This will just be temporary. The NYSE advance-decline line was still making record highs suggesting that the bull is alive and well. The McClellan Summation Index (RASI) is back over 500 although it has made a lower high. A number of markets only recently broke out and despite some areas of slowing (i.e. manufacturing) the U.S. economy continues to chug along. But the warning signs are there and the unknowns that could set the market just grew.
And then there is the repo crisis. We still don’t know what is going on. What we do know is that interest rates were starting to creep higher and the Fed wanted to keep them under control. As well the “Tweeter in Chief” continued to hammer the Fed crying out for lower even negative interest rates. If negative interest rates were such a panacea then the EU and Japan should be jumping for joy. Except people are becoming increasingly reluctant to hold all those negative interest bonds. The negative interest rates are undermining the euro as a reserve currency. There is also the potential of liquidity crisis somewhere and our suspicion falls heavily on the EU banking system. The repo program is not as many claim QE4.
We are moving into a period of unknowns and it is going to come back and haunt global stock markets.
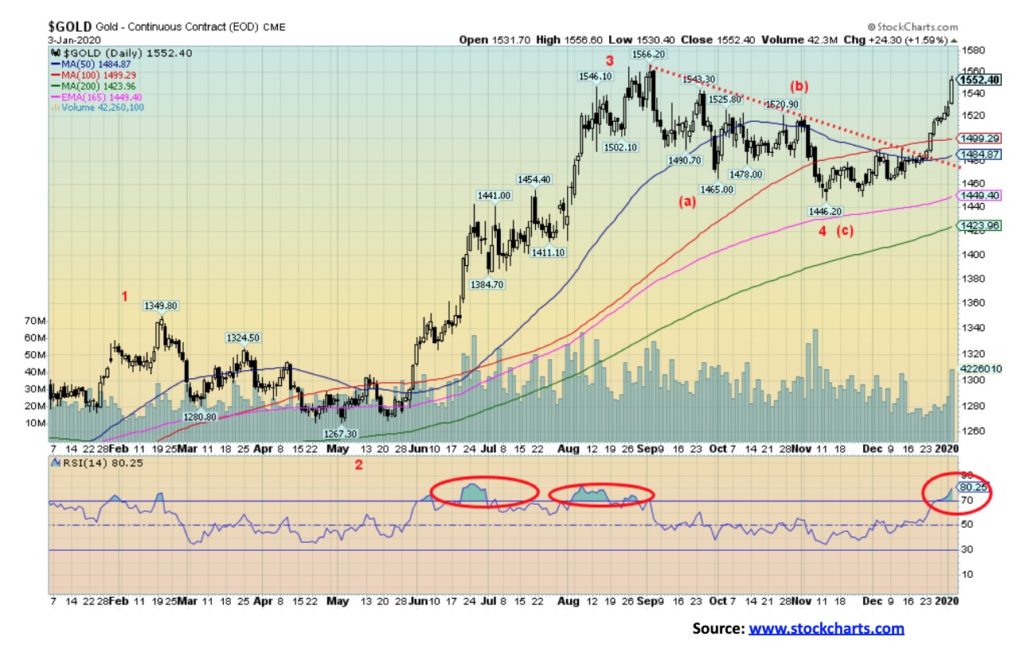
Gold was a significant beneficiary of the “hit” on January 3, 2020 soaring $24 on the day for the near futures contract. Gold was a beneficiary of a rush to safe havens that also included bonds. In closing over $1,550 we have taken out the next resistance line. Follow through this coming week will be key as we need to see it gold continue to hold $1,550 with key support now at $1,520/$1,525. The next move needs to take out the September high of $1,566. A move and confirmed closes above that level could target us eventually to new all-time highs above $1,920 the September 2011 high. Our initial target is $1,605 and beyond that $1,725.
Short-term there are a few negative signs. Silver did not perform as well as gold this past week. Silver hit a high of $18.33 on Friday before settling back closing at $18.15 up a rather muted 10 cents on the day. We need to see silver take out and close over $18.35 to convince us that we are firmly moving higher with initial targets up to $20.50. The gold stocks acted as if they don’t believe this. For the past two days both the Gold Bugs Index (HUI) and the TSX Gold Index (TGD) put on early gains and were positive on the day only to see the gains erode and, on both days, closed lower. The HUI has been making new 52-week highs, however, the TGD has not yet made new 52-week highs. Still both indices look positive despite the weakness seen over the past couple of days.
As well the commercial COT has been weakening further. This past week’s report won’t be out until Monday but the previous report showed that the commercial COT for gold slipped to 27% from 28% as some 21,000 contracts were added to shorts. The silver commercial COT also slid to 31% from 33% as short open interest rose by roughly 16,000 contracts. In both instances the large speculators COT became more bullish. Should we be concerned? Well, yes and no. It was telling that through the long run for gold 2009-2011 the commercial COT became increasingly short even as gold kept rising. If there is anything different this time is that the commercial has never been as short as we are currently seeing. It is a cautionary note. As well we note that gold’s RSI has moved firmly above 70 although caution that the RSI can remain overbought for sometime as gold moves higher and before it turns down.
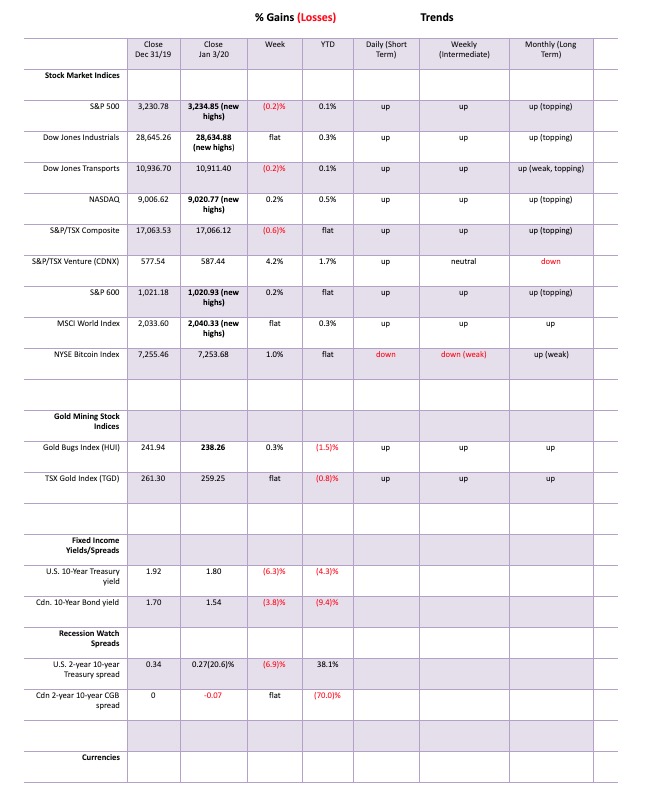
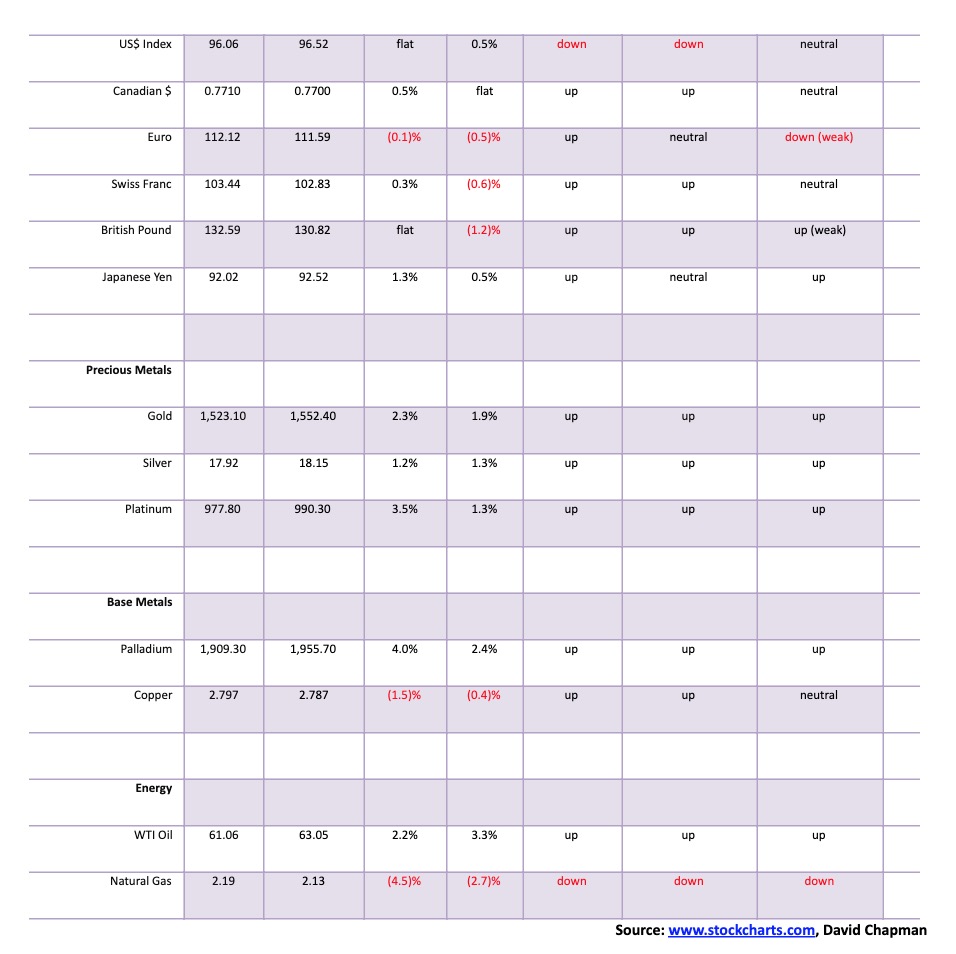
Gold should continue to act as a safe haven given the unknowns that exist. We are referring here to physical gold not gold stocks or gold derivatives including ETFs. In a market meltdown the gold stocks may well follow even as gold itself holds up. Our key support zone for gold is $1,510 to $1,525. As long as we hold above that zone gold should move higher. Seasonals are favourable with tops occurring anywhere from late January to early March before a corrective period invariably steps in. Gold is a safe haven in times of economic, geopolitical and political uncertainty. We note the U.S. dollar is beginning to weaken as the US$ Index broke under a key support zone at 96.50 and continues to stay at or under that zone. Next key support for the US$ Index is at 95.50. The US$ Index is in a downtrend as long as it remains under 97.50.
—
(Featured image by Pexels via Pixabay)
DISCLAIMER: This article was written by a third party contributor and does not reflect the opinion of Born2Invest, its management, staff or its associates. Please review our disclaimer for more information.
This article may include forward-looking statements. These forward-looking statements generally are identified by the words “believe,” “project,” “estimate,” “become,” “plan,” “will,” and similar expressions. These forward-looking statements involve known and unknown risks as well as uncertainties, including those discussed in the following cautionary statements and elsewhere in this article and on this site. Although the Company may believe that its expectations are based on reasonable assumptions, the actual results that the Company may achieve may differ materially from any forward-looking statements, which reflect the opinions of the management of the Company only as of the date hereof. Additionally, please make sure to read these important disclosures.


The TopRanked.io Weekly Affiliate Marketing Digest [The Top VPN Affiliate Programs Roundup]
Want to be let in on a little secret about two massive affiliate opportunities you can take advantage of today?...


Sustainable Finance Faces Hurdles as Green Asset Ratio Reforms Fall Short of Full Transparency
The Green Asset Ratio (GAR) measures banks' alignment with the EU Taxonomy but remains low due to methodological flaws and...


XRP Hits New All-Time High Amid U.S. Crypto Policy Shift and Ripple’s Expansion
XRP surged past its 2018 all-time high, reaching $3.65 amid renewed political support for crypto in the U.S. under Trump....


Germany Moves to Curb Medical Cannabis Abuse, Sparking Access Concerns
Medical cannabis imports in Germany have surged, but health insurance-covered prescriptions remain low. Easy online access raises concerns about abuse...


JPMorgan’s Data Fees Shake Fintech: PayPal Takes a Hit
JPMorgan Chase will charge fintechs for customer data, threatening business models reliant on free access. PayPal’s stock plunged 5.7% after...
 |
|
 |  |
 |
|
-

 Impact Investing1 week ago
Vernazza Autogru Secures €5M Green Loan to Drive Sustainable Innovation in Heavy Transport
-

 Markets4 days ago
Rice Market Slips Amid USDA Revisions and Quality Concerns
-

 Business2 weeks ago
Legal Process for Dividing Real Estate Inheritance
-
 Fintech12 hours ago
JPMorgan’s Data Fees Shake Fintech: PayPal Takes a Hit